Python has become one of the most beloved programming languages of all time. It is flexible, easy to learn and code, open-source, and supported in all the major operating systems out there. For example, it offers a wide range of frameworks and libraries developed by the community to support and facilitate web applications. If you’re a .NET developer, chances are that you have played around with Python already, but, did you know that you can create Python projects in Visual Studio?
This article explores this feature via the creation of a Python web project. It’s important to note, however, that except for the ability to mix code from .NET and Python through projects such as IronPython, this won’t be the main focus here. Perhaps it will be for a future article.
Setting up
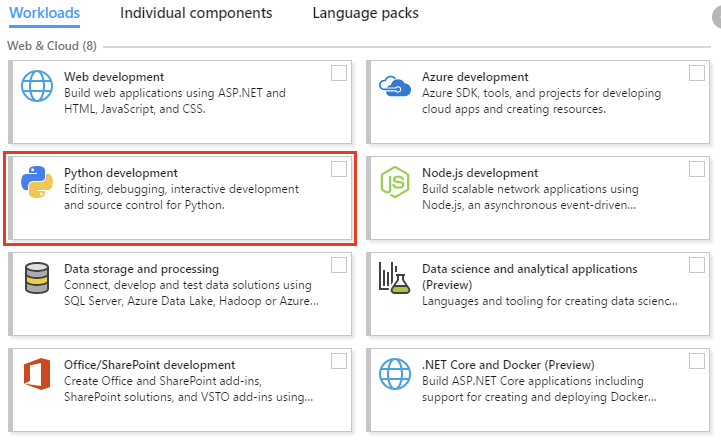
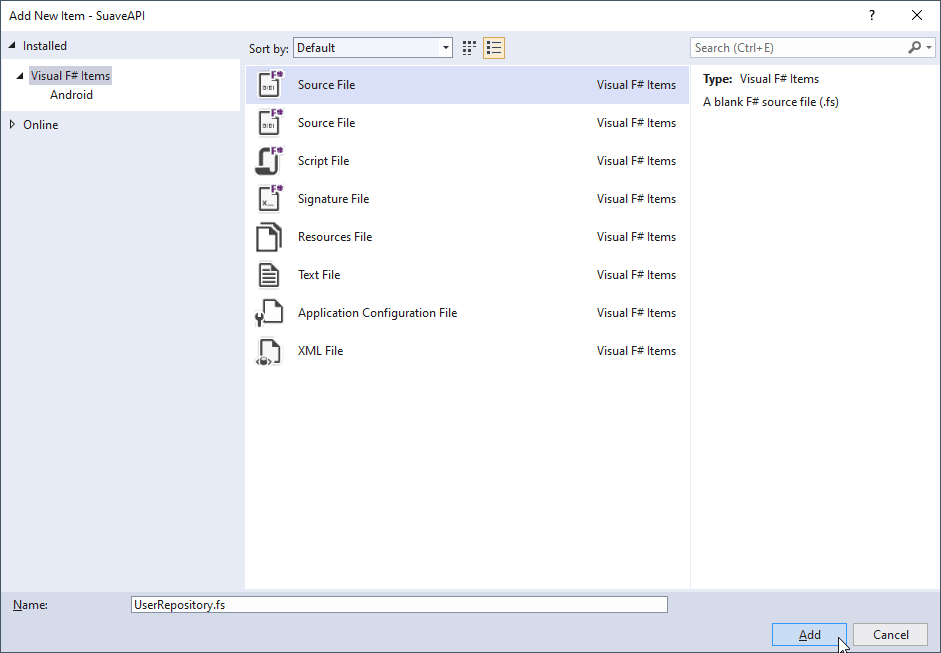
First, you need to make sure the Python workload is already installed for your Visual Studio IDE. Make sure to download and run the installer for the VS Community Edition. Once you open the installer, select the proper Python workload, as shown in Figure 1.

Figure 1. Installing the Python workload
Proceed with the installation. Then, move on to the project creation step.
Project setup
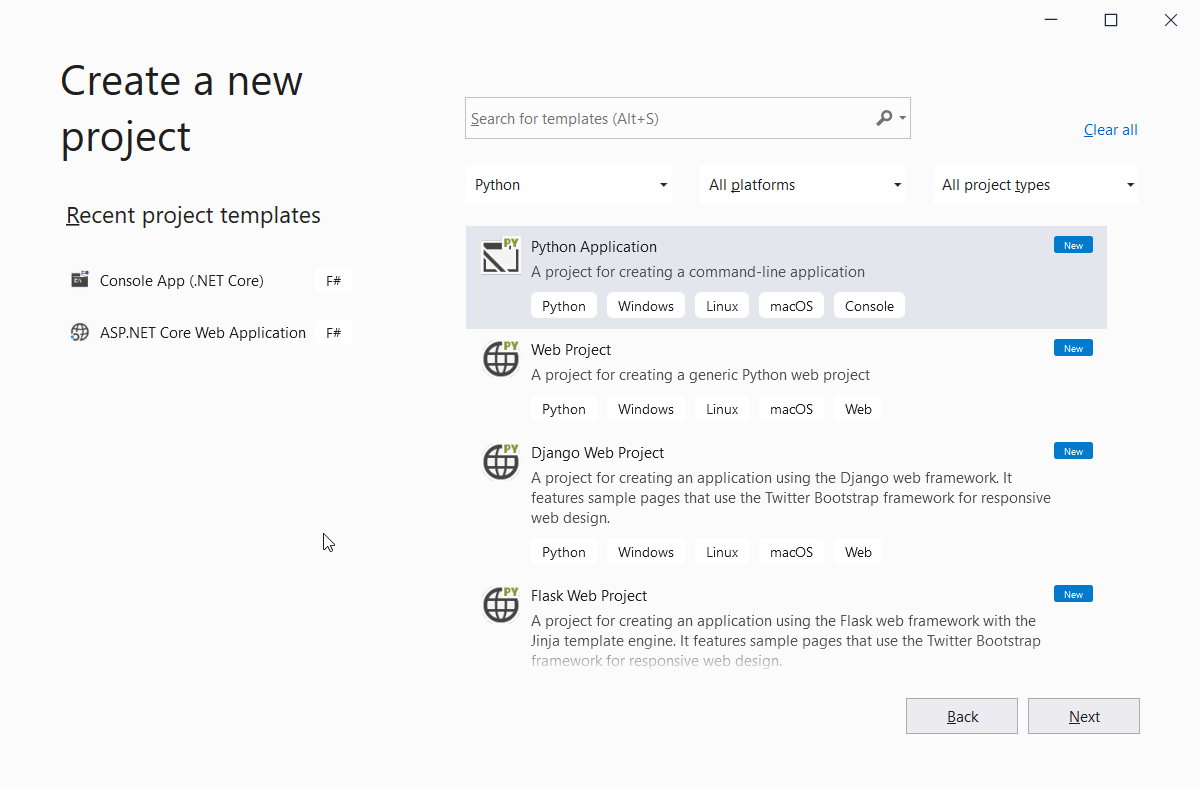
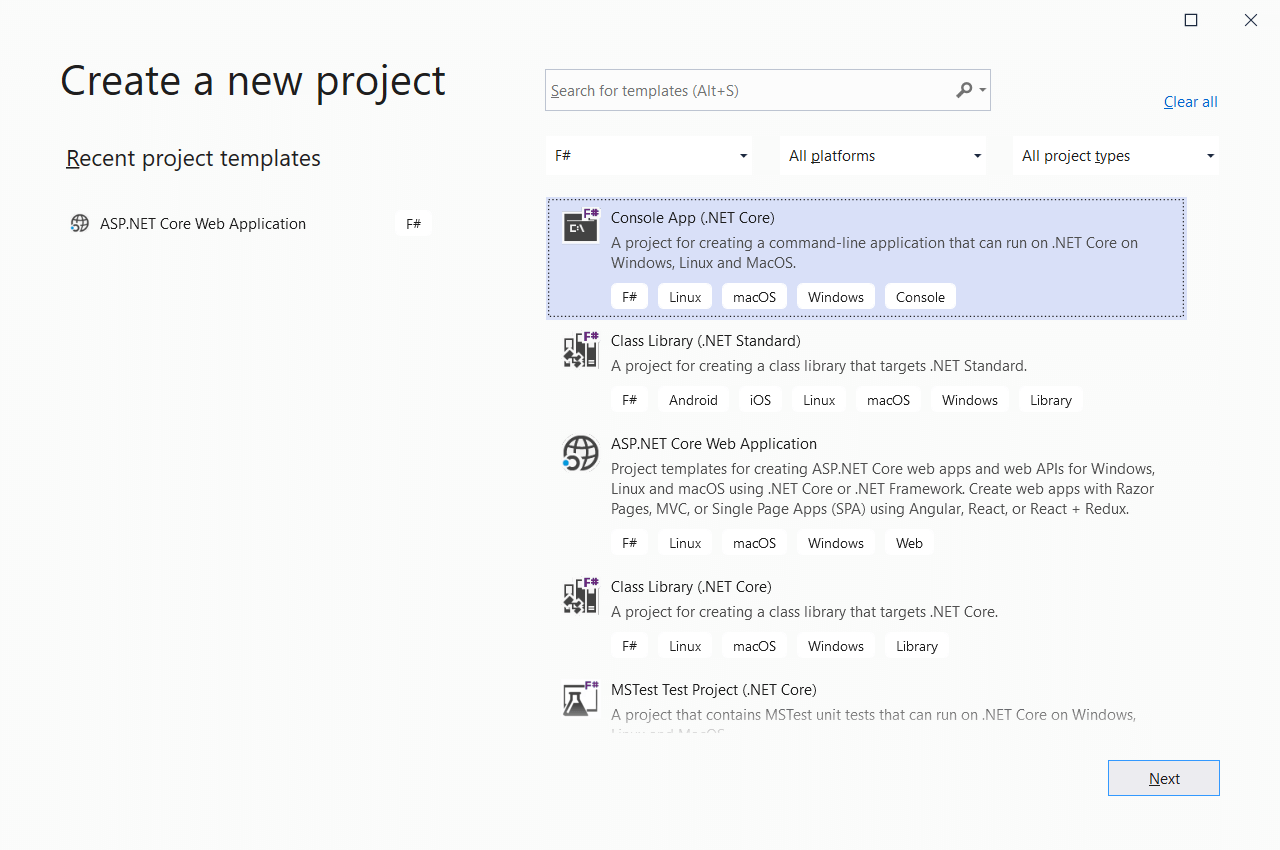
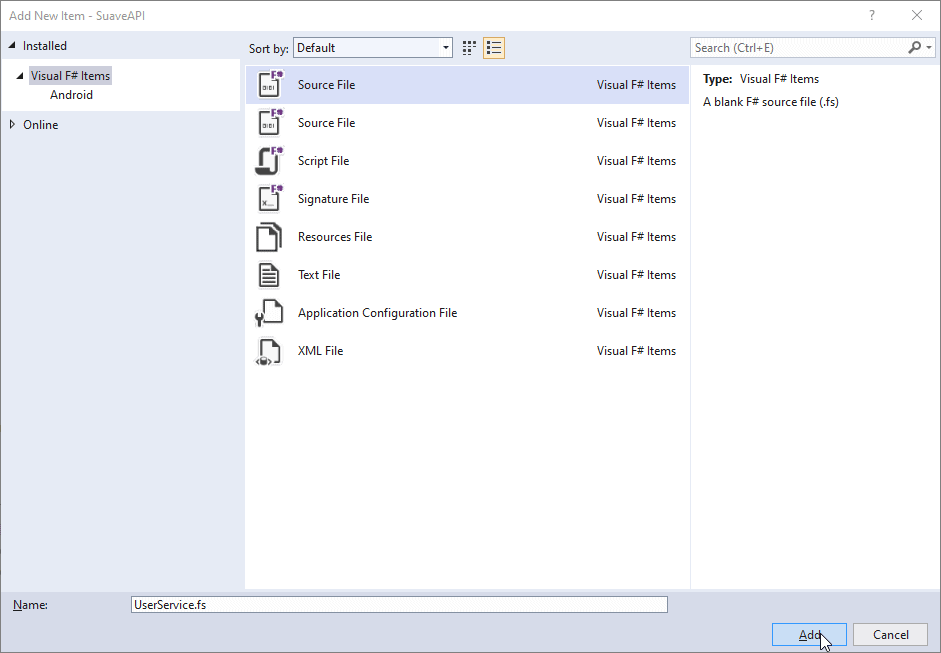
Open Visual Studio, then go to Create a new project and select Python on the Languages combo box. Select the Python Application template on the listed options, as shown in Figure 2.
Figure 2. Selecting the Python project template
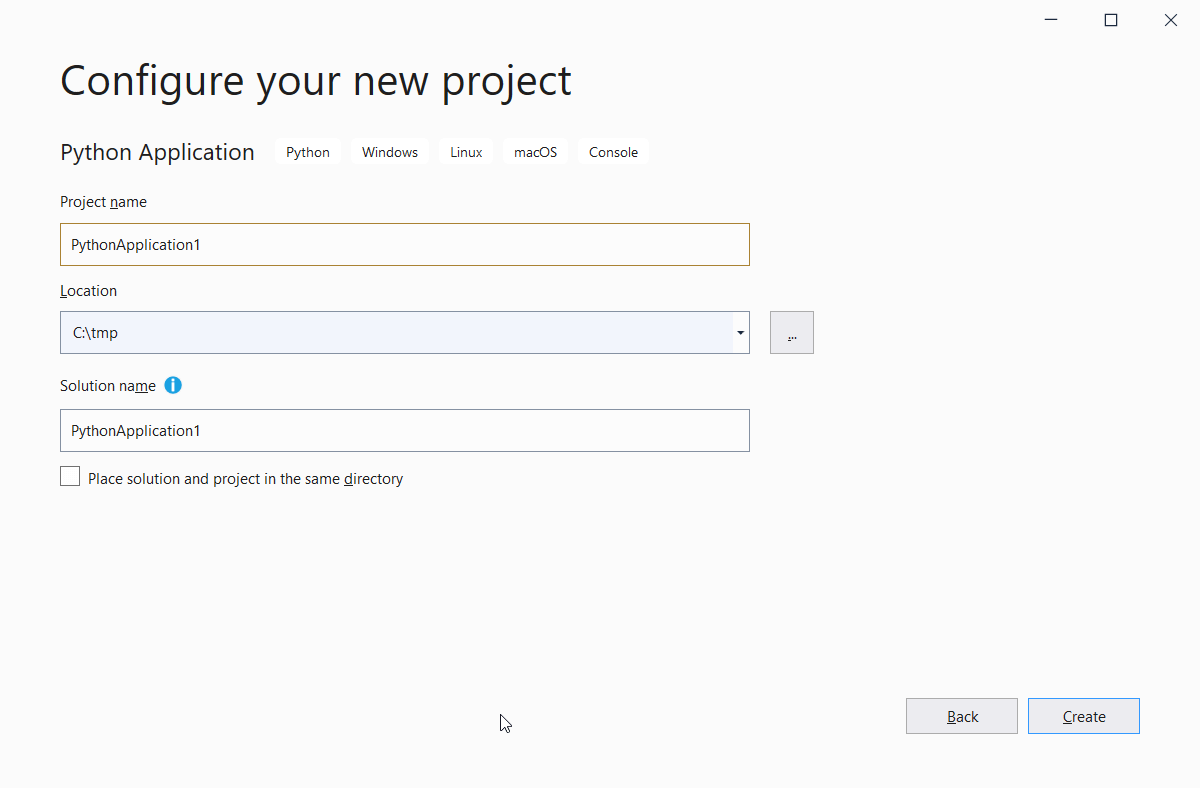
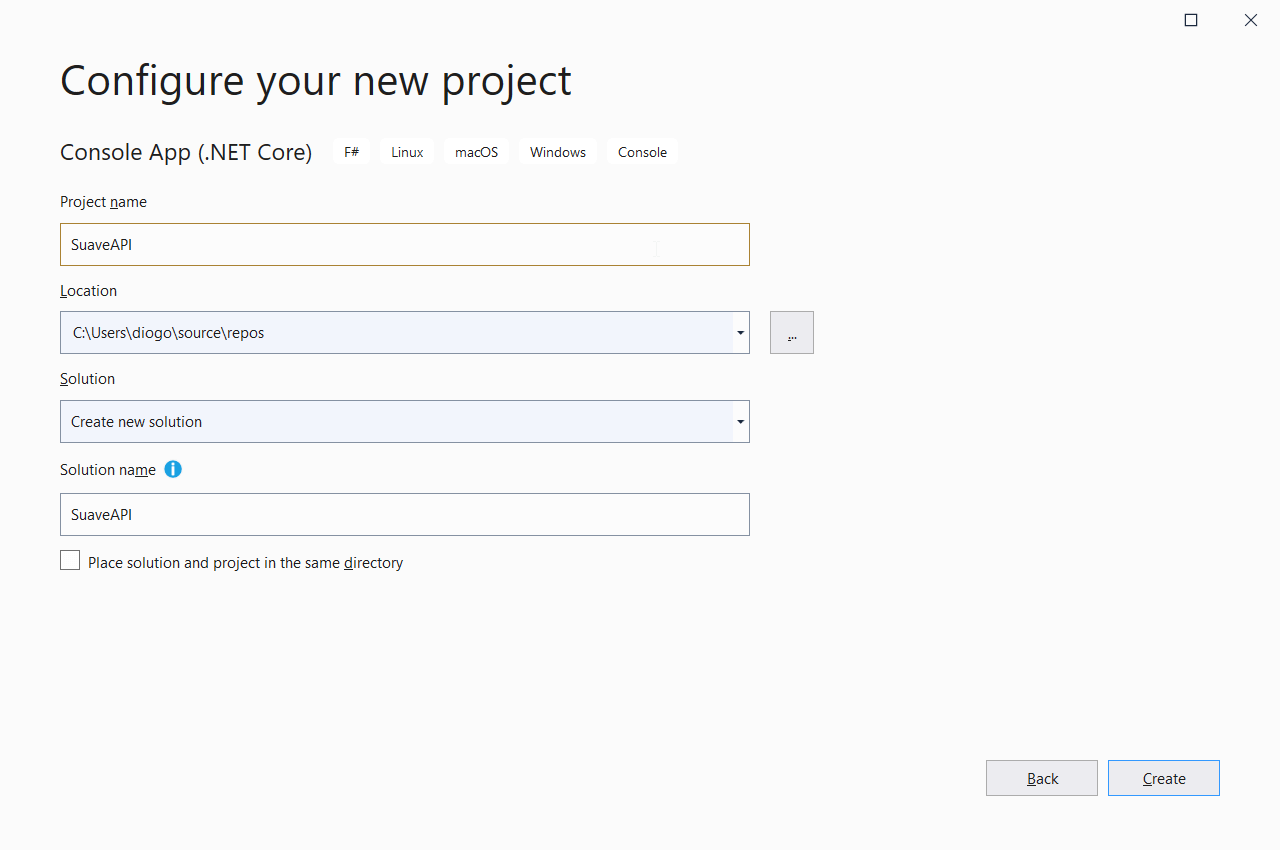
Hit Next, select a location, name your solution, and, finally, click the OK button. Use Figure 3 as a reference.
Figure 3. Configuring the project
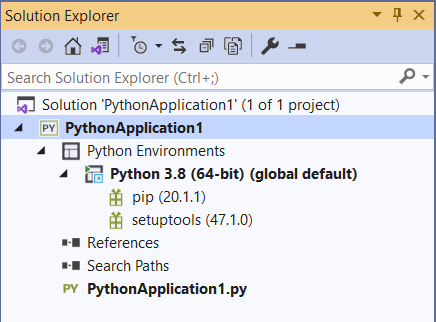
When the process finishes, you’ll be able to see the newly created project along with its config files. It’s important to state that the structure of Python applications is slightly different from the ones you’re used to dealing with .NET. Take a look at Figure 4 below.
Figure 4. Project structure
There are a few highlights to take note of:
- Even though it is a Python project, Visual Studio preserves the solution structure common to all of its projects. That’s why you may see the VS solution at the top of the structure, as well as a .sln file if you navigate directly into your project folders.
- Every Python project is represented by a .pyproj file extension.
- Among the auto-generated project files, it comes together with a single .py file. That’s your starting point to create some Python code.
- The Python Environments node brings the list of dependencies available to each of the Python interpreters installed. When you open each node, you may see the full list. Any new dependency you add to the project appears here.
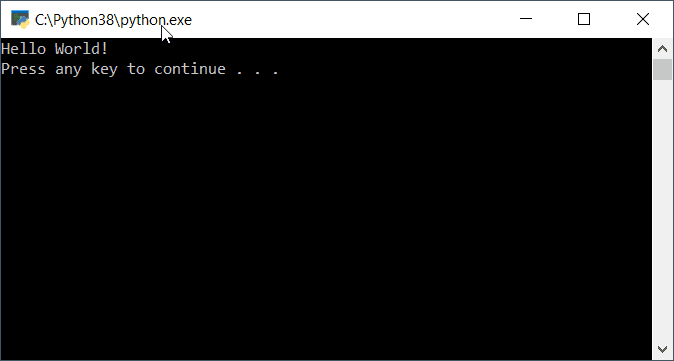
When you open the PythonApplication1.py file, you’ll see that it’s empty. Let’s run the classic Hello World example in Python to test it out.
Place the following code snippet within the Python file:
print("Hello World!")
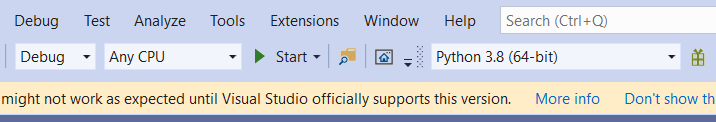
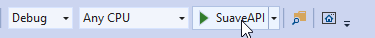
To run it, do as you would with any ordinary .NET application. Just hit the Start button available at the top bar, as shown in Figure 5.
Figure 5. Starting up the application
Note also that the Python version used to run the program is displayed within the following combo box. If you have other versions installed, you can pick the one you desire here.
When the program finishes loading, you may see a screen like shown in Figure 6.
Figure 6. Hello World example in action
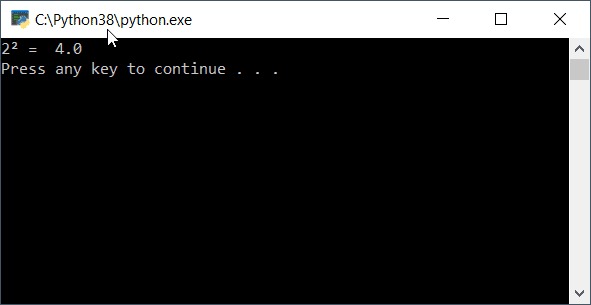
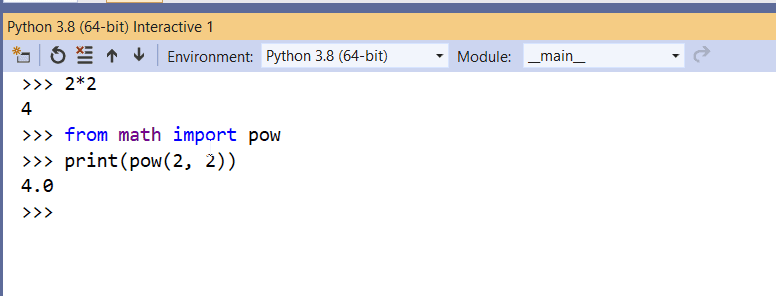
You can also import the same built-in libraries you’re used to doing when coding with Python elsewhere. Take the following example that calculates the power of two numbers:
import sys
from math import pow
print("2² = ", pow(2, 2))
First, import the sys module. Then, import the pow function contained within the math module. Figure 7 shows the result of this program execution.
Figure 7. Python execution result
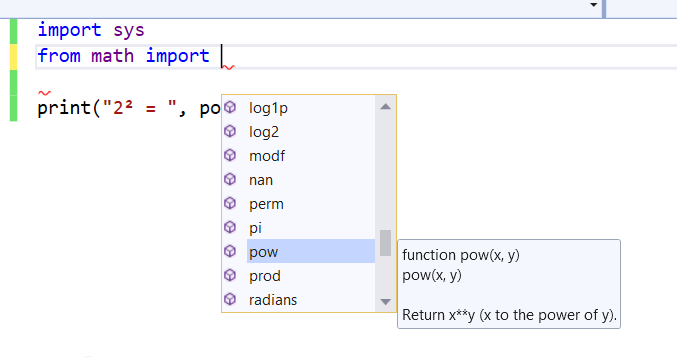
Visual Studio also understands the primary functions that compose the language and allow for code completion, which is something essential when coding with an IDE. Figure 8 illustrates how the auto-completion feature happens along with Visual Studio.
Figure 8. Code completion within Visual Studio for Python
The Interactive REPL
REPL stands for read–eval–print loop, which is a simple and interactive shell program to provide developers with an environment that takes inputs, executes them, and returns the results. Most programming languages support this feature.
As with many other languages that Visual Studio offers support, Python’s not different when it comes to interactive REPL.
To open it, go to the menu View > Other Windows > Python Interactive Windows (or press Alt + I) and now you have a direct window to test your Python code. Figure 9 demonstrates a quick example of use.
Figure 9. Python Interactive REPL in Visual Studio.
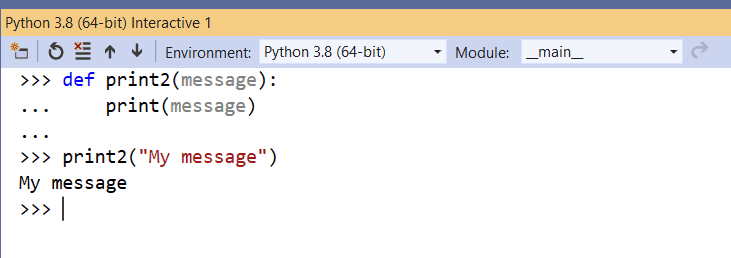
It also identifies multiline code statements, like when you’re defining a Python function and performs automatic indentation, as you can see in Figure 10. This way, you can test more complex code structures without a physical Python file.
Figure 10. Creating a custom function within REPL.
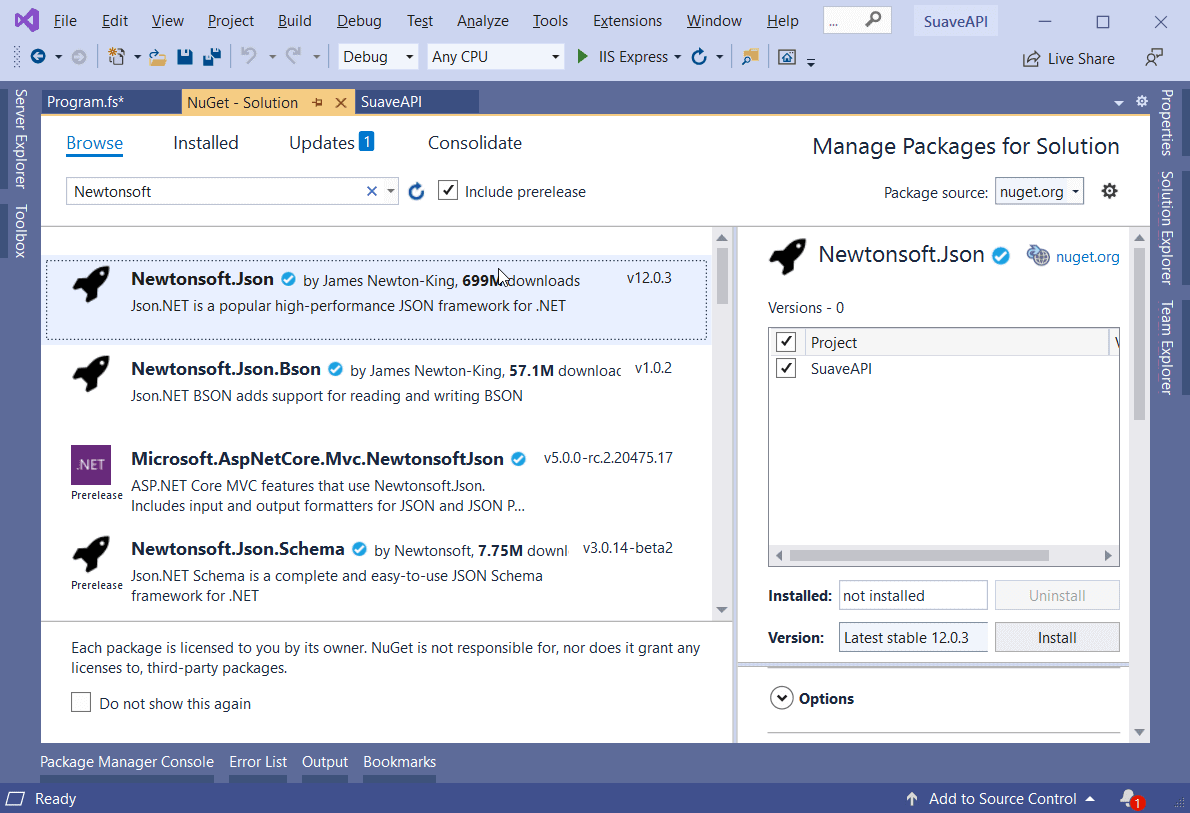
Importing third-party packages
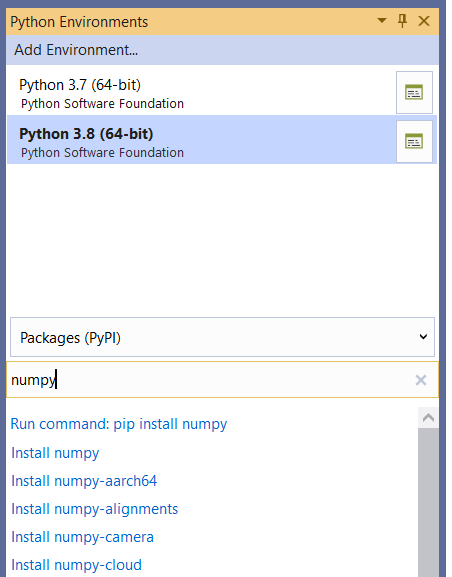
You can also import 3rd-party packages directly within Visual Studio. For example, say you’d like to incorporate a few more complex mathematical formulas to your application via the NumPy library, which is used for scientific computing with Python.
To do this, right-click the Python Environments node within your Solution Explorer window, and select the option View All Python Environments. Then, with your current Python version selected, make sure that Packages (PyPI) is selected. Type the name of the package you desire in the available field, as shown in Figure 11. Click Enter.
Figure 11. Installing the NumPy package.
A green loading bar will appear while the package is installing. When it’s finished, you can check on the results alongside the Output window. When the installation is complete, go back to your code file and place the contents shown in Listing 1 there.
Listing 1. Making use of NumPy package.
import sys
import numpy as np
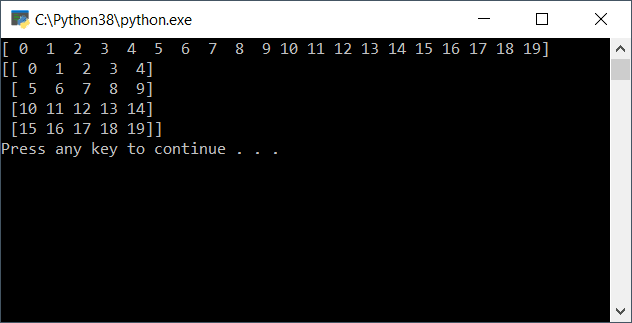
a = np.arange(20)
print(a)
a = a.reshape(4, 5)
print(a)
The arange function returns evenly spaced values within a given interval. Values are generated within the half-open interval [start, stop]. The reshape function, in turn, gives a new shape to the array without modifying its values. Figure 12 shows the output of this program execution.
Figure 12. Running a simple NumPy example.
This example demonstrates how powerful it is to deal with project dependencies within Visual Studio as it is with other IDEs.
Building a web application with Django
Now’s time to move on to a more robust application. Until now, you’ve explored how Python works in a Visual Studio Console application, the main features, shortcuts, dependency management, etc. It’s time to build something that resembles something useful in daily life — a web application made with Django.
Django is a high-level Python Web framework that encourages rapid development and clean, pragmatic design. One of the favorite choices for Python developers in terms of web applications. You may have noticed in the step where you created the Python project template, Visual Studio prompts a bunch of options related to Python frameworks, such as Django and Flask-based projects.
Now to get back to the initial steps and create another application by selecting the menu New > Project. When the window opens, make sure to have Python as the default language selected.
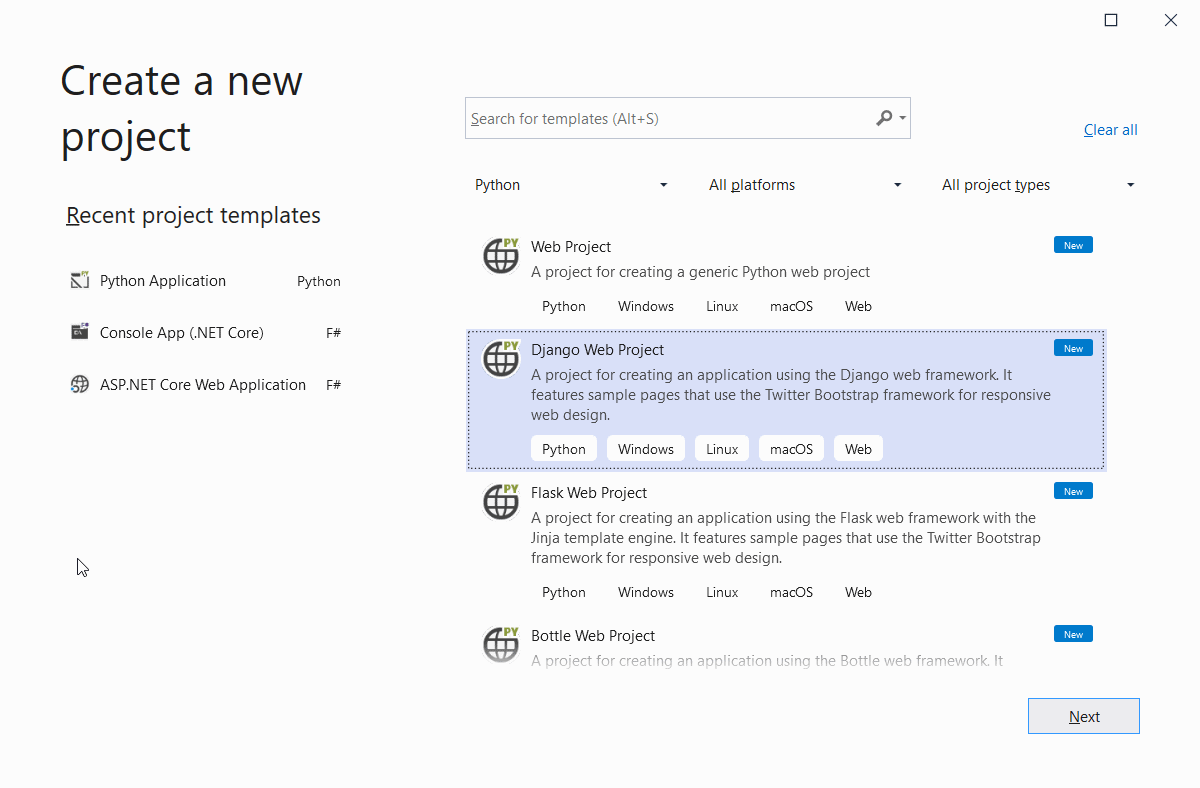
You’ve got an option to create an empty web project for generic Python web projects. However, stick with Django since it saves a lot of time in terms of configurations. Figure 13 illustrates this step.
Figure 13. Creating a new Django Web Project
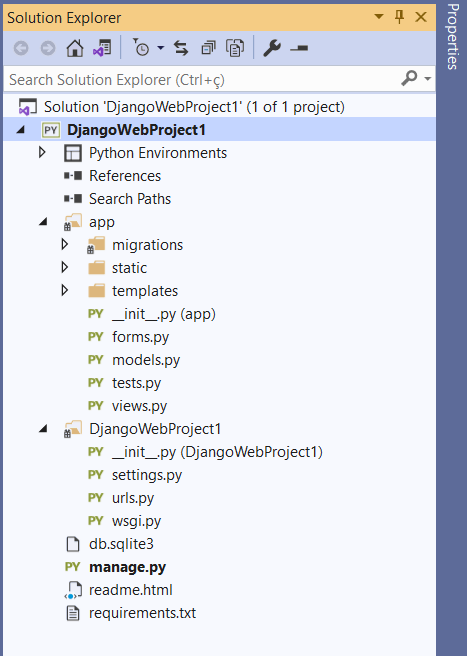
Click Next and, in the following screen, give the project and solution a name, select the project location, and hit the Create button. Once the project is created, make sure to take some time to analyze its initial structure (Figure 14).
Figure 14. Initial structure – Django web project
Projects in Django are composed of one or more inner Django applications, resembling a monolithic model. As you can see in the image above, each project is located right below the solution. You can have as many as you wish.
Setting Up a Virtual Env
Python works with virtual environments (venvs), which are self-contained directory trees with a Python installation for a specific version of the language. This structure helps to separate the global installed Python environment from the ones you’re using alongside your projects. They work as virtual workspaces.
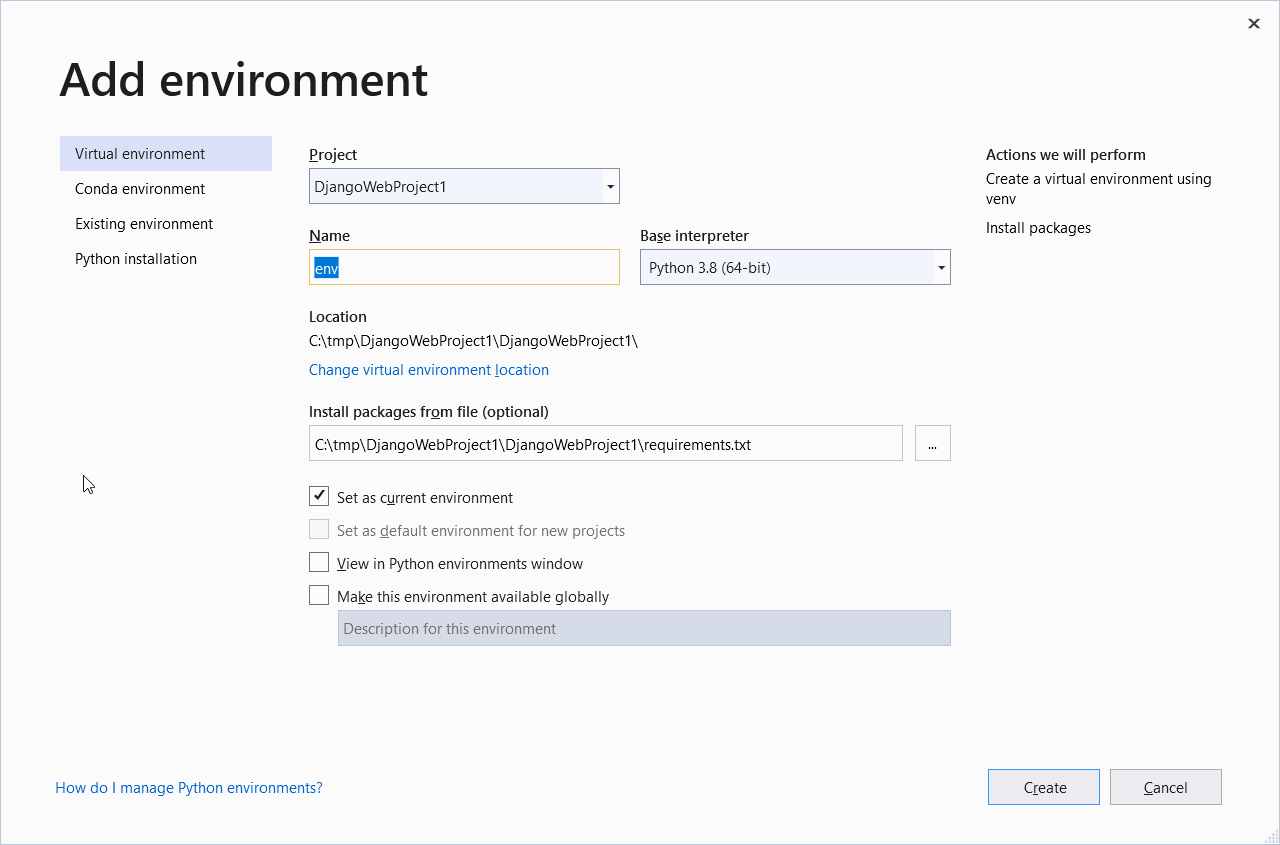
To add a venv to your Python Environments node, right-click the Python Environments node and select the option Add Environment… The window shown in Figure 15 will pop with a bunch of information, such as the name you want for the new environment, the Python version to use (3.8), and the location of the config files.
Figure 15. Adding a new virtual environment to Visual Studio
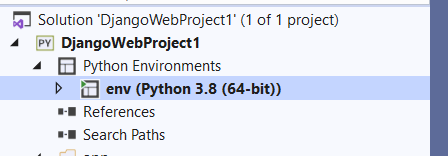
You can leave all the configs as they are and click the Create button. Just make sure to leave the Set as current environment checkbox checked. At the end of the process, your node will change to the following:
Figure 16. New Python environment set.
Great! You’re no longer using the default global environment. This way, all the Python packages and changes you perform will be restricted to this env, so your app becomes fully isolated and does not impact the others.
The Django Project
You can break down everything in the DjangoWebProject1 folder, the project structure, like this:
- __init__.py: Python needs a way to differentiate ordinary folders from Python-folders. The way it does this is via this file. When Python finds this empty file in a directory, it immediately understands it’s Python-based.
- wsgi.py: It’s used for WSGI (web server gateway interface) purposes. This example won’t use it.
- settings.py: As the name suggests, this file takes care of all the settings for a Django project, such as authentication, session management, etc. You can find the full list of supported settings here.
- urls.py: Here’s where you must map the routes for your Django endpoints, usually for your app’s pages.
- manage.py: It’s a root configuration file that deals with settings such as env variables, general exception handling, etc.
The Django App
The Django application, which is located under the app folder, comes in a separate Python-based package because Django projects can have one or more Django apps. It will make use of the urls.py file you’ve just seen to route from the outer scope to the inner app’s scopes.
Among its main auto-generated folders and files, you can find:
- a /migrations folder that takes care of the database scripts to automatically handle migrations back and forth.
- a /templates folder to deal with the Django templates. Django templates are pieces of HTML that can receive dynamic variables to turn static pages into dynamic. See that a bunch of ready-to-use templates already come with it.
- a forms.py file to help you on building web forms in Python and set up things like authentication and validation rules.
- a models.py file to hold the Django models, which are encapsulations of data objects to hold your business model information.
- a tests.py file to deal with unit testing.
- and a views.py file to create and manage your web pages, handle the requests, call the services and databases, and return the responses. They work as controllers.
Running the Project
Now you’re ready to run the project and see how it works in action. Just click the Web Server (Google Chrome) button available at the top of the IDE. This will open a Chrome window and display the page shown in Figure 17.
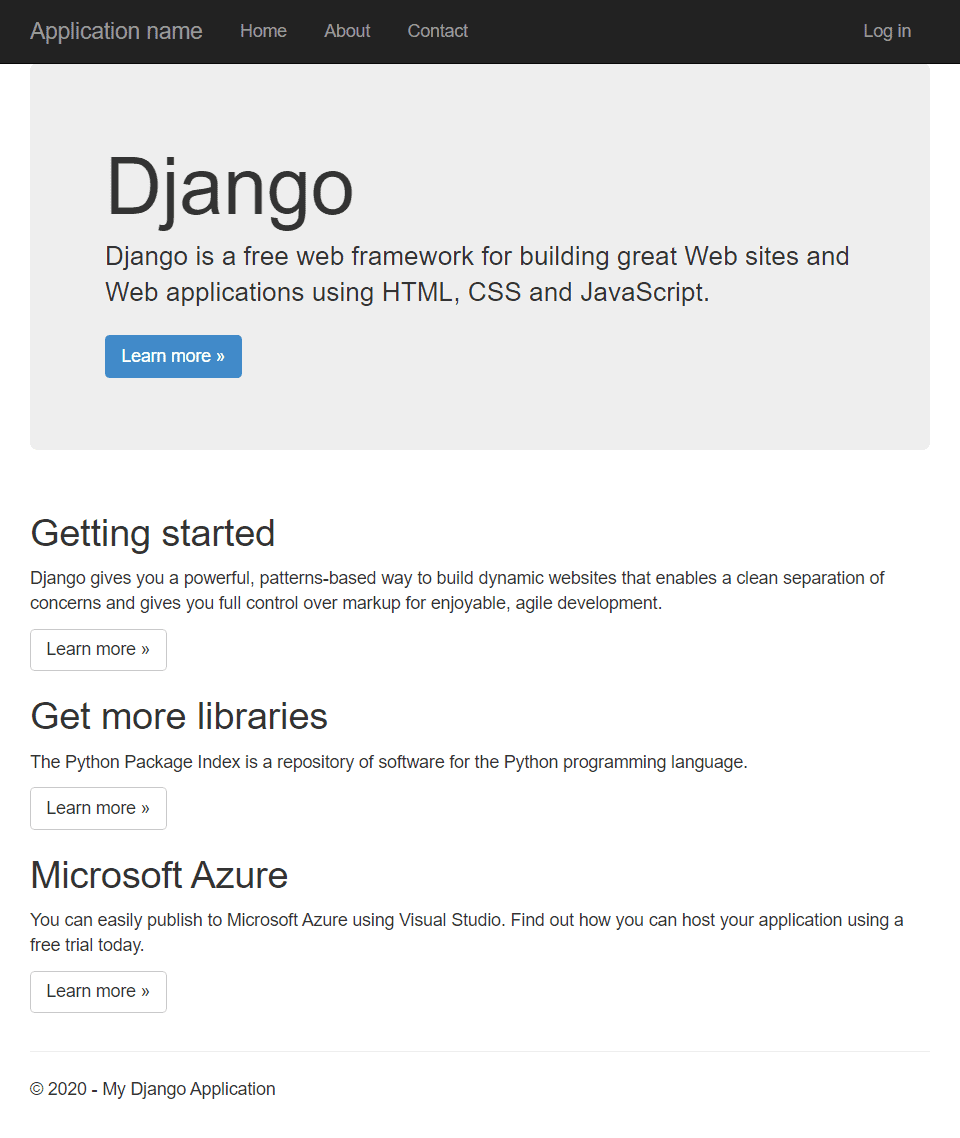
Figure 17. Generated Django application.
To try out a change, go to the views.py file and substitute the home function with the following:
Listing 2. Adding a random-generated number to the response.
def home(request):
    """Renders the home page."""
    assert isinstance(request, HttpRequest)
    return render(
        request,
        'app/index.html',
        {
            'title':'SimpleTalk - Django with Visual Studio',
            'randomNumber': randint(0, 100),
            'year':datetime.now().year,
        }
    )
You’re changing the title value and adding a randomly generated integer value to a variable called randomNumber. This value will go directly into your HTML page template, the index.html. Don’t forget to import the randint function at the beginning of the file:
from random import randint
Then, open the index.html template file and change the jumbotron div content for the following:
<div class="jumbotron">
<h1></h1>
<p class="lead">Random number of the day: </p>
<p><a href="https://www.djangoproject.com/" class="btn btn-primary btn-large">Learn more »</a></p>
</div>
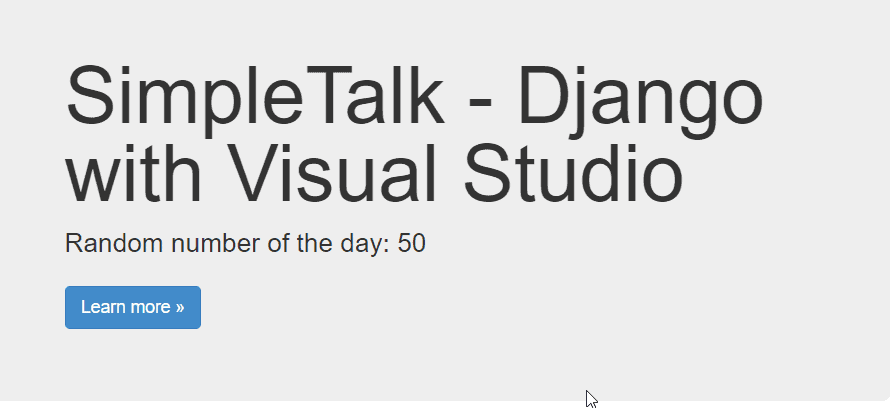
See, easy… isn’t it? Now, check out the result in Figure 18.
Figure 18. Changing some values to the index template
Conclusion
There’s a whole lot more to see regarding Python development within Visual Studio. This was just a brief introduction to the main concepts and steps you’d have to take to get things started.
I can’t stress enough the need of going through the Python and Django official documentation, to guide you every time you feel lost. Or even to start with the language + framework.
What about you? How was your experience using Python along with Visual Studio? Leave your thoughts in the comments section and let’s discuss it. Good studies!
The post Developing Python with Visual Studio appeared first on Simple Talk.
from Simple Talk https://ift.tt/34j7Hte
via