Tuesday, December 22, 2020

Security is hard work

I was once a database administrator in charge of several SQL Servers hosting the databases of vendor apps. Right after taking the job, I began looking at things like backups and security. I was quite shocked to find that one of the most important SQL Servers in the firm had a blank sa password. I also found that the application was configured to use the sa account to connect to the database! It turned out that the software vendor had recommended this setup in their documentation, and the person originally setting it up at the firm had just followed this recommendation without question. After contacting the vendor, they confessed that they didn’t know what permissions their software needed, and this configuration cut down on support calls. Eventually, the company did change their recommendation.

The more secure a system is, the harder it is for legitimate users to access it. No one disputes that, but it’s critical to follow best practices like separation of duties and proper use of service accounts. Even if a company does everything right, nothing is guaranteed to be 100% secure.

One way that SQL Monitor reduces risk is by using the Base Monitor to collect and process the data. Nothing gets installed on the monitored servers which minimizes the exposed surface area. Of course, you must also provide an account with access to the instance for collecting data, but the documentation spells out exactly what permissions are needed so you can avoid using a privileged account. It’s also a good idea to use a separate, dedicated account for monitoring each server as well.

Security is hard work, and software vendors must do everything they can to ensure their software is secure.


The post Security is hard work appeared first on Simple Talk.


from Simple Talk https://ift.tt/3ayNXWk
via

Postponed goals, plans, and resolutions

Every year, folks make resolutions and set goals for the new year. It would be interesting to have some real numbers comparing success in 2020 to a typical year, but I bet that many of us have failed or at least had to postpone plans and goals. 

I had no idea that my trip to the UK in February would be the last time I left my area or that I would be helping my five-year-old grandson Nate with remote kindergarten every day while I try to work. I purchased tickets to attend several concerts, including one in Colorado at Red Rocks Amphitheatre, and all of them were cancelled. I also signed up to do two stair climb events and had been training with my 14-year-old grandson Thomas who was to participate in the events with me. Those events were cancelled as well. While SQL Saturdays are technically for work, they have also been enjoyable ways to catch up with friends from the community. I never could have imagined that my local SQL Saturday in February would be the last in-person event for me in 2020.

Travel for holidays and work was cancelled. Playing cards and board games replaced amusement park and museum outings. Binge watching Netflix replaced trips to the gym. Remote replaced in-person visits with friends and extended family. Weekends of baking bread and cookies replaced holiday jaunts. 

This year has taught  us that we don’t require all the things that we thought we needed.  Now it’s time to think about 2021. With the rollout of the vaccines, there’s hope that the world will get back to normal, but it’s unlikely to ever be the same.

Commentary Competition

Enjoyed the topic? Have a relevant anecdote? Disagree with the author? Leave your two cents on this post in the comments below, and our favourite response will win a $50 Amazon gift card. The competition closes two weeks from the date of publication, and the winner will be announced in the next Simple Talk newsletter.

The post Postponed goals, plans, and resolutions appeared first on Simple Talk.


from Simple Talk https://ift.tt/2WzGRIO
via

Thursday, December 17, 2020

Performing seed data to database from JSON using reflection

We can work with two approaches in Asp.Net MVC i.e., DB first approach and Code first approach. Apart from that, we can also work with different ORM models such as Entity framework, NHibernate, etc.

In the code first approach, database create with the migration is simple and easy task to add, update, and delete the data. It helps seed database simply, just add the properties and call the Savechanges method.

We can initialize the code first generated database with the values from JSON using data access layer and reflection. By the way, JSON is considered as the best data format as it gives clean and clear data result. We can apply other formats to the same approach but JSON is used for the ease and the availability of the large and optimal JSON.NET library from Newtonsoft.

What is Reflection in core?

Reflection allows us to get information about the assemblies and type defined within them such as classes, interface, structure, and enumerations.

Using reflection, we can dynamically instantiates the objects, access the fields, methods, properties. Reflection can lower down the performance. If we accessed the fewer objects with reflection then we will not notice the execution speed. Let’s take a simple example to understand it.

private static void NormalGet()
{
      var instance = new Customer();
      for (int i = 0; i < 10000; i++)
      {
           var value = instance.Name;
      }
}
private static void ReflectionGet()
{
var instance = new Customer();
var type = instance.GetType();
for (int i = 0; i < 10000; i++)
{
            var value = type.GetProperty("Name").GetValue(instance);
       }
}

The execution time for the first one method is faster than the reflection get method. So the best way is to not use the reflection with our project as it will significantly reduce the performance.

Seeding with JSON data

Step 1: Add JSON file

Now we will add the JSON file with the name Customer.json as follows. Here we have the simple data with three to four property (Name, order, item).

{
  "Customer": [
    {
      "Name": "Raj",
      "Order": 1,
      "Item": [
        {
          "ItemName": "Book"
        },
        {
          "ItemName": "Machine"
        }
      ]
    },
   {
      "Name": "Lokesh",
      "Order": 2,
      "Item": [
        {
          "ItemName": "Phone"
        },
        {
          "ItemName": "Laptop"
        }
      ]
    },
    {
      "Name": "Jay",
      "Order": 2,
      "Item": [
        {
          "ItemName": "Pen"
        },
        {
          "ItemName": "Book"
        }
      ]
}
]
}

Now we will use this code to seed the database. We are calling it from the start up file in configure method in asp.net core.

Step 2: Update Startup file

Now we will update the configure method in the startup file. In which we will read the file with System.IO.File.ReadAllText. After that we will add the json text in seed method as follows. In the read all text we have passed our JSON file.

public void Configure (IApplicationBuilder app, IHostingEnvironment env)
{
    if (env.IsDevelopment())
    {
         app.UseDeveloperExceptionPage();
    }
    else
    {
         app.UseExceptionHandler("/Home/Error");
         app.UseHsts();
    }
    app.UseHttpsRedirection();
    app.UseStaticFiles();
    app.UseCookiePolicy();
    app.UseMvc(routes =>
   {
        routes.MapRoute(
            name: "default",
            template: "{controller=Home}/{action=Index}/{id?}");
        });
        var jsontext = System.IO.File.ReadAllText(@"Customer.json");
        Seeding.Seed(jsontext, app.ApplicationServices);
}

Step 3: create the Seeding class

In this class, we will define the Seed method in it which is used for the deserialize the JSON file into the list of Customer object. After that we have used here the asp.net core service provider to get services from the startup file. In the deserialize object we have pass the json data and json serialize setting object into the list of customer.

using JsonNet.PrivateSettersContractResolvers;
using Microsoft.Extensions.DependencyInjection;
using Newtonsoft.Json;
using System;
using System.Collections.Generic;
using System.Linq;
using System.Threading.Tasks; 
namespace WebApplication18.Models
{
    public class Seeding
    {
        public static void Seed(string jsonData,
                            IServiceProvider serviceProvider)
        {
            JsonSerializerSettings settings = new JsonSerializerSettings
            {
                ContractResolver = new PrivateSetterContractResolver()
            };
            List<Customer> customer =
             JsonConvert.DeserializeObject<List<Customer>>(
               jsonData, settings);
            using (
             var serviceScope = serviceProvider
               .GetRequiredService<IServiceScopeFactory>().CreateScope())
            {
                var context = serviceScope
                              .ServiceProvider.GetService<Context>();
                if (!context.customers.Any())
                {
                    context.AddRange(customer);
                    context.SaveChanges();
                }
            }
        }
    }
}

After that call the addrange method into the customer and performed the savechanges method.

Let’s take another example by seeding the database using has data.

Seeding using has data

Step 1: Create model

Here we take the two model named Item and Customer as shown below. In which Customer id is the foreign key in the Item table.

public class Item
    {
        public int ItemId { get; set; }
        public string ItemName { get; set; }
        public int CId { get; set; }
        public Customer customer { get; set; }
    }
public class Customer
    {
        public int CId { get; set; }
        public string Name { get; set; }
        public int Order { get; set; }
        public List<Item> items { get; set; } => new List<Item>();
    }

Step 2: Update context file

Here we have to override the onmodelcreating method and fill the data in it. We can use it for adds multiple rows at a time. Migration can automatically compute the operation while updating the database of the model.

public class Context : DbContext
    {
        public Context(DbContextOptions options) : base(options)
        {
        }
        public DbSet<Customer> customers { get; set; }
        public DbSet<Item> items { get; set; }
        protected override void OnModelCreating(ModelBuilder builder)
        {
            builder.Entity<Customer>().HasData(
                new Customer { CId = 1, Name = "Raj", Order = 1 }
            );
            builder.Entity<Item>().HasData(
                new Item { CId = 1, ItemId = 1, ItemName = "Phone" },
                new Item { CId = 1, ItemId = 2, ItemName = "Second post" }
            );
        }
    }

Step 3: Create the controller

Create the controller to get the data from the two models.

[Route("api/[controller]")]
    [ApiController]
    public class HomeController : Controller
    {
         private readonly Context _db;
         public HomeController(Context db) => _db = db;
         // GET api/values
         [HttpGet]
         public ActionResult<IEnumerable<Customer>> Get()
         {
             return _db.customers
                 .Include(b => b.items)
                 .ToList();
         }
         // GET api/values/5
         [HttpGet("{id}")]
         public ActionResult<Customer> Get(int id)
         {
             return _db.customers
                 .Include(b => b.items)
                 .SingleOrDefault(b => b.CId == id);
         }
}

If you have large data file like JSON then you can go through as below. Just add a new method and call the json file from where it is placed and read that file using reader.

protected override void OnModelCreating(ModelBuilder builder)
        {
            builder.Entity<Customer>().HasData(
                new Customer { CId = 1, Name = "Raj", Order = 1 }
            );
            builder.Entity<Item>().HasData(itemvalue());
              
        }
        public List<Item> itemvalue()
        {
            var itemvalue = new List<Item>();
            using (StreamReader r = new StreamReader(@"json file path"))
            {
                string json = r.ReadToEnd();
                itemvalue = JsonConvert.DeserializeObject<List<Item>>(json);
            }
            return itemvalue;
        }

Conclusion:

In this blog, we have seen the programming concepts of how to seed the database using json and has data. Seeding using json is as simpler as you seen. First of all, we have to see the reflection but it consumes the execution time. So we have done with JSON file normally just write the file and call it in the startup file. Seeding using the JSON file, will turn our code lighter and simpler.


The post Performing seed data to database from JSON using reflection appeared first on Simple Talk.


from Simple Talk https://ift.tt/3nt4izx
via

SQL Server Error Log

Most applications have a log of some sort that tracks activity. SQL Server is no different. It has a log file known as the error log for tracking what’s happening on an instance of SQL Server. Server. Each instance of SQL Server has its own set of error log files. In this article, I will discuss what the error log is, how SQL Server manages it, where you can find it and how to use and manage it.

What is the error log?

The error log is a file that tracks what kind of activity is happening on an instance. The log is just a journal of events that have occurred on a SQL Server instance, in chronological order. The log doesn’t track everything, but it does track significant events and errors that occur while SQL Server is running. These errors could be informational only, warnings, as well as actual instance and application errors. You can find things like start up and shut down information, backup and restore commands, as well as custom application messages in the error log file. A DBA can also configure SQL Server to write additional logging, for example, logins and logouts. The error log is a great place to look for problems or potential problems associated with an instance of SQL Server.

The error log is not a single file but a series of files. Each time SQL Server starts up, a new error log file is created. A running instance of SQL Server writes to current log (the one created at startup) and by default has six archived error log files. If you need to keep more than six archived files, you can override the default to keep as many as you need (more on this later).

If an instance of SQL Server crashes or will not start for some reason, the error log is the place to go for troubleshooting these problems. As a DBA, you should periodically review the error log to look for potential problems. By reviewing the log, you might find some unusual things going on that might otherwise go unnoticed, like a backup job has failed or someone trying to hack the SA password.

Where can the error log files be found?

By default, the error log files are stored in the following location: Program Files\Microsoft SQL Server\MSSQL<n>.<instance name>\MSSQL\LOG\ERRORLOG, where <n> is an archived version number, and <instance name> is the name of the instance. This is only the default location. Some instances might be set up to write their error log files to a different location. If the error log files are not in the default location, then there are a number of different ways to find them. I will show you two of those methods.

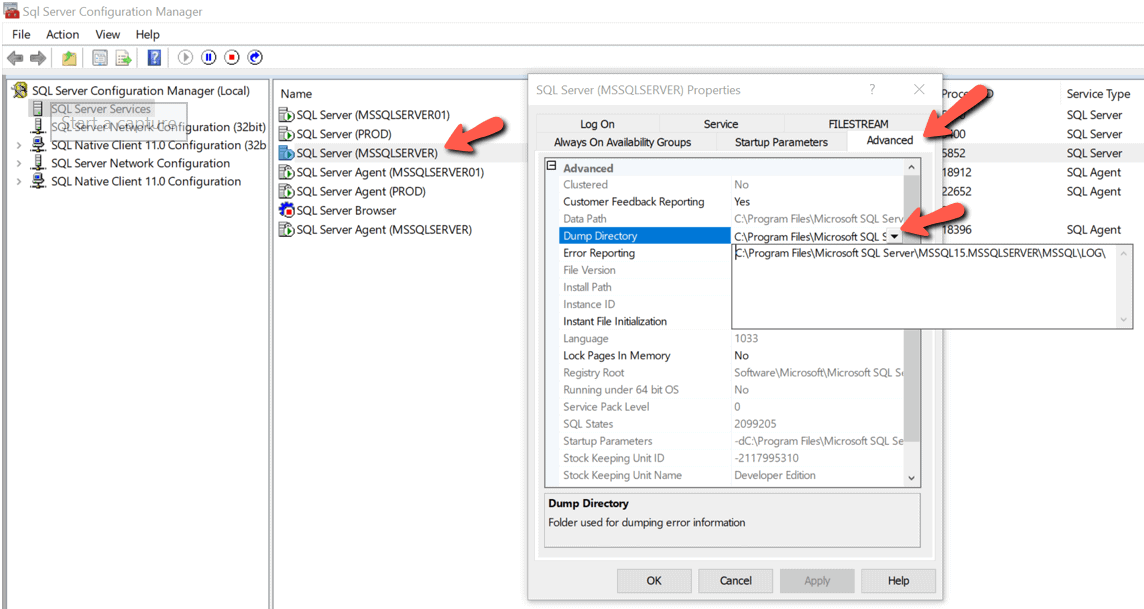
The first method is to use SQL Server Configuration Manager. To find the location of the log using this method, first, open up SQL Server Configuration Manager. Next double click on the instance of SQL Server that you want to locate the error log file location. Then click on the Advanced tab. The location of the error log file directory is identified in the Dump Directory item. To see the full name of the error log file directory, click on the little down error to the right of the Dump Directory item, as shown below in Figure 1.

Figure 1: Location of error log file directory in Configuration Manager

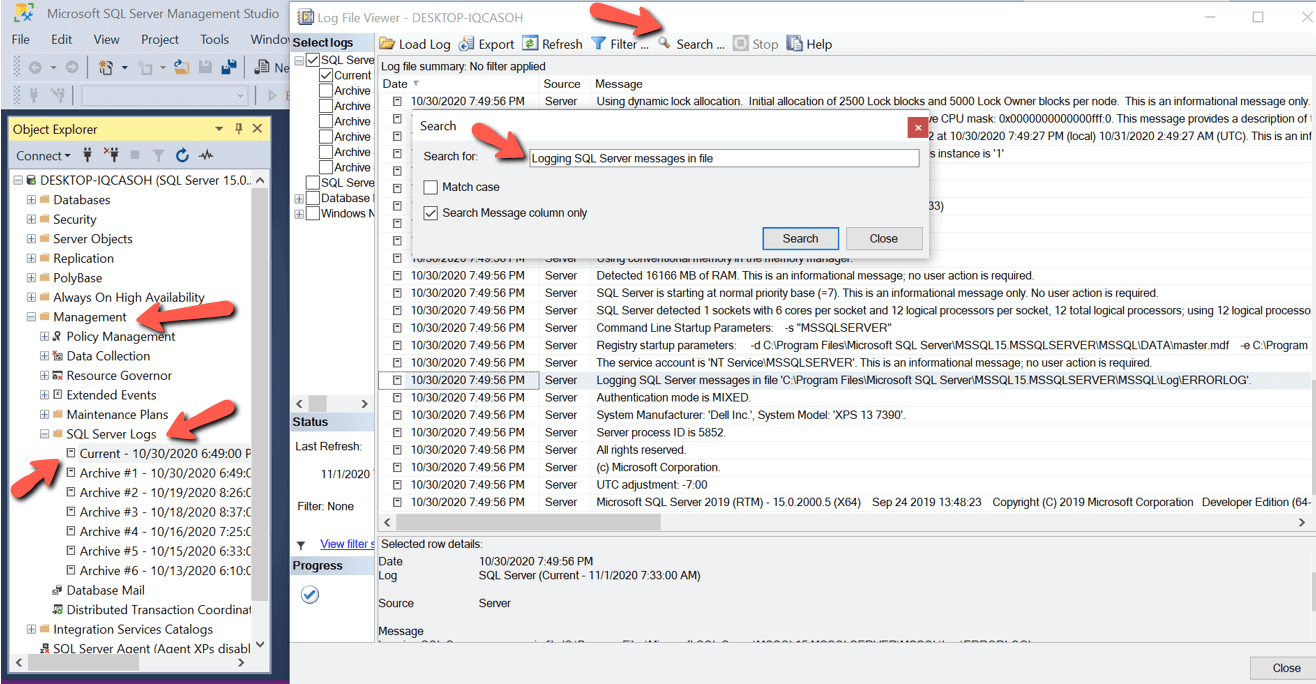
A second method to find the location of the error log files is to use SSMS to browse one of the error log files. To do this, you must connect to the instance of SQL Server in which you want to find the error log location with SSMS. Expand the Management item and the SQL Server Logs item. Then double-click on the Current error log file. When you do this, the Log File Viewer will be displayed. To find the error log file location you can either browse thru the log file until you find it or use the Search… option to find it. When using the search option, use the string Logging SQL Server messages in file as the search criteria. The image in Figure 2 shows these steps. The log location can be found in the line that is highlighted in the log.

Figure 2: Using SSMS to find the location of error log files


Types of error log files and their naming conventions

Each SQL Server instance has two different types of error log files. There is an error log file for the currently running instance and then a number of archived error log files.

All error log files names start with ERRORLOG. The error log for the running instance is called just ERRORLOG, whereas all other error log files names start with ERRORLOG but have a number for the file extension. The archived error log files are ERRORLOG.1, ERRORLOG.2, ERROLOG.3, … up to the number to the configured number of archived error log files. Where ERRORLOG.1 is most recently archived error log file, ERRORLOG.2 is the second most recently archived error log file, ERRORLOG.3 is the third most recently archived error log file, etc. If an instance is configured with the default number of error log files, then the last archived error log file is named ERRORLOG.6.

When an instance is restarted, the oldest archived error log file (ERRORLOG.6 if the default number is used) is deleted, then each of the remaining error log files is renamed. ERRORLOG.5 is renamed to ERRORLOG.6, ERROLOG.4 is renamed to ERRORLOG.5, etc. until ERRORLOG.1 is renamed to ERRORLOG.2. The last current error log file (ERRORLOG) is renamed to ERRORLOG.1, and the error log file for the newly started instance is created with the name ERRORLOG.

Changing the number and size of the error log

By default, an instance of SQL Server retains six archived error log files, and the size of each log file is unlimited. An unlimited size means it will grow as big as it needs to be, or until it runs out of disk space. You may find that these default setting are fine, but they can also be overridden.

How many archived error log files do you need and what is an appropriate maximum size? Like most SQL Server questions, the answer is “it depends.” Here, I will demonstrate how the number and size of the error logs might help or hinder your use of the error log files and share my personal opinion of how many log files I like to have.

First, let me explore the number of archived log files. I like to retain at least two months’ worth of error log files. By having multiple months of error log information, I can track trends from one month to the next. Keep in mind that depending on what is logged and the activity of an instance, two months’ worth of error log files might take up a lot of disk space.

There is no easy way to keep exactly two months’ worth of error log files since a new error log is created and the oldest archived one is deleted every time an instance is restarted. The number of months of error log files depends on how often SQL Server is restarted and the number of archived error log files that are kept. Suppose an instance is recycled frequently over a short period of time due to some maintenance activity. Error log information will be cycled off based on the configured value for the number of archived error log files that should be retained.

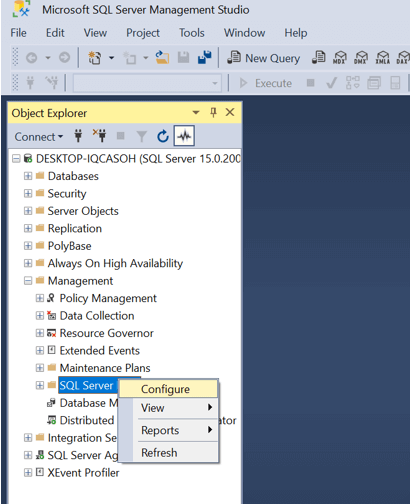
There a few different methods to change the error log file configuration, I’ll mention two of them. The first method is to use SSMS. To use this method, first connect to the instance, expand the Management folder, right click on the SQL Server Log folder and then select the Configure item from the menu displayed, as shown in Figure 3.

Figure 3: Bringing up the error log configuration screen

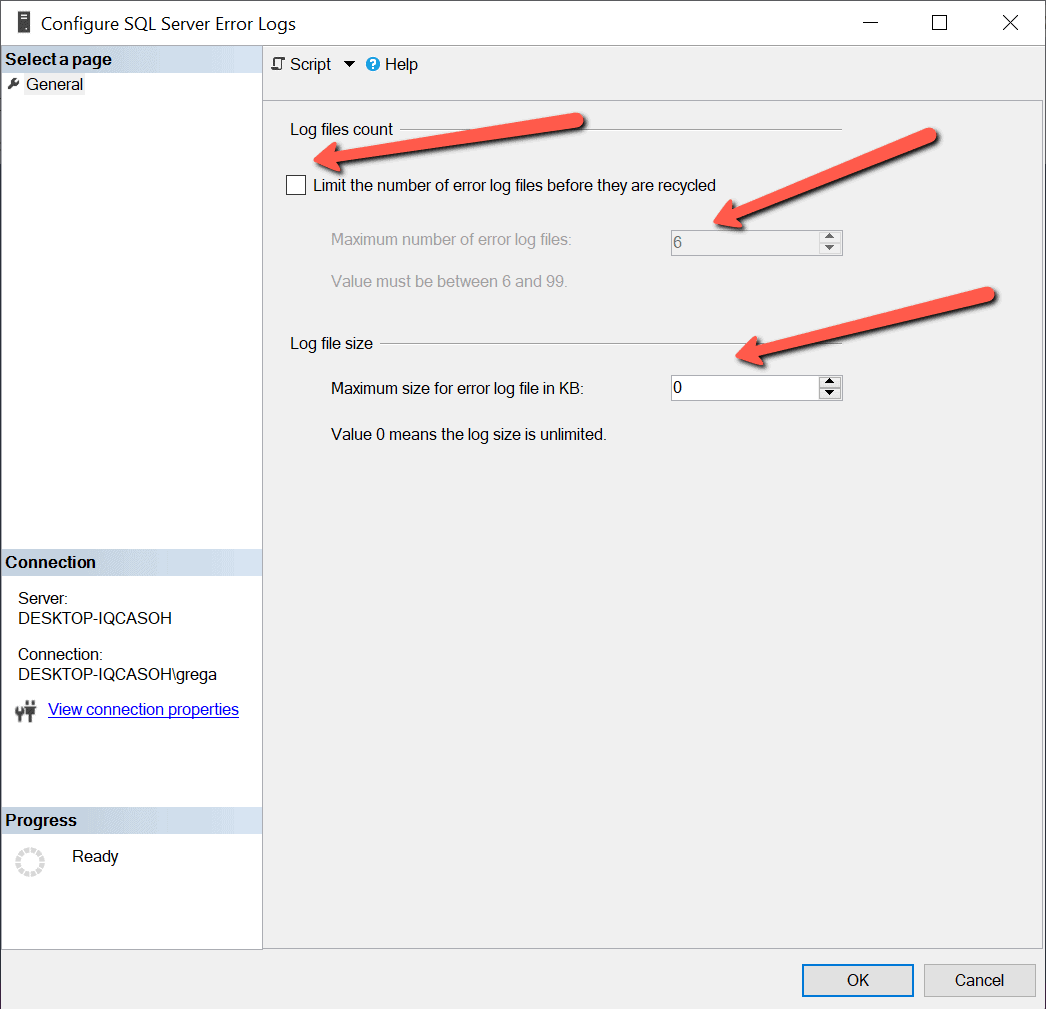
When clicking on Configure, the window shown in Figure 4 is displayed.

Figure 4; Configuration Options for the Error Log

By reviewing Figure 4, you can see that my instance is currently configured to retain 6 archived error log files and the maximum size of the error log file is set to be 0, which means unlimited.

To change the number of archived error log files to retrain, first click on the checkbox labeled Limit the number of error log files before they are recycled. Doing this will enable the Maximum number of error log files option, so the number of error logs to retain can be changed. Note the number of error log files to retrain needs to be between 6 and 99.

To set a maximum limit of each error log file, enter the desired size into the Maximum size of the error log file in KB. When the error log configuration is set to limit the size of the error log file, a new error log file will be created automatically after the current log file reaches the maximum size. I personally don’t like to limit the size of the log file, but keep in mind, having an unlimited size setting means each log file will be different sizes, whereas limiting the size would make every error log file the same size.

Issues with multiple restarts

When SQL Server is restarted, the oldest archived error log file is deleted, and a new one is created. This cycling of the error log every time SQL Server restarts normally isn’t a problem, unless it deletes an archived error log file automatically that contains information that is needed for troubleshooting or trend reporting.

Since the log file contains messages and errors related to an instance, it is crucial not to lose this information until you no longer need it. The problem with having the default number of archived error log files is you might lose valuable troubleshooting information if an instance is restarted more than six times over a short period of time. This can happen for a number of different reasons. I have seen nighttime operations staff and DBAs restart an instance multiple times in an attempt to get an instance that has crashed back up and running. Suppose an instance of SQL Server is restarted multiple times without review of the error log files. The restarts might inadvertently cycle off the one critical error log file containing the error messages related to the crash. For this reason, it is important to configure SQL Server to retain enough archived error log files so they are not automatically deleted until they are no longer needed.

Keep in mind that cycling off a critical error log file is a rare situation. However, if an error log file that has valuable information about a crash is cycled off, it does hamper your troubleshooting options. Therefore, it is wise to have someone review the error log, or at least copy the error log file to a backup location after a crash to make sure you have all the log files to help with troubleshooting. At least by copying off the error log file after a crash, you can guarantee it will not be cycled off if lots of restarts are performed.

Cycling the ERRORLOG

A new error log is created every time SQL Server is restarted. Sometimes SQL Server stays up for weeks or even months before an instance is restarted. When an instance has been running for a long time, the error log will be quite large. It’s hard to review and find errors in large log files, especially when they contain error messages that could cover long periods of time.

To help keep the error log files from spanning months’ worth of messages without recycling, you can cycle the error log with a command. Cycling the error log will close the current log and create a new one. The code in Listing 1 uses the system stored procedure sp_cycle_errorlog to cycle the error log file.

EXEC sp_cycle_errorlog
GO

Listing 1: Cycling the errorlog.

To execute the sp_cycle_errorlog system stored procedure, you need to be a member of the sysadmin fixed server role. Stored procedure sp_cycle_errorlog takes no parameters and returns a 0 if the error log is successfully recycled and a 1 if the cycling of the log has failed.

Error log file

The error log file contains messages and errors associated with a SQL Server instance. It is a valuable tool for troubleshooting problems with SQL Server as well as auditing what goes on within an instance of SQL Server. A DBA can configure SQL Server to store the error logs wherever they’d like and adjust the configuration to keep as many archived error log files as needed. As a DBA you should review this log every time SQL Server crashes and as part of your daily and weekly system checks. This review will ensure that SQL Server is functioning normally, with no unexpected errors showing up in the log.


The post SQL Server Error Log appeared first on Simple Talk.


from Simple Talk https://ift.tt/2IVGbud
via

Developing Python with Visual Studio

Python has become one of the most beloved programming languages of all time. It is flexible, easy to learn and code, open-source, and supported in all the major operating systems out there. For example, it offers a wide range of frameworks and libraries developed by the community to support and facilitate web applications. If you’re a .NET developer, chances are that you have played around with Python already, but, did you know that you can create Python projects in Visual Studio?

This article explores this feature via the creation of a Python web project. It’s important to note, however, that except for the ability to mix code from .NET and Python through projects such as IronPython, this won’t be the main focus here. Perhaps it will be for a future article.

Setting up

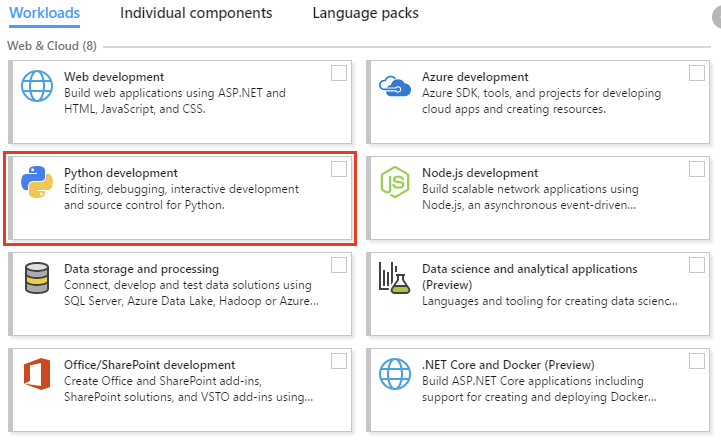
First, you need to make sure the Python workload is already installed for your Visual Studio IDE. Make sure to download and run the installer for the VS Community Edition. Once you open the installer, select the proper Python workload, as shown in Figure 1.

Figure 1. Installing the Python workload

Proceed with the installation. Then, move on to the project creation step.

Project setup

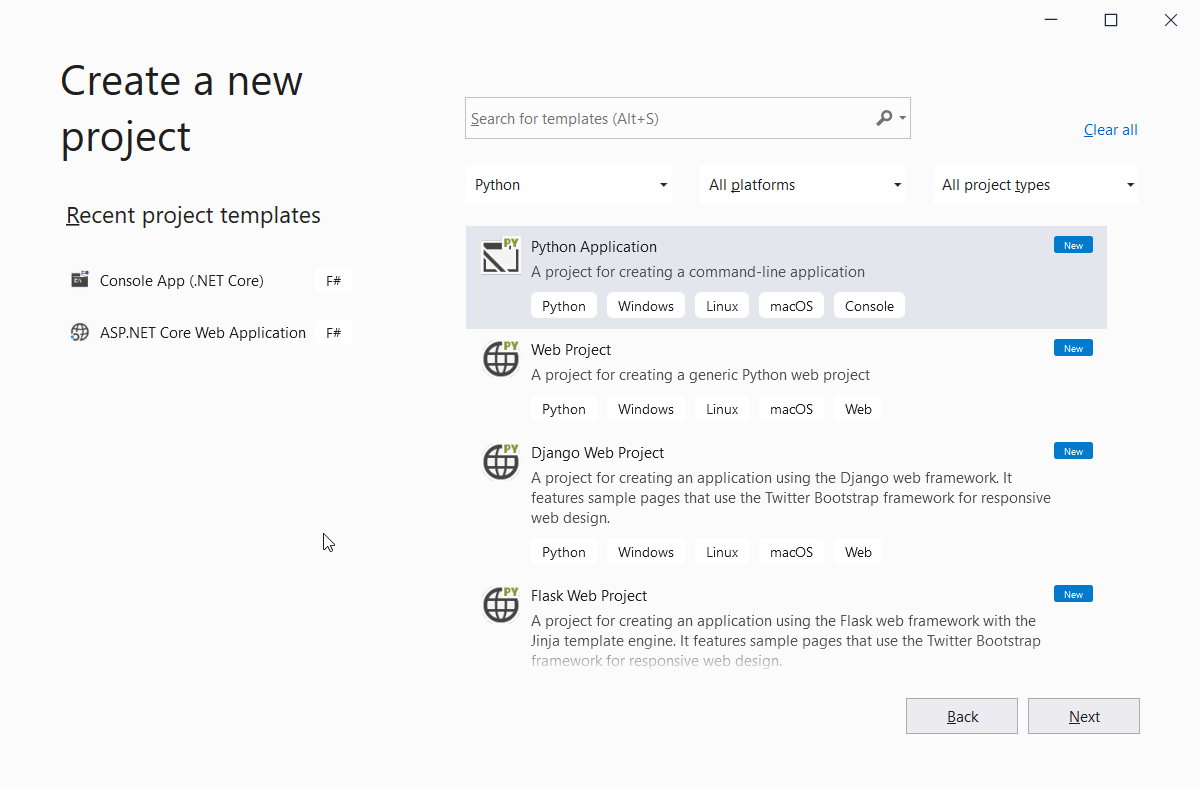
Open Visual Studio, then go to Create a new project and select Python on the Languages combo box. Select the Python Application template on the listed options, as shown in Figure 2.

Figure 2. Selecting the Python project template

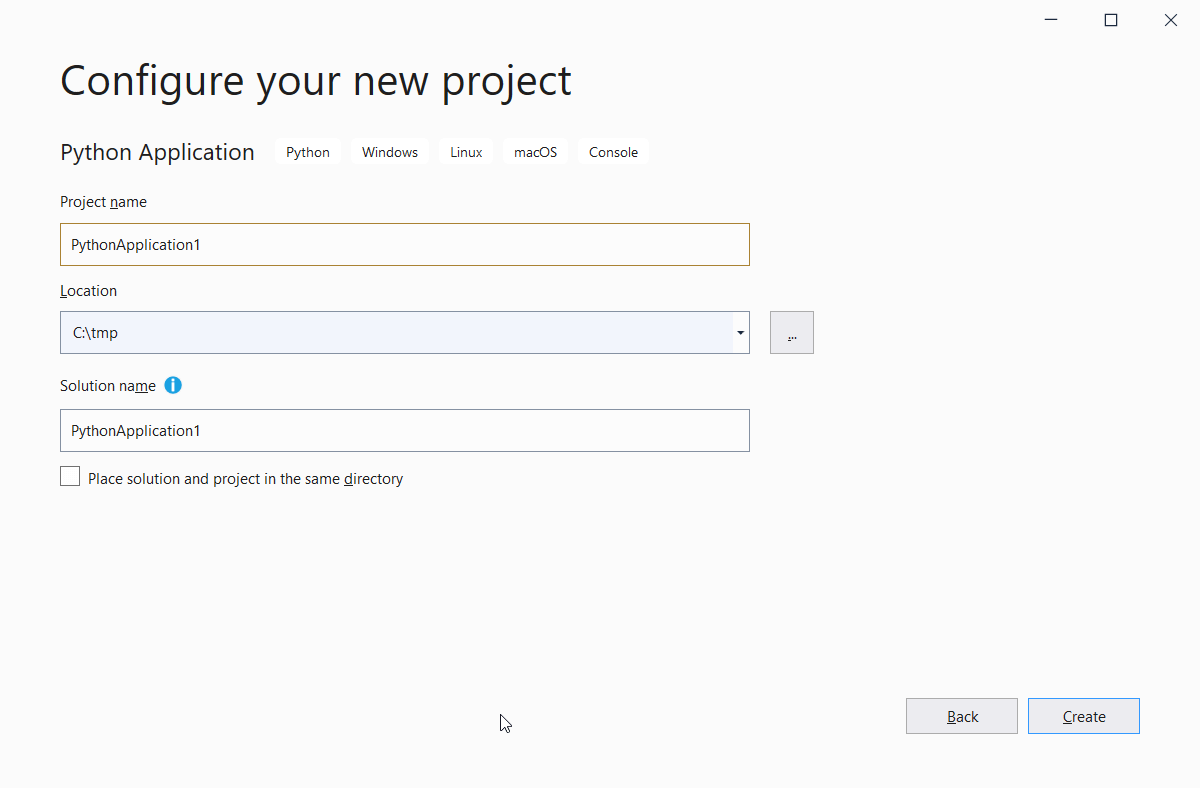
Hit Next, select a location, name your solution, and, finally, click the OK button. Use Figure 3 as a reference.

Figure 3. Configuring the project

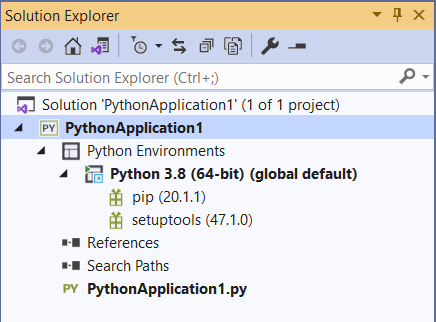
When the process finishes, you’ll be able to see the newly created project along with its config files. It’s important to state that the structure of Python applications is slightly different from the ones you’re used to dealing with .NET. Take a look at Figure 4 below.

Figure 4. Project structure

There are a few highlights to take note of:

  • Even though it is a Python project, Visual Studio preserves the solution structure common to all of its projects. That’s why you may see the VS solution at the top of the structure, as well as a .sln file if you navigate directly into your project folders.
  • Every Python project is represented by a .pyproj file extension.
  • Among the auto-generated project files, it comes together with a single .py file. That’s your starting point to create some Python code.
  • The Python Environments node brings the list of dependencies available to each of the Python interpreters installed. When you open each node, you may see the full list. Any new dependency you add to the project appears here.

When you open the PythonApplication1.py file, you’ll see that it’s empty. Let’s run the classic Hello World example in Python to test it out.

Place the following code snippet within the Python file:

print("Hello World!")

To run it, do as you would with any ordinary .NET application. Just hit the Start button available at the top bar, as shown in Figure 5.

Figure 5. Starting up the application

Note also that the Python version used to run the program is displayed within the following combo box. If you have other versions installed, you can pick the one you desire here.

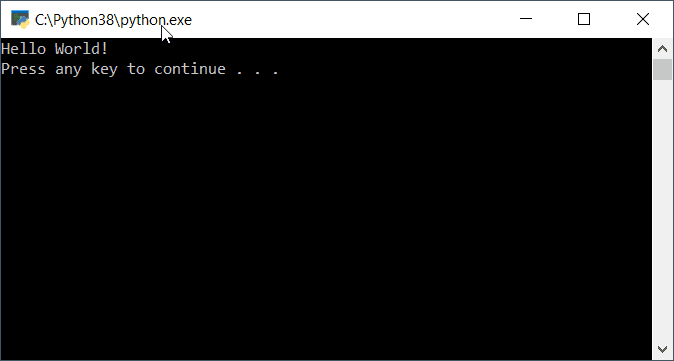
When the program finishes loading, you may see a screen like shown in Figure 6.

Figure 6. Hello World example in action

You can also import the same built-in libraries you’re used to doing when coding with Python elsewhere. Take the following example that calculates the power of two numbers:

import sys
from math import pow
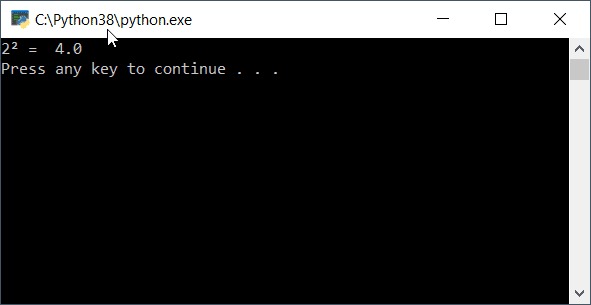
print("2² = ", pow(2, 2))

First, import the sys module. Then, import the pow function contained within the math module. Figure 7 shows the result of this program execution.

Figure 7. Python execution result

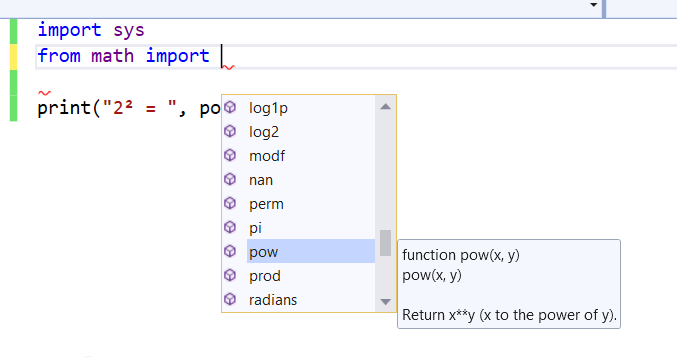
Visual Studio also understands the primary functions that compose the language and allow for code completion, which is something essential when coding with an IDE. Figure 8 illustrates how the auto-completion feature happens along with Visual Studio.

Figure 8. Code completion within Visual Studio for Python

The Interactive REPL

REPL stands for read–eval–print loop, which is a simple and interactive shell program to provide developers with an environment that takes inputs, executes them, and returns the results. Most programming languages support this feature.

As with many other languages that Visual Studio offers support, Python’s not different when it comes to interactive REPL.

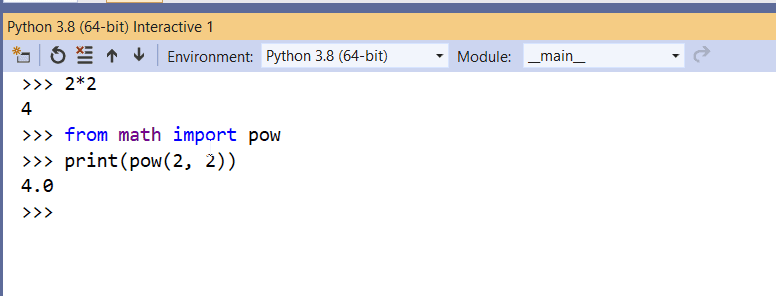
To open it, go to the menu View > Other Windows > Python Interactive Windows (or press Alt + I) and now you have a direct window to test your Python code. Figure 9 demonstrates a quick example of use.

Figure 9. Python Interactive REPL in Visual Studio.

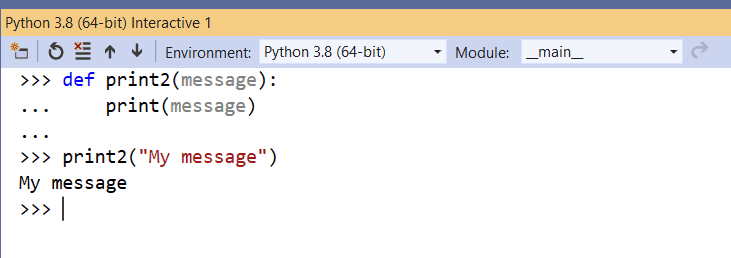
It also identifies multiline code statements, like when you’re defining a Python function and performs automatic indentation, as you can see in Figure 10. This way, you can test more complex code structures without a physical Python file.

Figure 10. Creating a custom function within REPL.

Importing third-party packages

You can also import 3rd-party packages directly within Visual Studio. For example, say you’d like to incorporate a few more complex mathematical formulas to your application via the NumPy library, which is used for scientific computing with Python.

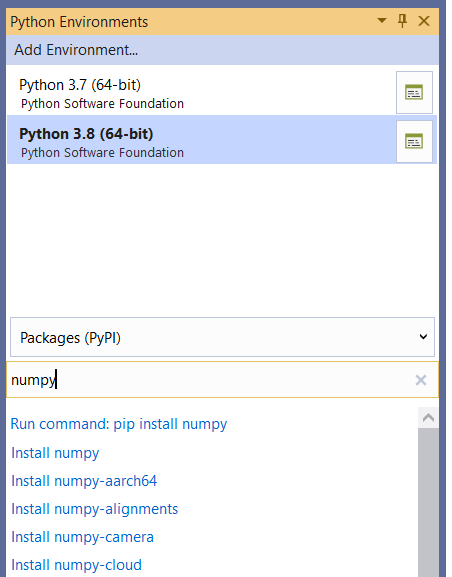
To do this, right-click the Python Environments node within your Solution Explorer window, and select the option View All Python Environments. Then, with your current Python version selected, make sure that Packages (PyPI) is selected. Type the name of the package you desire in the available field, as shown in Figure 11. Click Enter.

Figure 11. Installing the NumPy package.

A green loading bar will appear while the package is installing. When it’s finished, you can check on the results alongside the Output window. When the installation is complete, go back to your code file and place the contents shown in Listing 1 there.

Listing 1. Making use of NumPy package.

import sys
import numpy as np
a = np.arange(20)
print(a)
a = a.reshape(4, 5)
print(a)

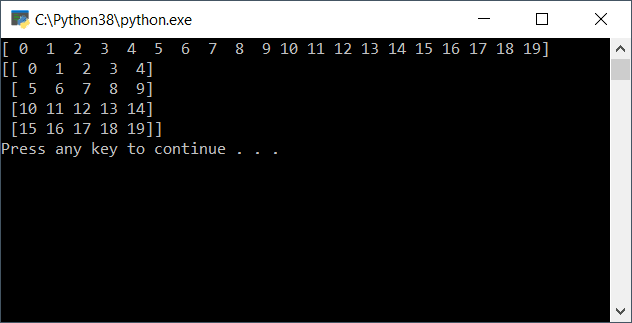
The arange function returns evenly spaced values within a given interval. Values are generated within the half-open interval [start, stop]. The reshape function, in turn, gives a new shape to the array without modifying its values. Figure 12 shows the output of this program execution.

Figure 12. Running a simple NumPy example.

This example demonstrates how powerful it is to deal with project dependencies within Visual Studio as it is with other IDEs.

Building a web application with Django

Now’s time to move on to a more robust application. Until now, you’ve explored how Python works in a Visual Studio Console application, the main features, shortcuts, dependency management, etc. It’s time to build something that resembles something useful in daily life — a web application made with Django.

Django is a high-level Python Web framework that encourages rapid development and clean, pragmatic design. One of the favorite choices for Python developers in terms of web applications. You may have noticed in the step where you created the Python project template, Visual Studio prompts a bunch of options related to Python frameworks, such as Django and Flask-based projects.

Now to get back to the initial steps and create another application by selecting the menu New > Project. When the window opens, make sure to have Python as the default language selected.

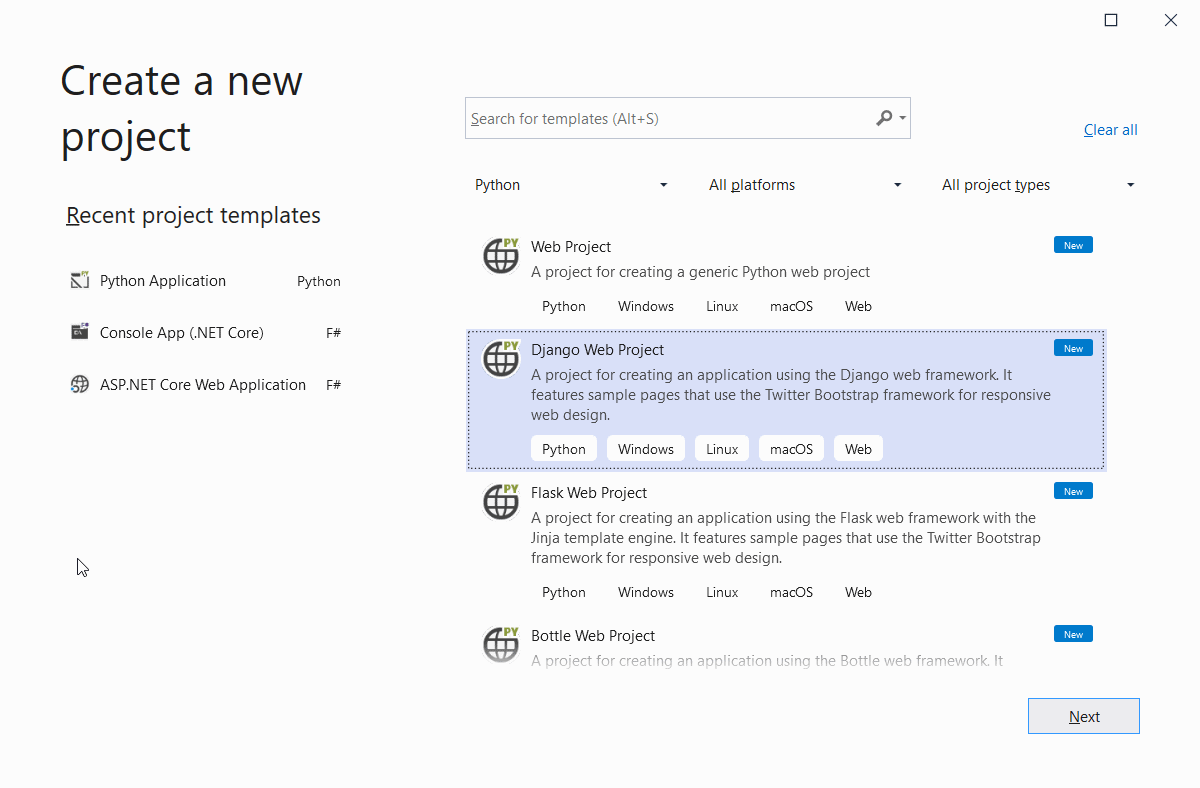
You’ve got an option to create an empty web project for generic Python web projects. However, stick with Django since it saves a lot of time in terms of configurations. Figure 13 illustrates this step.

Figure 13. Creating a new Django Web Project

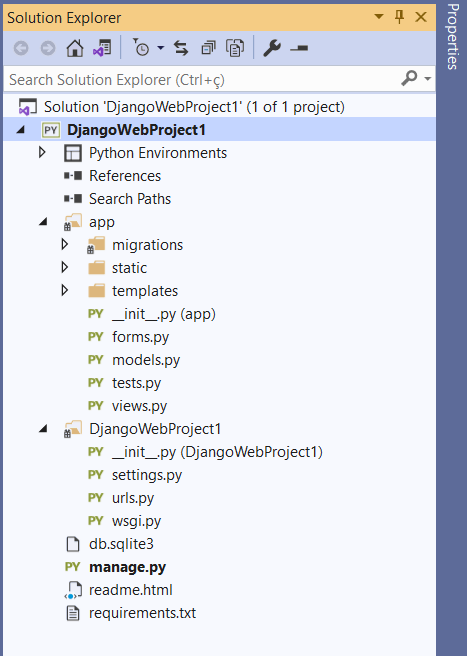
Click Next and, in the following screen, give the project and solution a name, select the project location, and hit the Create button. Once the project is created, make sure to take some time to analyze its initial structure (Figure 14).

Figure 14. Initial structure – Django web project

Projects in Django are composed of one or more inner Django applications, resembling a monolithic model. As you can see in the image above, each project is located right below the solution. You can have as many as you wish.

Setting Up a Virtual Env

Python works with virtual environments (venvs), which are self-contained directory trees with a Python installation for a specific version of the language. This structure helps to separate the global installed Python environment from the ones you’re using alongside your projects. They work as virtual workspaces.

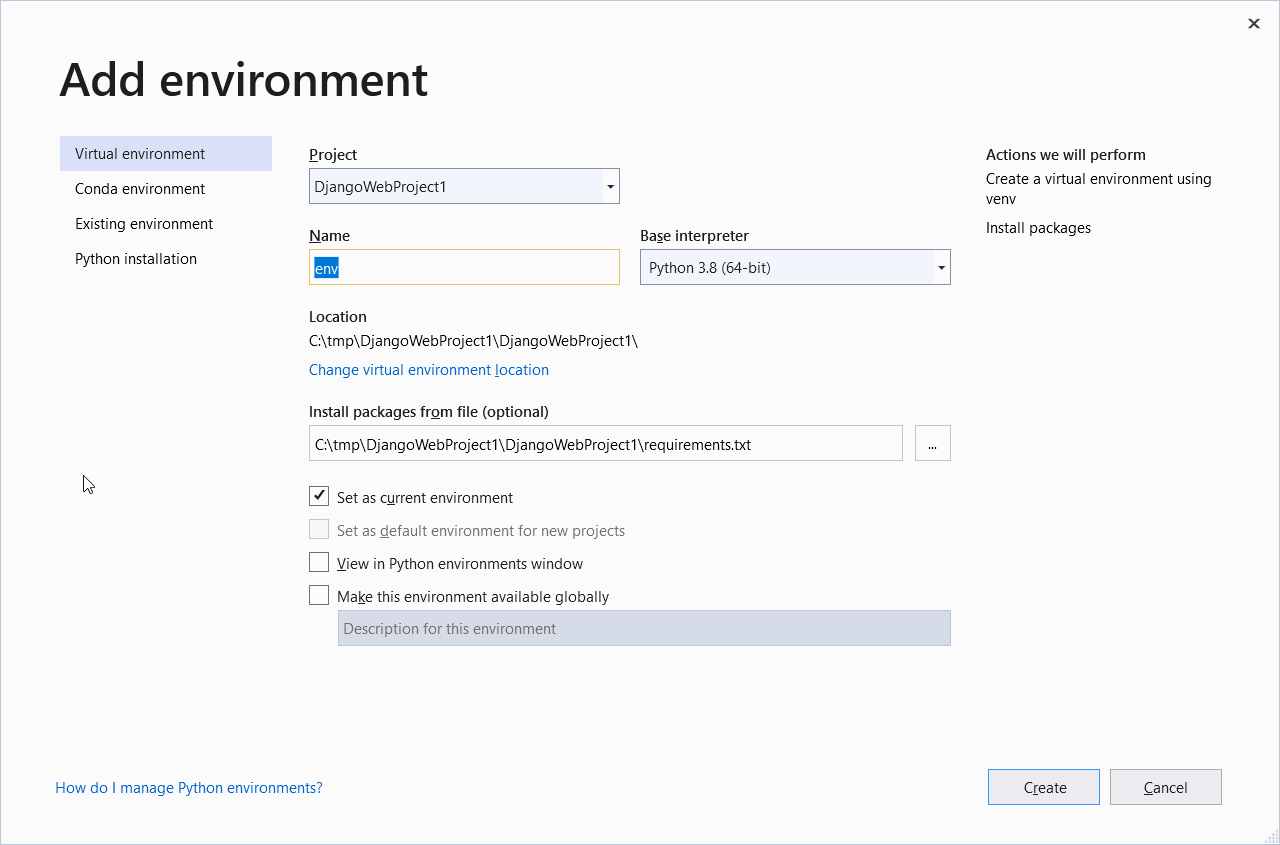
To add a venv to your Python Environments node, right-click the Python Environments node and select the option Add Environment… The window shown in Figure 15 will pop with a bunch of information, such as the name you want for the new environment, the Python version to use (3.8), and the location of the config files.

Figure 15. Adding a new virtual environment to Visual Studio

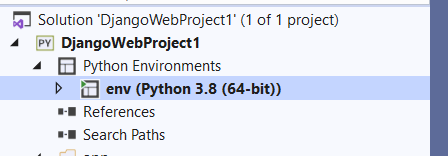
You can leave all the configs as they are and click the Create button. Just make sure to leave the Set as current environment checkbox checked. At the end of the process, your node will change to the following:

Figure 16. New Python environment set.

Great! You’re no longer using the default global environment. This way, all the Python packages and changes you perform will be restricted to this env, so your app becomes fully isolated and does not impact the others.

The Django Project

You can break down everything in the DjangoWebProject1 folder, the project structure, like this:

  • __init__.py: Python needs a way to differentiate ordinary folders from Python-folders. The way it does this is via this file. When Python finds this empty file in a directory, it immediately understands it’s Python-based.
  • wsgi.py: It’s used for WSGI (web server gateway interface) purposes. This example won’t use it.
  • settings.py: As the name suggests, this file takes care of all the settings for a Django project, such as authentication, session management, etc. You can find the full list of supported settings here.
  • urls.py: Here’s where you must map the routes for your Django endpoints, usually for your app’s pages.
  • manage.py: It’s a root configuration file that deals with settings such as env variables, general exception handling, etc.

The Django App

The Django application, which is located under the app folder, comes in a separate Python-based package because Django projects can have one or more Django apps. It will make use of the urls.py file you’ve just seen to route from the outer scope to the inner app’s scopes.

Among its main auto-generated folders and files, you can find:

  • a /migrations folder that takes care of the database scripts to automatically handle migrations back and forth.
  • a /templates folder to deal with the Django templates. Django templates are pieces of HTML that can receive dynamic variables to turn static pages into dynamic. See that a bunch of ready-to-use templates already come with it.
  • a forms.py file to help you on building web forms in Python and set up things like authentication and validation rules.
  • a models.py file to hold the Django models, which are encapsulations of data objects to hold your business model information.
  • a tests.py file to deal with unit testing.
  • and a views.py file to create and manage your web pages, handle the requests, call the services and databases, and return the responses. They work as controllers.

Running the Project

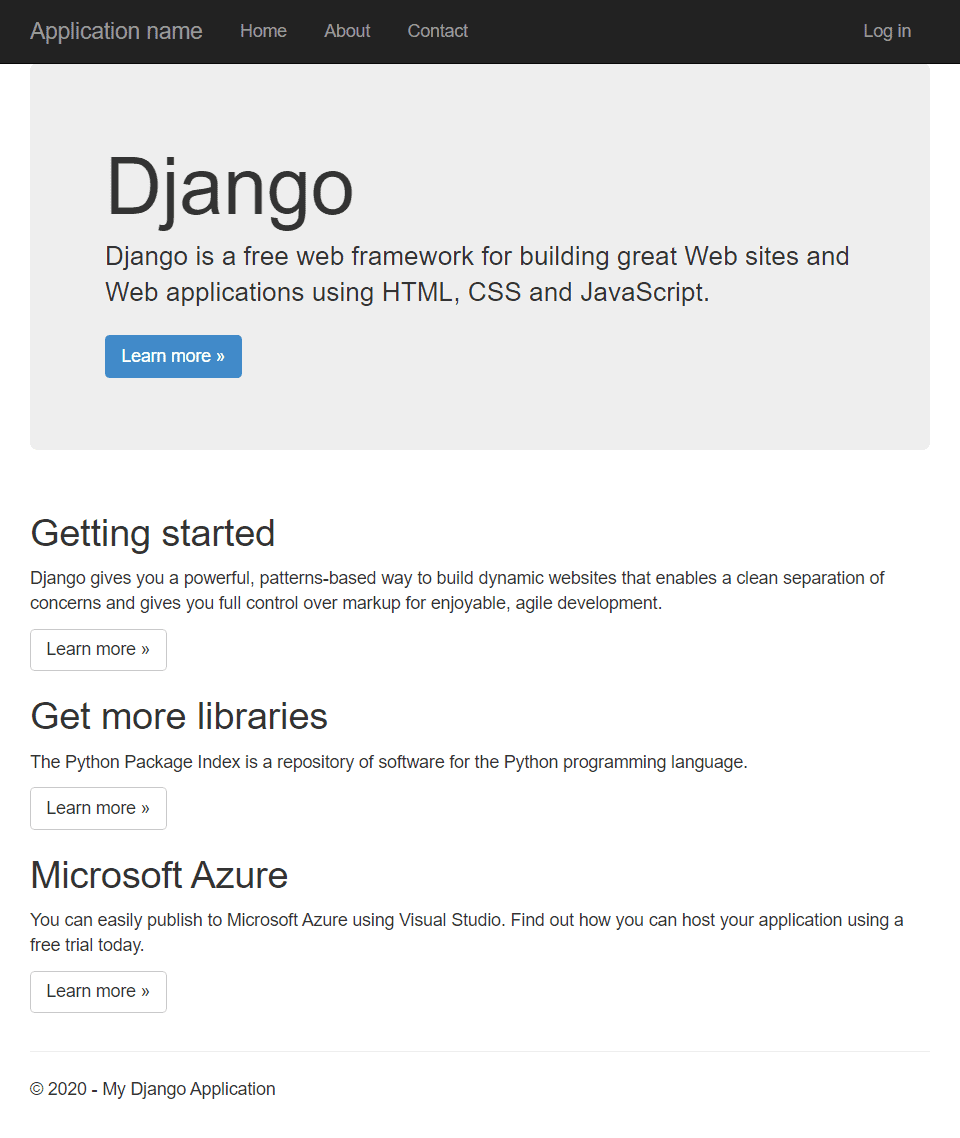
Now you’re ready to run the project and see how it works in action. Just click the Web Server (Google Chrome) button available at the top of the IDE. This will open a Chrome window and display the page shown in Figure 17.

Figure 17. Generated Django application.

To try out a change, go to the views.py file and substitute the home function with the following:

Listing 2. Adding a random-generated number to the response.

def home(request):
    """Renders the home page."""
    assert isinstance(request, HttpRequest)
    return render(
        request,
        'app/index.html',
        {
            'title':'SimpleTalk - Django with Visual Studio',
            'randomNumber': randint(0, 100),
            'year':datetime.now().year,
        }
    )

You’re changing the title value and adding a randomly generated integer value to a variable called randomNumber. This value will go directly into your HTML page template, the index.html. Don’t forget to import the randint function at the beginning of the file:

from random import randint

Then, open the index.html template file and change the jumbotron div content for the following:

<div class="jumbotron">
    <h1></h1>
    <p class="lead">Random number of the day: </p>
    <p><a href="https://www.djangoproject.com/" class="btn btn-primary btn-large">Learn more &raquo;</a></p>
</div>

See, easy… isn’t it? Now, check out the result in Figure 18.

Figure 18. Changing some values to the index template

Conclusion

There’s a whole lot more to see regarding Python development within Visual Studio. This was just a brief introduction to the main concepts and steps you’d have to take to get things started.

I can’t stress enough the need of going through the Python and Django official documentation, to guide you every time you feel lost. Or even to start with the language + framework.

What about you? How was your experience using Python along with Visual Studio? Leave your thoughts in the comments section and let’s discuss it. Good studies!


The post Developing Python with Visual Studio appeared first on Simple Talk.


from Simple Talk https://ift.tt/34j7Hte
via
Wednesday, December 16, 2020

Cross-origin resource sharing for cross-site cookie-based authentication

In today’s IT world, growth and competition lead industry to adopt faster releases of their software products and services to market. To avoid the cost of building services, enterprises subscribe to other readily available services. Businesses emphasize safeguarding their business data while consuming services from providers, and such service providers facilitate robust and secure communication channels to their consumers. Often enterprise business operations are fed by software applications and are secured with intranet applications contexts, where hostnames are known with domain names. There is no need for Cross-Site communication. With this new shift, services are securely exposed to consumers, but features are also consumed from different organizations over HTTP.

As organizations are widening their software applications to consume readily available services over HTTP, the security approaches are different than what is used for intranet applications for enterprise application development. Today, you’ll hear terms like Cross-Site or CORS (Cross-Origin resource sharing). CORS means that two independent applications communicate as publisher and subscriber, to secure the resources or content or data during communication (over HTTP request or response). There are different approaches, configurations, and best practices. Here authentication and authorization play a vital role to safeguard the participating applications. This article focuses on how authentication and authorization need special consideration when applications have multiple origins. It also looks at how a cookie-based authentication implementation works for a cross-origin site or under CORS.

Use Case: Authentication and Authorization

Organization “Company-E” has a homegrown Enterprise Health Record (EHR) E1, and organization “Company-P” has the Patient Portal P1 application to allow patients to view their own health records and communicate with their providers. Company-E and Company-P come to an agreement that allows P1 to subscribe to the service of E1 to facilitate the health data to the patient or patient’s responsible party. The hosting of the applications will remain the same, i.e., E1 is hosted and maintained by Company-E and P1 is hosted and maintained by Company-P. To enable this engagement, both E1 and P1 application need some enhancements to enable cross-origin communication over HTTP. Below is the simple requirement from each application

E1: expose secured service and allow only P1 to consume. Data send/received can happen on this service with users who are authenticated and have been privileged to do such activities.

P1: ability to provide user credentials to E1 services to send and receive data

Solution

The current E1 and P1 applications have been described, and the new requirements for enabling secure communication between them are documented. The next step is to diagram what needs to be accomplished. Figure 1 is a diagram depicting the logical view of P1-WebUI and E1-RESTful API service as per the requirements.

Figure 1: Logical view of P1 and E1 requirements

Figure 1 can be described as follows:

  • P1 is browser rendering web user interface created using React library, hosted by Company-P with URI https://healthui
  • E1 has RESTful API created with .NET core WebAPI, hosted by Company-E with URI http://healthapi
  • For authentication,
    • P1 sends an HTTP request with the body encapsulating valid user credentials
    • E1 validates credentials and, once successful, sends an HTTP (HTTP-only) cookie as a response to P1
    • P1’s HTTP client, i.e. browser, includes Auth.Cookie to each subsequent HTTP request
  • For authorization,
    • E1 validates each HTTP request other than sign-in, if the user does not have privileges, then response with status code 403 (Forbidden)

Implementation

Begin implementing the solution by following the captured approach notes. Note that the entire solution is not covered; only key points for implementing a solution are included. You can find the entire solution here.

RESTful API

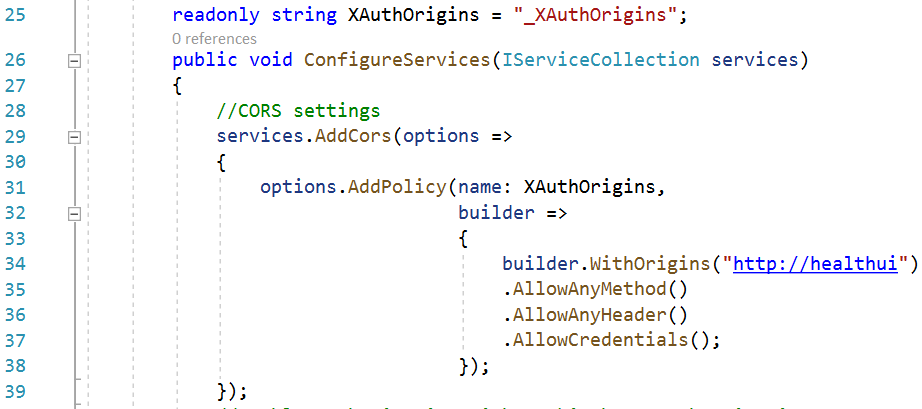
The E1 API is RESTful created with .NET core 3.1 Web-API. First, you need to configure the necessary settings to enable (cross-site) CORS HTTP request processing. The http://healthui app should be able to read or write data based on its functional business operations. To begin, open the startup.cs file of a Web-API project. Under the ConfigureService method, add a CORS service to reference IServiceCollection. Follow Figure 2, which enables CORS middleware to handles cross-origin requests.

Our cookie-based-authentication and authorization settings are fulfilled by the three core namespaces spaces of AspNetCore and they are listed as below in Figure 2.

Figure 2: Using statements

Line#1 from the above snippet facilitates all settings for enabling authentication and Line#2 facilitates enabling http cookies for authentication. Line#3 facilitates to establish authorization for each incoming request and as per needs of application authorization rules can be built.

NOTE that the entire application is not covered in this article. It covers only the key aspects of CORS cookie-based authentication. Figure 3 contains code to enable the CORS middleware.

Figure 3: Enable CORS middleware

  • Line#29, AddCors extension method is setup method, Action<CorsOption> is parameter to configure CORS with provided option
    • Line#31, a call to method options.AddPolicy, XAuthOrigins read-only string variable passed as the first parameter to specify the name of the policy and the second parameter is CorsPolicyBuilder
    • Line#34, adds hostname to the CorsPolicy.Orgins collection and specifies P1’s hosted application URI, http://healthui. This URI can be on port 80 HTTP or 443 HTTPS
    • Moving ahead with the same policy builder at Line#35, AllowAnyMethod method allows any HTTP request method, i.e. GET, HEAD, or POST, etc.
    • Line#36, AllowAnyHeader allows request headers such as “content-type” or “content-language”.
    • Line#37, AllowCredentials method is to allow cross-origin credentials. The HTTP response includes a header Access-Control-Allow-Credentials which tells the browser that the server allows credentials for cross-origin-requests. This is how it works:
      • If the E1 API sent credentials to the calling application P1’s browser and the response header doesn’t include Access-Control-Allow-Credentials, then the browser doesn’t expose response to the P1 WebUI, and the request fails
      • The CORS specification states that all origin ‘*’ is invalid if “Access-Control-Allow-Credentials” header is present. In this case, at Line#34, there is only the known hostname “http://heathui.”

Once the CORS middleware policy with name is built with the required configuration, the same policy name shall be used to add the CORS middleware to P1’s RESTful API to allow cross-domain HTTP requests as shown in Figure 4.

Figure 4: Add the CORS middleware to allow cross-domain HTTP requests

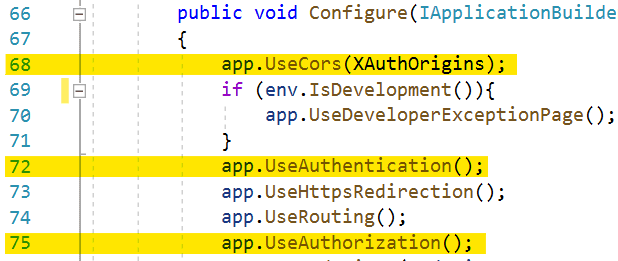
As highlighted at Line#68, it’s necessary to add CORS middleware for P1 API’s application builder at the first line in the configuration method.

At this stage, CORS middleware is added with the desired configuration. The next step is to enable authentication and authorization middleware to establish secured cross-site HTTP communication. Inside the same Configuration method. Line#72 is adding authentication middleware, and Line#75 is adding authorization middleware to P1’s RESTful API application builder.

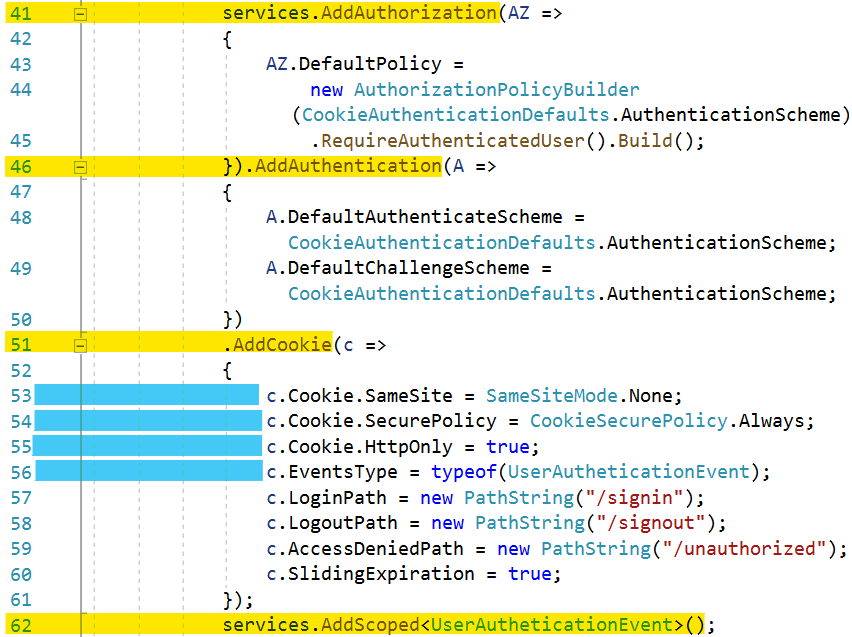
Next, go back to ConfigurationServices method, add authentication and authorization services with required configuration policy options. Figure 5 demonstrates adding services to the service collection.

Figure 5: Adding services

The important points to note are as follows:

  • Line#41, call to the method AddAuthorization adds the authorization policy to the service collection parameter services. Its authorization parameter sets the default policy with new the AuthorizationPolicyBuilder instance having “Cookies” authentication scheme. Specifies user must be authenticated with method “RequireAuthenticatedUser” to access any resource
  • Line#46, call to the method AddAuthentication adds authentication options to service collection parameter services, “DefaultAuthenticateScheme” and “DefaultChallengeScheme” are set to “Cookies”, which is a constant value of “CookieAuthenticationDefaults.AuthenticationScheme” which enables cookie-based authentication. Each request must carry the valid cookie to access the API resource
  • Line#51, call to the method AddCookie adds the cookie authentication options to the authentication configuration
    • Line#53, the same site property Cookie.SameSite is set to SameSiteMode.None, i.e. to allow cross-site cookie use
    • Line#54, cookie is always set to secure and, all calls to API needs to be done with HTTPS
    • Line#55, Cookie.HttpOnly set to true. The cookie will only be passed to HTTP requests and is not made available to script on the page
    • Line#56, UserAuthenticationEvent type is used to get events instance for authenticating incoming cookie from an HTTP request
    • Rest of the lines from, #57 to #60, sets login, logout, access denied paths and sliding expiration to true which will issue new expiration time to the valid and authenticated HTTP request
    • Line#62, adds the UserAuthenticationEvent type to the service collection instance

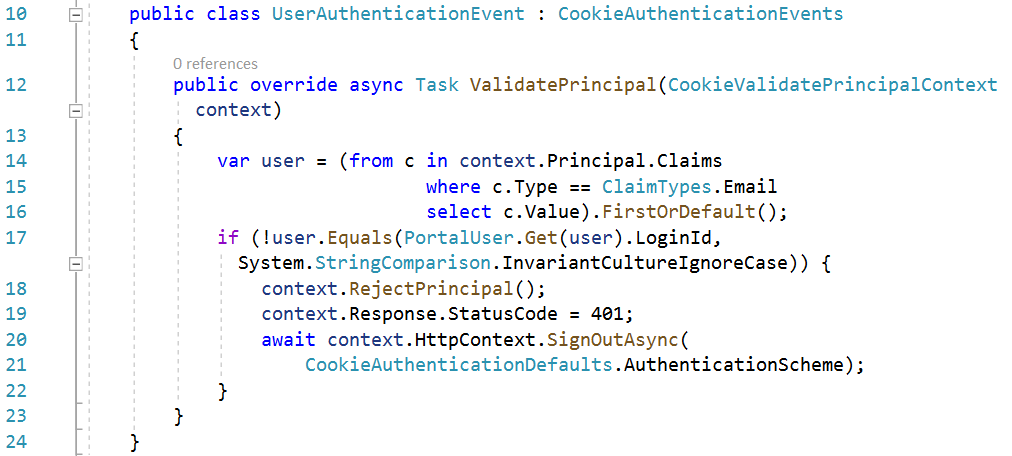
The code for setting and enabling the CORS plus cookie-based secured authorization and authentication validator for validating incoming requests is complete. Take a look in brief what “UserAuthenticationEvent” has to intercept each incoming request, and how it verify cookie and act accordingly to with HTTP response as shown in Figure 6.

Figure 6: Verify cooking and response

UserAuthenticationEvent overrides the ValidatePrincipal method of the base class CookieAuthenticationEvents, fetch user’s email from principal claims collection and check the validity of it. If validation fails then:

  • Reject the incoming principal from cookie
  • Set the HTTP status code to 401 Unauthorized
  • Sign out current HTTP context with “Cookie” authentication scheme

Secure API Resource

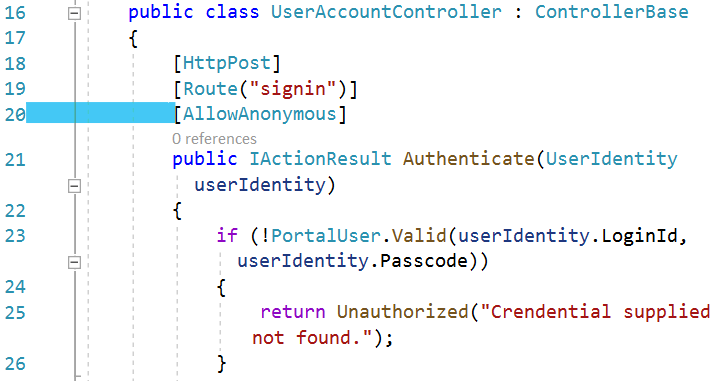
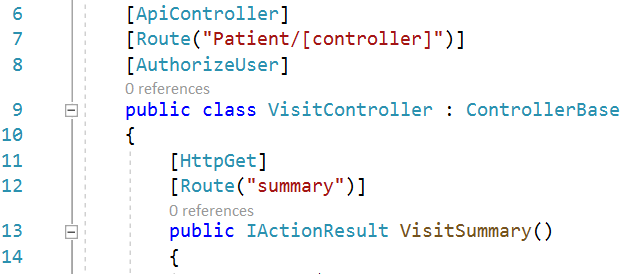
Only the “sign-in” route should allow anonymous access. There is no need to have authentication and authorization checks; hence the AllowAnonymous attribute is added to the Authenticate method, i.e. Line#20 in UserAccountController shown in Figure 7.

Figure 7: Allow anonymous sign in

All other controllers except UserAccountController should have AuthoriseUser attribute, to validate principal from incoming HTTP request context show in Figure 8.

Figure 8: The AutorizeUser attribute

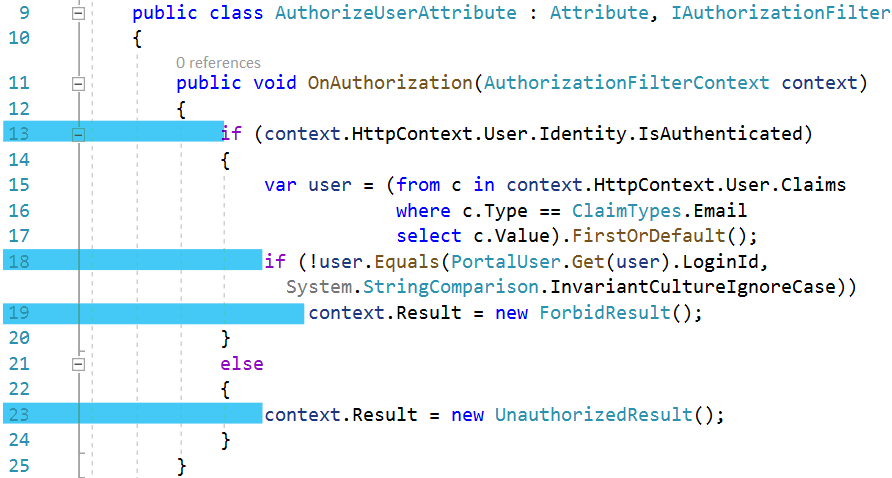
The code shown below in Figure 9 is the implementation of an authorization check. Here you can add your own rules to restrict the user if they do not have rights to access resources for which the HTTP request has been made.

Figure 9: The AuthorizeUserAttribute class

The code:

  • Line#13, checks the user who made HTTP request. Its HTTPContext has user identity authenticated or not. If the request is not authenticated then, assign UnauthorizedResult result to AuthorizationFilterContext instance, which will add HTTP status code 401 (Unauthorized) to HTTP response.
  • If the user is authenticated but not found in the system, then assign ForbidResult result to AuthorizationFilterContext instance, which will add HTTP status code 403 (Forbidden) to HTTP response.

Web UI

P1’s Web UI is built with React web UI library, a browser rendering single page application, to have a component-based UI. The Axios react npm library (promise-based HTTP client) is used for making HTTP requests to E1’s RESTful API. Enable consumer P1 to make calls to cross-site calls under the secured policy of E1.

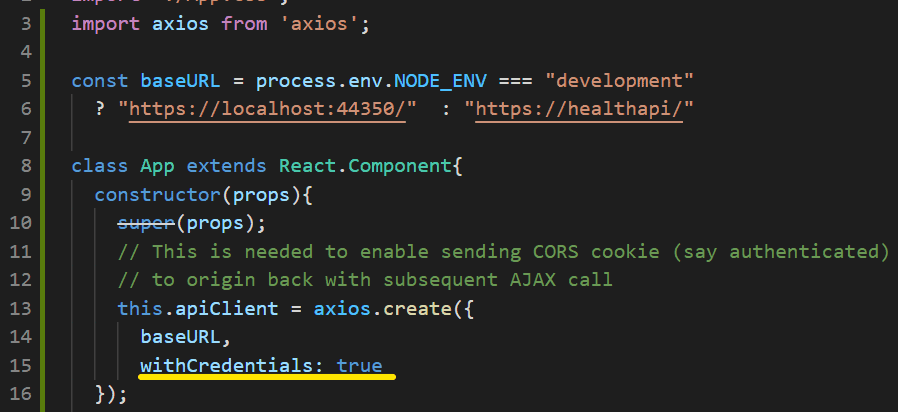
Remember E1’s API has been enabled to allow credentials so the browser can consider credentials in subsequent HTTP requests. Yet to inform browsers that do include credentials, ajax HTTP request call needs to include attribute withCredential: true. In Figure 10 below, Line#15 creates and enables the HTTP-Client apiClient instance of axios to include credentials.

Figure 10: Enable HTTP client

P1’s web UI uses this.apiClient for making an HTTP request to https://healthapi. Due to the CORS setting at E1 API, the client-side script will not be able to access the authentication cookie. Still, the browser does recognize and manage inclusion of the authentication cookie in subsequent HTTP requests. That’s the only configuration you need to take care of at client-side. Now to look at HTTP request and HTTP response attributes to know what is happening under cross-site communication.

All working together

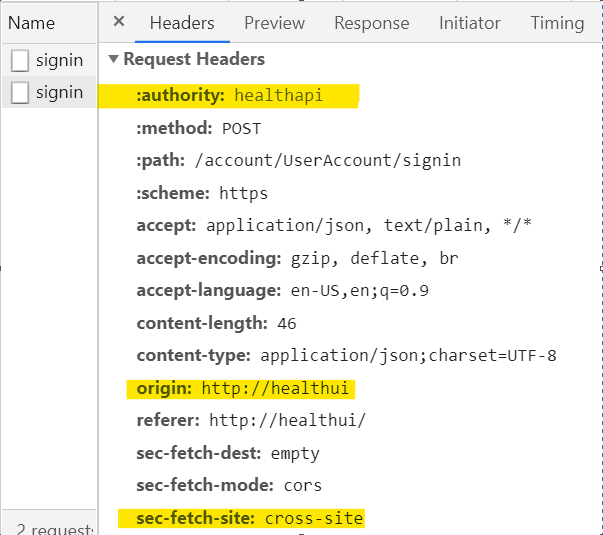
With the help of the developer toolbar of the Chrome browser, you will test, verify and see inside of outgoing requests and incoming responses over the network. The Figure below is the snapshot of a network profile captured during the sign-in attempt. The URI is http://healthui/account/useraccount/signin. Many headers can be found under request headers. The request origin is http://healthui; authority header is host, i.e. healthapi; the path is /account/useraccount/signin; the method is POST on HTTPS scheme; header sec-fetch-site value is cross-site. This indicates the request has been made to cross-site. Figure 11 shows the Request Headers.

Figure 11: Request Headers

Review the response headers one by one from this HTTP request:

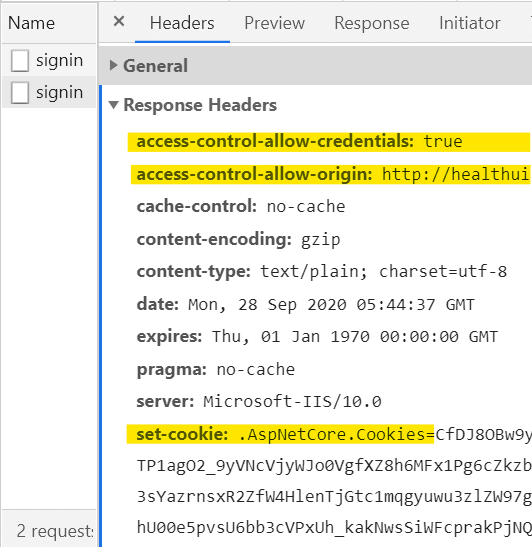
  • access-control-allow-credentials: true, this covers this header while setting CORS service configuration, but here it is, now the browser will only expose the response to frontend code, in this case, JavaScript
  • access-control-allow-origin: http://healthui, this indicates whether the response can be shared with the requesting application from the given origin(host)
  • set-cookie: xxxxxxx…. authentication cookie sent by https://healthapi with the response object

Figure 12 shows the Response Headers

Figure 12: Response Headers


After looking at the response header and sending the authentication cookie, review look at the attributes of the response cookie shown in Figure 13.

Figure 13: The Response Cookies

The name of the cookie is .AspNetCore.Cookies; value is long alphanumeric string; issuing domain is healthapi; HttpOnly and Secured are enabled, and SmeSite is none. These are all configuration settings found in startup.cs in E1’s RESTful API.

Once P1 WebUI is authenticated, the browser will add an authentication cookie to all subsequent HTTP requests. You can see this from the outgoing request’s headers captured by network profile. A cookie named .AspNetCare.Cookies is an authentication cookie which is included by the browser, and the server will validate to process the response. See Figure 14.

Figure 14: The authentication cookie

If any other application tries to access E1’s API, then it will fail with this server error:

Access to XMLHttpRequest at ‘https://helathapi/account/UserAccount/signin’ from origin ‘http://DoubleCare’ has been blocked by CORS policy: Response to preflight request doesn’t pass access control check: No ‘Access-Control-Allow-Origin’ header is present on the requested resource.

Conclusion

E1’s API is secured and available to P1’s WebUI to get data. If any other app tries to access the RESTful API, then it won’t gain access to it, and the server will throw CORS origin or cross-site exception to the caller.

Today, there are many consumable services available for business applications. Instead of inventing services, industry prefers to sign-up for services. Such solution works best for healthcare, e-commerce, financial, tours & travels, hospitality and others.

This example provides the solution and meets what is needed:

  • Applications or distributed and owned by individual organization, one is a subscriber and other is a distributor
  • Secured authentication to enable safe data communication over HTTP
  • Cross-Site authentication/authorization, let the browser handle authenticated cookies for HTTP requests
  • Distributor validates incoming cookie before handling it to action for accessing resource(s)

Source Code

The source code for this project is available here https://github.com/hi10p/CookieCORS.git


The post Cross-origin resource sharing for cross-site cookie-based authentication appeared first on Simple Talk.


from Simple Talk https://ift.tt/38dm6bE
via

Monday, December 14, 2020

A year of giving back at Redgate

This year has been difficult for most of us, and it’s almost over. The lives of people throughout the world have been turned upside down. Many of us, myself included, already worked remotely, but now face a multitude of new challenges.

When confronted with the looming crisis in March, Redgate thought first about the safety of employees. We also came up with ways to help the Data Platform community and started Community Circle. Here’s a list of some of the community activities from the Advocates Team (Steve Jones, Grant Fritchey, Kendra Little, and myself) and others working at Redgate:

The Community Circle projects were given high priority, but we also did many things on our own to volunteer our time and skills to the data platform community. Kendra has been creating training courses for years, including classes and challenges about performance and T-SQL. This year, she has made all 30 of her online courses available for free. The Advocates Team presented and moderated sessions and mentored new speakers at several conferences (New Stars of Data, Data Platform Discovery Day, Group By, SQL Friday, DataWeekender, SQL Bits, SQL Saturdays, user groups, and PASS Summit to name a few). I taught three free beginning T-SQL workshops for people transitioning to tech careers at my favourite non-profit organization LaunchCode. Steve  is the organizer of T-SQL Tuesday, an excellent way for the community members to share their blogs.

We also did a few things that are way outside the data platform. After not donating blood for several years, I realized this was a great time to start up again and donated one unit of whole blood and seven units of platelets. Donating platelets takes a couple of hours each time, and there are a few mild side-effects, but every unit can save someone’s life. I encourage you to donate blood if you can. (If you happen to be a Covid-19 survivor, convalescent plasma is in high demand!)

Grant took his love of ham radio and supported his community by becoming the Local Community Coordinator for ARES (Amateur Radio Emergency Services). His group trains and practices to be ready to provide communication for emergencies. During typical years, they also assist with community events like road races. He also volunteered with CERT (Community Emergency Response Team) assisting with health and safety at town meetings and elections.

This has been a tough year for everyone, but we can all find ways to help each other and get through it together.

Commentary Competition

Enjoyed the topic? Have a relevant anecdote? Disagree with the author? Leave your two cents on this post in the comments below, and our favourite response will win a $50 Amazon gift card. The competition closes two weeks from the date of publication, and the winner will be announced in the next Simple Talk newsletter.

The post A year of giving back at Redgate appeared first on Simple Talk.


from Simple Talk https://ift.tt/3qYbrtC
via

Friday, December 11, 2020

DBA in training: Know your server’s limits

The series so far:

  1. DBA in training: So, you want to be a DBA...
  2. DBA in training: Preparing for interviews
  3. DBA in training: Know your environment(s)
  4. DBA in training: Security
  5. DBA in training: Backups, SLAs, and restore strategies
  6. DBA in training: DBA in training: Know your server’s limits 

Having taken steps to map your database applications to the databases and address your security and backups, you need to turn your attention to your server’s limits.

What do I mean by limits? Certainly, this is an allusion to how you will monitor your server drive capacity, but I also mean how you will track resource limits, such as latency, CPU, memory, and wait stats. Understanding all of these terms, what normal values are for your server, and what to do to help if the values are not normal, will help to keep your servers as healthy as possible.

These measures are big, in-depth topics in and of themselves. This will only serve to get you started. Links to more in-depth resources are included with each topic, and you will doubtless find others as you progress through your career.

Drive Space

Whether you are hosting servers on-prem or in the cloud, and however your drives may be configured, you need to know how much space your files are consuming, and at what rate. Understanding these measures is essential to helping you to both manage your data (in case you find that it is time to implement archiving, for instance) and your drives (i.e., you’ve managed your data as carefully as you can, and you simply need more space). It is also vital to help you to plan for drive expansion and to provide justification for your requests. Whatever you do, avoid filling the drives. If your drives fill, everything will come to a screeching halt, while you and an unhappy Infrastructure team drop everything to fix it. If you are using Azure Managed Instances, you can increase the space as well. Storage limits and pricing in the cloud will depend on a number of factors – too many to explore here.

How can you monitor for drive capacity? Glenn Berry to the rescue! His diagnostic queries earned him the nickname “Dr. DMV”, and they are indispensable when assessing the health of your servers. They consist of nearly 80 queries, which assess nearly anything you can imagine at the instance and database levels. He is good about updating these once a month, and they work with Azure as well as SQL Server. If you do not like manually exporting your results to Excel and prefer using PowerShell instead, his queries work with that as well. This should get you started. This example (Query 25 of his SQL Server 2016 Diagnostic Information Queries) will give you the information you need for drive space:

SELECT DISTINCT
       vs.volume_mount_point,
       vs.file_system_type,
       vs.logical_volume_name,
       CONVERT(DECIMAL(18, 2), 
            vs.total_bytes / 1073741824.0) AS [Total Size (GB)],
       CONVERT(DECIMAL(18, 2), vs.available_bytes / 1073741824.0) 
            AS [Available Size (GB)],
       CAST(CAST(vs.available_bytes AS FLOAT) / 
            CAST(vs.total_bytes AS FLOAT) AS DECIMAL(18, 2)) 
           * 100 AS [Space Free %]
FROM sys.master_files AS f WITH (NOLOCK)
    CROSS APPLY sys.dm_os_volume_stats(f.database_id, f.[file_id])
        AS vs
OPTION (RECOMPILE);

Tracking the results of this diagnostic query should help to get you started in monitoring your space and checking where you are. Regular tracking of your drive space will help you to see how quickly it is growing and to help you plan when (and how much) to expand them.

To help you track your database growth, you might try something like this query, which I have used countless times. It comes from here and is based on backup file sizes:

DECLARE @startDate DATETIME;
SET @startDate = GetDate();
SELECT PVT.DatabaseName
    ,PVT.[0]
    ,PVT.[-1]
    ,PVT.[-2]
    ,PVT.[-3]
    ,PVT.[-4]
    ,PVT.[-5]
    ,PVT.[-6]
    ,PVT.[-7]
    ,PVT.[-8]
    ,PVT.[-9]
    ,PVT.[-10]
    ,PVT.[-11]
    ,PVT.[-12]
FROM (
    SELECT BS.database_name AS DatabaseName
        ,DATEDIFF(mm, @startDate, BS.backup_start_date) 
              AS MonthsAgo
        ,CONVERT(NUMERIC(10, 1), AVG(BF.file_size / 1048576.0))
              AS AvgSizeMB
    FROM msdb.dbo.backupset AS BS
    INNER JOIN msdb.dbo.backupfile AS BF ON BS.backup_set_id 
             = BF.backup_set_id
    WHERE BS.database_name NOT IN (
            'master'
            ,'msdb'
            ,'model'
            ,'tempdb'
            )
        AND BS.database_name IN (
            SELECT db_name(database_id)
            FROM master.SYS.DATABASES
            WHERE state_desc = 'ONLINE'
            )
        AND BF.[file_type] = 'D'
        AND BS.backup_start_date BETWEEN DATEADD(yy, - 1, @startDate)
            AND @startDate
    GROUP BY BS.database_name
        ,DATEDIFF(mm, @startDate, BS.backup_start_date)
    ) AS BCKSTAT
PIVOT(SUM(BCKSTAT.AvgSizeMB) FOR BCKSTAT.MonthsAgo IN (
            [0]
            ,[-1]
            ,[-2]
            ,[-3]
            ,[-4]
            ,[-5]
            ,[-6]
            ,[-7]
            ,[-8]
            ,[-9]
            ,[-10]
            ,[-11]
            ,[-12]
            )) AS PVT
ORDER BY PVT.DatabaseName;

This gives you an idea of how quickly the databases on your servers have grown over the last twelve months. It can also help you to predict trends over time if there are specific times of year that you see spikes that you need to get ahead of. Between the two, you will have a much better idea of where you stand in terms of space. Before asking for more though, your Infrastructure and network teams will thank you if you carefully manage what you have first. Look at options to make the best use of the space you have. Perhaps some data archival is an option, or compression would work well to reduce space. If you have a reputation for carefully managing space before asking for more, you will have less to justify when you do make the request.

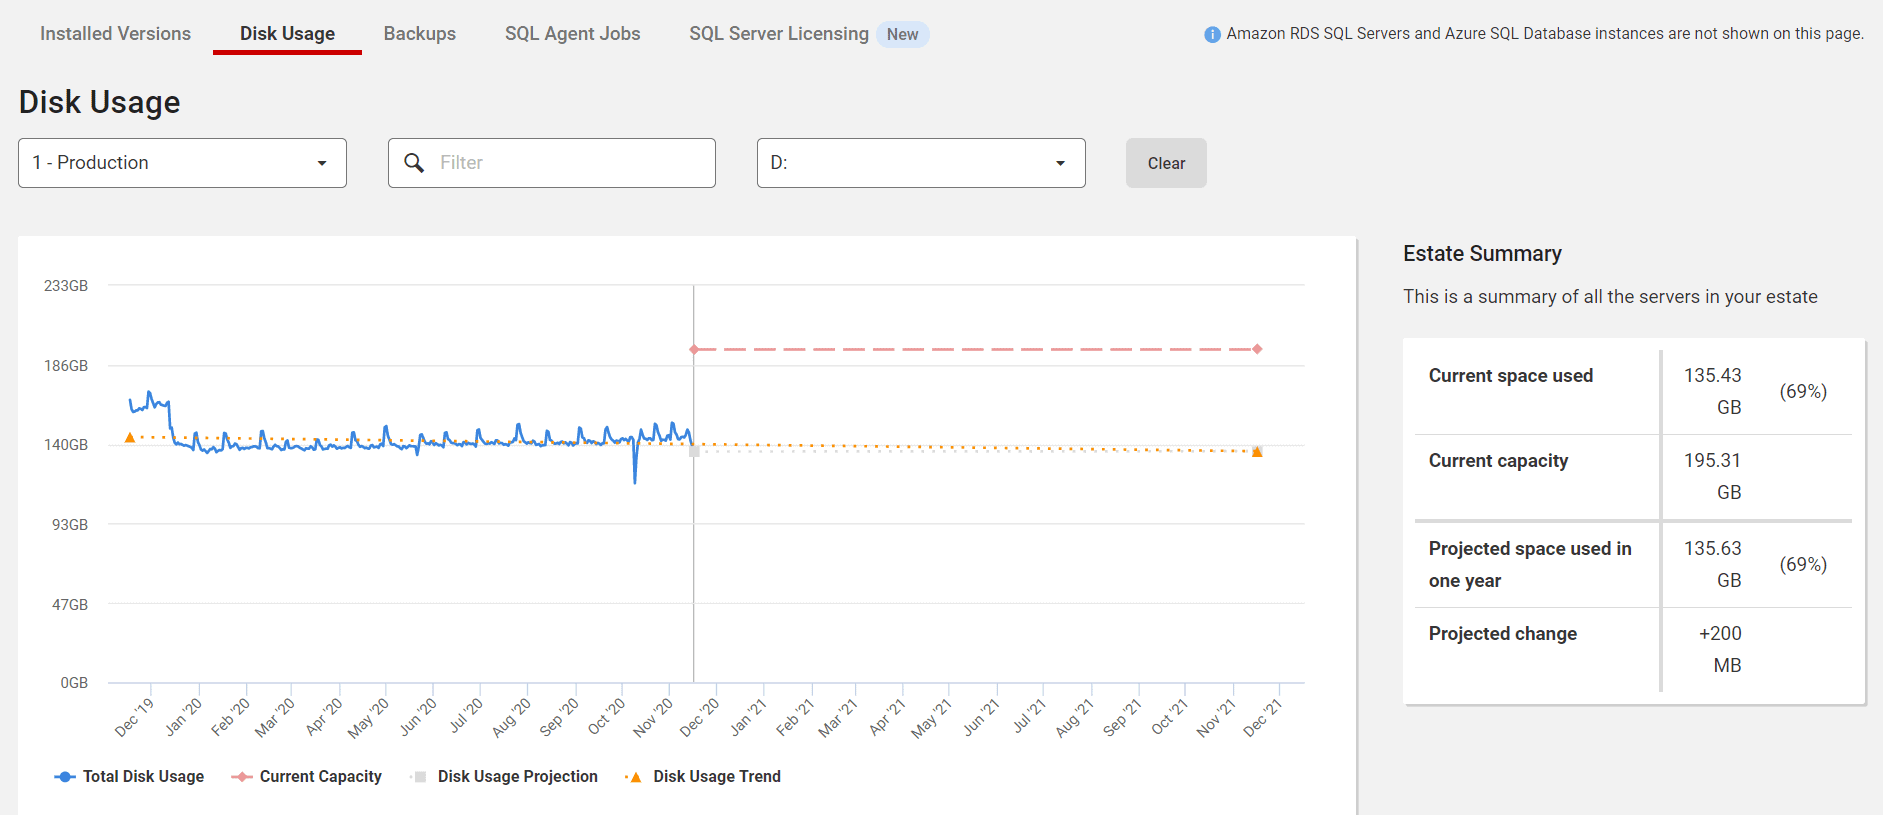
If you have SQL Monitor, you can watch disk growth and project how much you will have left in a year.

SQL Monitor Disk Usage page showing current and predicted capacity.

Know Your Resource Limits

You should now have some sort of idea of idea of how much space you currently have and how quickly your databases are consuming it. Time to look to resource consumption. There are a host of metrics that assess your server’s resource consumption – some more useful than others. For the purposes of this discussion, it will be limited to the basics – latency, CPU, and memory.

Latency

Latency means delay. There are two types of latency: Read latency and write latency. They tend to be lumped together under the term I/O latency (or just latency).

What is a normal number for latency, and what is bad? Paul Randal defines bad latency as starting at 20 ms, but after you assess your environment and tune it as far as you can, you may realize that 20 ms is your normal, at least for some of your servers. The point is that you know what and where your latencies are, and you work toward getting that number as low as you possibly can.

Well, that sounds right, you are probably thinking. How do you do that? You begin by baselining – collecting data on your server performance and maintaining it over time, so that you can see what is normal. Baselining is very similar to a doctor keeping track of your vital signs and labs. It’s common knowledge that 98.6 F is a baseline “normal” temperature, for instance, but normal for you may be 97.8 F instead. A “normal” blood pressure may be 120/80, but for you, 140/90 is as good as it gets, even on medication. Your doctor knows this because they have asked you to modify your diet, exercise and take blood pressure medication, and it is not going down any more than that. Therefore, 140/90 is a normal blood pressure for you. Alternatively, maybe you modified your diet as much as you are willing to, but are faithful to take your medications, and you exercise when you think about it. In that case, your blood pressure could still go down some, but for now, 140/90 is your normal.

The same is true for your servers. Maybe one of your newer servers is on the small side. It does not have a lot of activity yet, but historical data is in the process of back loading into one of the databases for future use. It has 5 ms of read latency and 10 ms of write latency as its normal.

Contrast that with another server in your environment, which gets bulk loaded with huge amounts of data daily. The server is seven years old and stores data from the dawn of time. The data is used for reports that issue a few times a day. It has 5 ms of read latency, but 30 ms of write latency. You know that there are some queries that are candidates for tuning, but other priorities are preventing that from happening. You also realize that this is an older server approaching end of life, but there is no more budget this year for better hardware, so 30 ms of write latency is normal – at least for now. It is not optimal, but you are doing what you can to stay on top of it. The idea is to be as proactive as possible and to spare yourself any nasty surprises.

To understand your baselines, you must collect your data points on a continuous basis. If you are new and no one is screaming about slowness yet, you might have the luxury of a month to begin your determination of what is normal for your environment. You may not. Nevertheless, start collecting it now, and do not stop. The longer you collect information on your I/O latency (and the other points discussed in this article), the clearer the picture becomes. Moreover, you can measurably demonstrate the improvements you made!

If you find that your latency is in the problem zone, the article I referred to before has some great places to begin troubleshooting. Try to be a good citizen first and look at all the alternatives Paul suggests before throwing hardware at the problem. Many times, you are in a position to help. I once had a situation where we were implementing some software, and a developer wrote a “one ring to rule them all” view that wound up crashing the dev server – twice. By simply getting rid of unnecessary columns in the SELECT statement, we reduced the reads in the query from over 217 million to about 344,000. CPU reduced from over 129,000 to 1. If we could have implemented indexing, we could have lowered the reads to 71. On those days, you feel like a hero, and if your server could speak, you would hear the sigh of relief from taking the weight off its shoulders.

Other query issues can also lead to unnecessary latency. One place to check is your tempdb. Here, you want to look for queries inappropriately using temporary structures. You may find, for instance, that temp tables are loaded with thousands of rows of data that are not required, or they are filtered after the temp table is already populated. By filtering the table on the insert, you will save reads – sometimes, a lot of them! You could find a table variable that would perform better as an indexed temp table. Another place to look is at indexing. Duplicate indexes can cause latency issues, as well as bad indexing, which causes SQL Server to throw up its hands and decide that it would be easier to read the entire table rather than to try to use the index you gave it.

CPU

Think of CPU as a measure of how hard your queries are making SQL Server think. Since SQL Server is licensed by logical core, that may lead you to wonder what the problem is with using your CPU. The answer is, nothing – as long as it is normal CPU usage.

So, what is “normal”? Again, baselining will tell you (or your server monitoring software will). Look for sustained spikes of high CPU activity rather than short spurts. Needless to say, if your CPU is pegged at 100% for 20 minutes, that is a problem! On the other hand, if you see 90% CPU usage for short spurts of time, that may be okay. If you do find a server with CPU issues, sp_BlitzCache is helpful to track down possible problem queries. You can, sort by reads or CPU. Even better, you will get concrete suggestions to help.

If you have SQL Monitor, you can also sort the top queries by CPU time to find queries taking the most CPU time.

SQL Monitor top 10 queries screen.

One of the most insidious consumers of CPU are implicit conversions. Implicit conversions occur when SQL Server must compare two different data types, usually on a JOIN or an equal operator. SQL Server will try to figure out the “apples to oranges” comparison for you using something called data type precedence, but you will pay in CPU for SQL Server to figure this out – for every agonizing row.

Implicit conversions are not easy to see. Sometimes, the two columns in the implicit conversion have the same name, but under the covers have two different data types. Or it can be more subtle – for instance, an NVARCHAR value without the “N’” used. Worse, you won’t even always see them on execution plans unless you go through the XML, so without monitoring for them, you may never know that you have an issue with them. Yet these invisible performance killers can peg your CPU. Running sp_BlitzCache on your servers will find these and help you with them.

High numbers of recompiles can also cause CPU issues. You might encounter these when code contains the WITH RECOMPILE hint to avoid parameter sniffing issues. If you have stored procedures using WITH RECOMPILE at the top of the procedure, one thing you can try is to see if you have any other alternatives. Maybe only part of the sproc needs the recompile hint instead of the whole thing. It is possible to use the recompile hint at the statement level instead of for the entire stored procedure. On the other hand, maybe a rewrite is in order. BlitzCache will catch stored procedures with RECOMPILE and bring them to your attention.

Memory

When discussing memory issues in SQL Server, a good percentage of DBAs will immediately think of the Page Life Expectancy (PLE) metric. Page life expectancy is a measure of how long a data page stays in memory before it if flushed from the buffer pool. However, PLE can be a faulty indicator of memory performance. For one thing, PLE is skewed by bad execution plans where excessive memory grants are given but not used. In this case, you have a query problem rather than a true memory pressure issue. For another, many people still go by the dated value of 300 seconds as the low limit of PLE, which was an arbitrary measure when first introduced over twenty years ago – it should actually be much higher. How much? It depends on your baseline. If you really love PLE and rely on it as an indicator anyway, look for sustained dips over long periods, then drill down to find out their causes. Chances are that it will still be some bad queries, but the upside is that you may be able to help with that.

What other things might be causing memory pressure? Bad table architecture can be the culprit. Wide tables with fixed rows that waste space still have to be loaded (with the wasted space!) and can quickly become a problem. The fewer data pages that can be loaded at a time, the less churn you will see in your cache. If possible, try to address these issues.

While you are at it, check your max memory setting. If it is set to 2147483647, that means that SQL Server can use all the memory on the OS. Make sure to give the OS some headspace, and do not allow any occasion for SQL Server to use all the memory.

If you are using in-memory OLTP, there are additional things for you to consider. This site will help you with monitoring memory usage for those tables.

Bad indexing can be another possible issue. Here, look for page splits and fragmentation, or missing indexes. If SQL Server can use a smaller copy of the table (a nonclustered index) rather than loading the entire table into memory, the benefits become obvious!

If none of these issues apply to you (or if you find that you just do not have enough memory), you may need to throw some hardware at it. There is nothing wrong with the need for hardware, if it is the proven, best solution.

Summary

Before you can tell if your SQL Server is not performing as well as expected, you need to know what normal performance is for that server. This article covered the three main resources, disk latency, CPU, and memory that you should baseline and continue to


The post DBA in training: Know your server’s limits appeared first on Simple Talk.


from Simple Talk https://ift.tt/39U1Dei
via

Monday, December 7, 2020

Creating your first CRUD app with Suave and F#

F# is the go-to language if you’re seeking functional programming within the .NET world. It is multi-paradigm, flexible, and provides smooth interoperability with C#, which brings even more power to your development stack, but did you know that you can build APIs with F#? Not common, I know, but it’s possible due to the existence of frameworks like Suave.io.

Suave is a lightweight, non-blocking web server. Since it is non-blocking, it means you can create scalable applications that perform way faster than the ordinary APIs. The whole framework was built as a non-blocking organism.

Inspired by Happstack, it aims to embed web server capabilities into applications by providing support to components and services like Websockets, HTTPS, multiple TCP/IP bindings, Basic Access Authentication, Keep-Alive, HTTP compression, and many more.

In this article, you’ll be driven through the Suave server by developing a complete CRUD REST API.

Setting Up

Suave can be installed via NuGet Manager. However, before you can do it, you need to create a project in your Visual Studio Community Edition.

First, make sure you have the .NET Core SDK installed. If not, go ahead and install it.

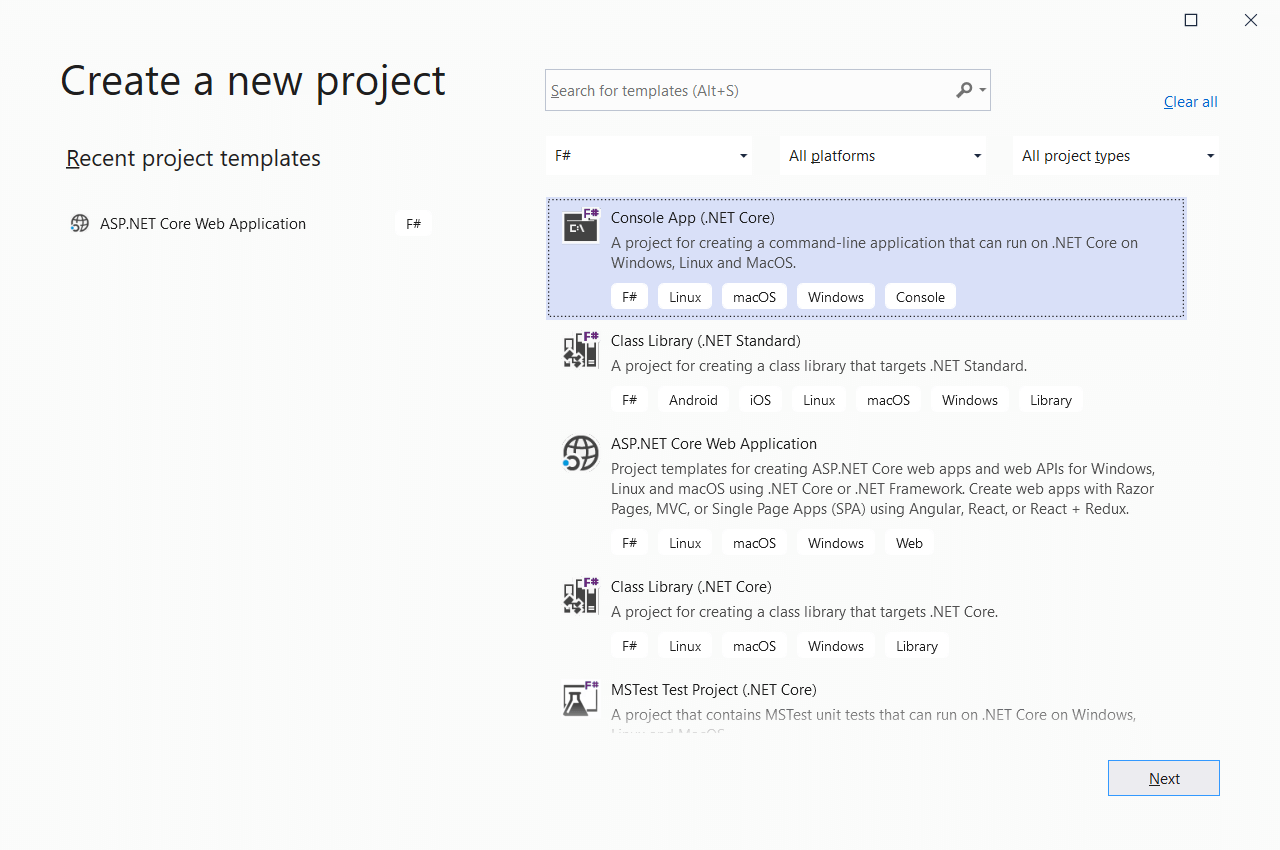
Then, open Visual Studio, go to the “Create a new project” window, and filter for F# applications, and select the option “Console App (.NET Core)” as shown in Figure 1. Click Next.

Figure 1. Creating a new F# project.

The following window will ask for a project and solution name, as well as the folder destination. Fill the fields according to Figure 2 and click Create.

Figure 2. Providing a project and solution name.

Once the project creation finishes, you’ll be able to see that only one file comes with it: the Program.fs. Within it, there’s a Hello World example in F#.

That’s a very basic structure of an F# program, but this example won’t use any of it.

Installing Suave

Before going any further, you need to set up Suave properly. The usual method recommends doing it via Paket, however, since you’re already within the Visual Studio environment, stick to NuGet.

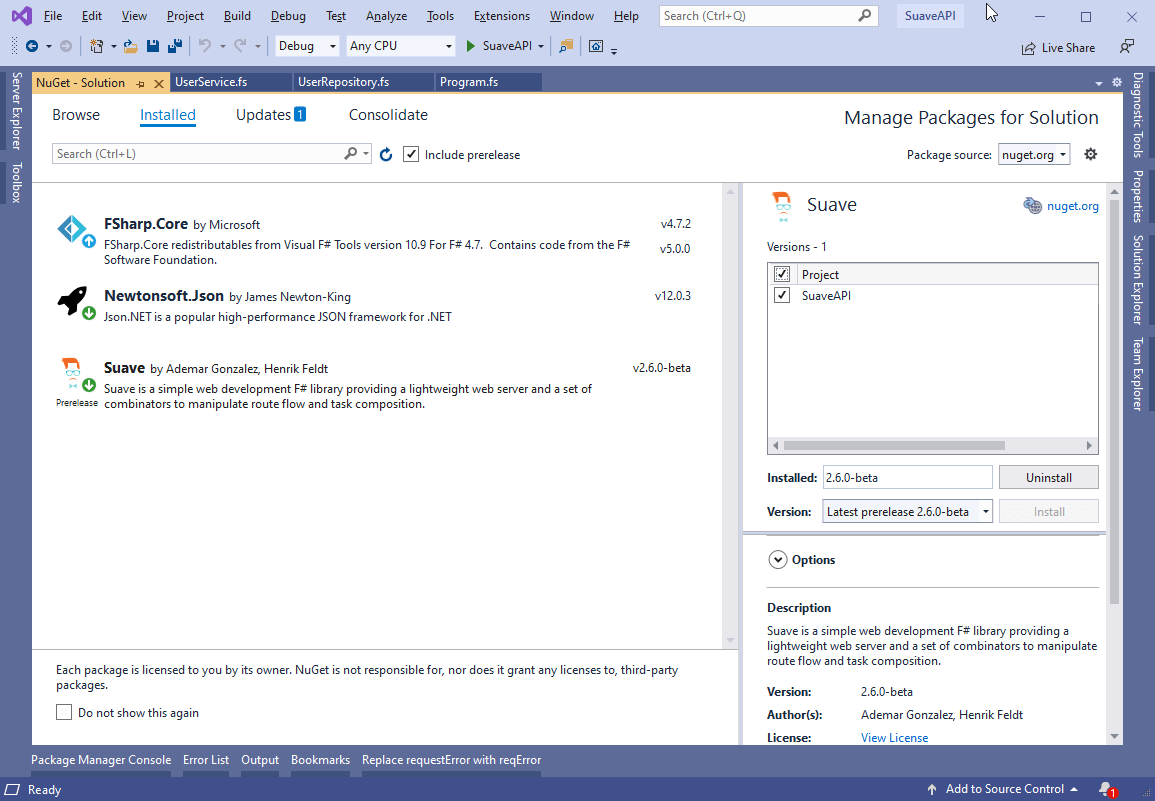
Right-click the solution and select “Manage NuGet Packages for Solution…” and browse for Suave at the search box.

Select it according to Figure 3 and click the Install button.

Figure 3. Installing Suave at NuGet.

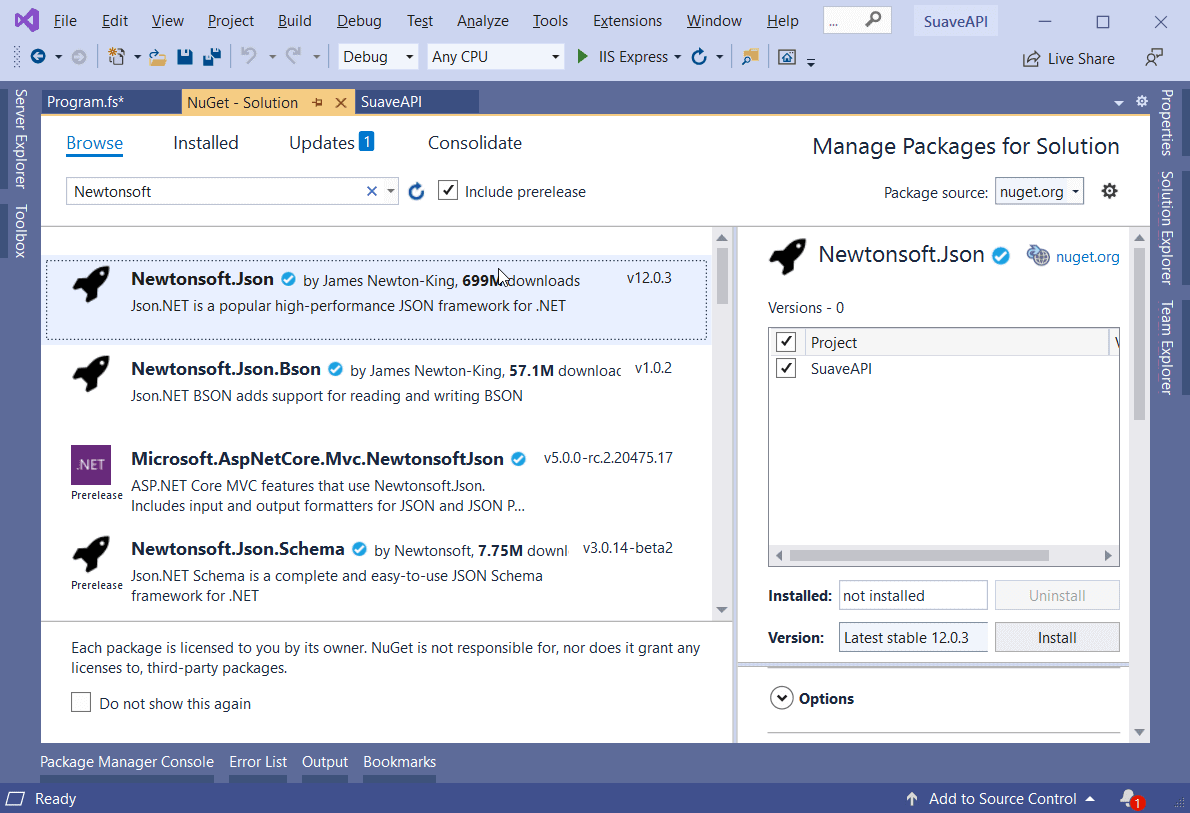
For the API construction, you’ll also need Newtonsoft’s JSON package, as it provides a handful of auxiliary methods to deal with conversions from object to JSON and vice versa.

Follow Figure 4 instructions to install it.

Figure 4. Installing Newtonsoft.Json dependency.

The Project Structure

Great! Now move on to the project building. You noticed that you already have a Program.fs file. You’ll use it as the main execution file. However, two other files are needed: one for the in-memory database operations, and the other for the service operations.

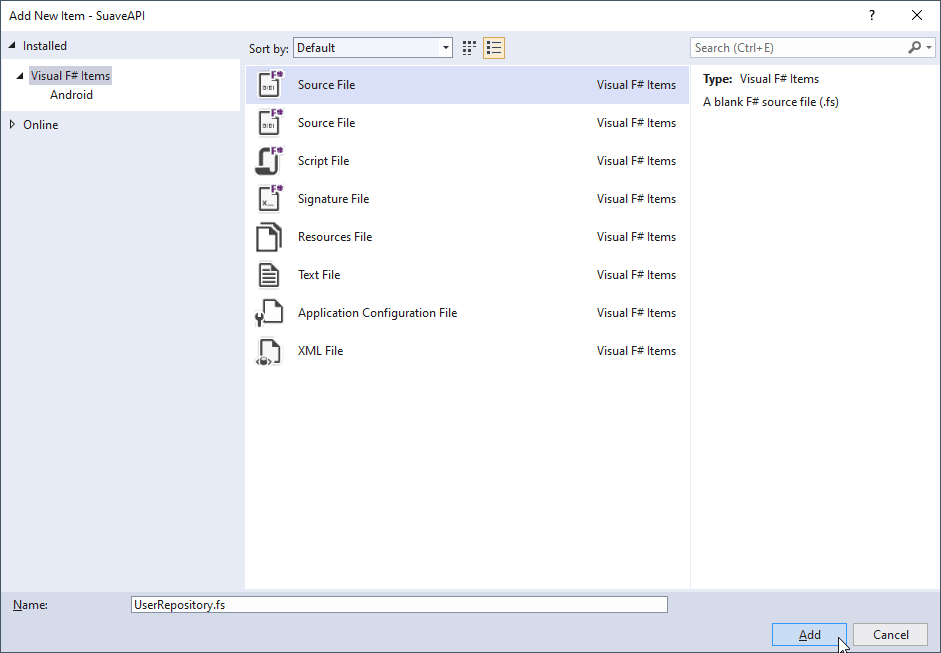
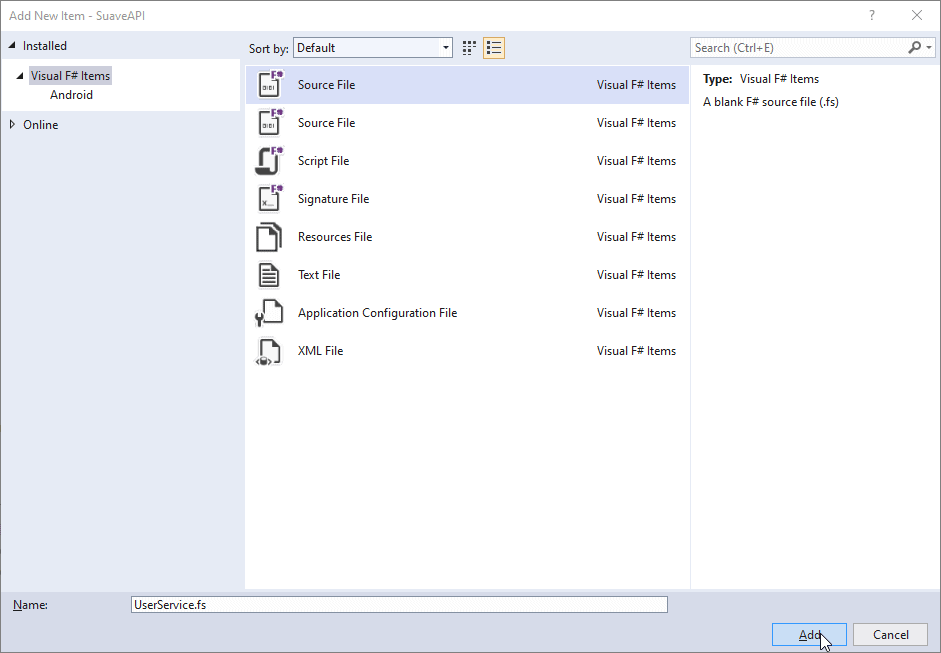
Go ahead and create both of them according to Figures 5 and 6 below.

Figure 5. Creating the user’s repository.

Figure 6. Creating the user’s service.

The Repository

First, start coding the repository since it’s the basis for the rest of the API. Take the code from Listing 1 and paste it into the UserRepository.fs file.

Listing 1. The user’s repository code.

namespace SuaveAPI.UserRepository
open System.Collections.Generic
type User =
    { UserId: int
      Name: string
      Age: int
      Address: string
      Salary: double }
module UserRepository =
    let users = new Dictionary<int, User>()
    let getUsers () = users.Values :> seq<User>
    let getUser id =
        if users.ContainsKey(id) then Some users.[id] else None
    let createUser user =
        let id = users.Values.Count + 1
        let newUser = { user with UserId = id }
        users.Add(id, newUser)
        newUser
    let updateUserById id userToUpdate =
        if users.ContainsKey(id) then
            let updatedUser = { userToUpdate with UserId = id }
            users.[id] <- updatedUser
            Some updatedUser
        else
            None
    let updateUser userToUpdate =
        updateUserById userToUpdate.UserId userToUpdate
    let deleteUser id = users.Remove(id) |> ignore

For the sake of simplicity, this project won’t make use of any physical database, so the user’s data will be stored in an in-memory Dictionary called users.

The dictionary’s keys refer to each user’s id, while the values represent the user objects.

The full repository is made of six main operations:

  • getUsers: take the dictionary and translates it into an F# sequence.
  • getUser: the method will search the dictionary for one specific user based on its id.
  • createUser: creates a new user object, certifying that the id is always going to be replaced with an auto-incremented value.
  • updateUserById/updateUser: to update a user, you first need to make sure the passed id is valid and belongs to a real user. Then, call the updateUser method which will, in turn, updates the user on the dictionary.
  • deleteUser: simply removes the user based on its id.

The Service

Now, head to the service class. Open it and add the Listing 2 contents to it.

Listing 2. User’s service code.

namespace SuaveAPI.UserService
open Newtonsoft.Json
open Newtonsoft.Json.Serialization
open Suave
open Suave.Operators
open Suave.Successful
[<AutoOpen>]
module UserService =
    open Suave.RequestErrors
    open Suave.Filters
    // auxiliary methods
    let getUTF8 (str: byte []) = System.Text.Encoding.UTF8.GetString(str)
    let jsonToObject<'t> json =
        JsonConvert.DeserializeObject(json, typeof<'t>) :?> 't
    // 't -> WebPart
    let JSON v =
        let jsonSerializerSettings = new JsonSerializerSettings()
        jsonSerializerSettings.ContractResolver 
          <- new CamelCasePropertyNamesContractResolver()
        JsonConvert.SerializeObject(v, jsonSerializerSettings)
        |> OK
        >=> Writers.setMimeType "application/json"
    type Actions<'t> =
        { ListUsers: unit -> 't seq
          GetUser: int -> 't option
          AddUser: 't -> 't
          UpdateUser: 't -> 't option
          UpdateUserById: int -> 't -> 't option
          DeleteUser: int -> unit }
    let getActionData<'t> (req: HttpRequest) =
        req.rawForm |> getUTF8 |> jsonToObject<'t>
    let handle nameOfAction action =
        let badRequest =
            BAD_REQUEST "Oops, something went wrong here!"
        let notFound = NOT_FOUND "Oops, I couldn't find that!"
        let handleAction reqError =
            function
            | Some r -> r |> JSON
            | _ -> reqError
        let listAll =
            warbler (fun _ -> action.ListUsers() |> JSON)
        let getById = action.GetUser >> handleAction notFound
        let updateById id =
            request
                (getActionData
                 >> (action.UpdateUserById id)
                 >> handleAction badRequest)
        let deleteById id =
            action.DeleteUser id
            NO_CONTENT
        let actionPath = "/" + nameOfAction
        // path's mapping
        choose [ path actionPath
                 >=> choose [ GET >=> listAll
                              POST
                              >=> request (getActionData 
                              >> action.AddUser >> JSON)
                              PUT
                              >=> request
                                      (getActionData
                                       >> action.UpdateUser
                                       >> handleAction badRequest) ]
                 DELETE >=> pathScan "/users/%d" 
                       (fun id -> deleteById id)
                 GET >=> pathScan "/users/%d" (fun id -> getById id)
                 PUT >=> pathScan "/users/%d" 
                  (fun id -> updateById id) ]

Note that the namespace at the beginning of the file is very important to make the modules available to one another. The AutoOpen annotation above the module declaration helps to expose the let-bound values of our Actions type. However, if you don’t want to use the annotation, you can remove it and directly call the Actions type via the open command.
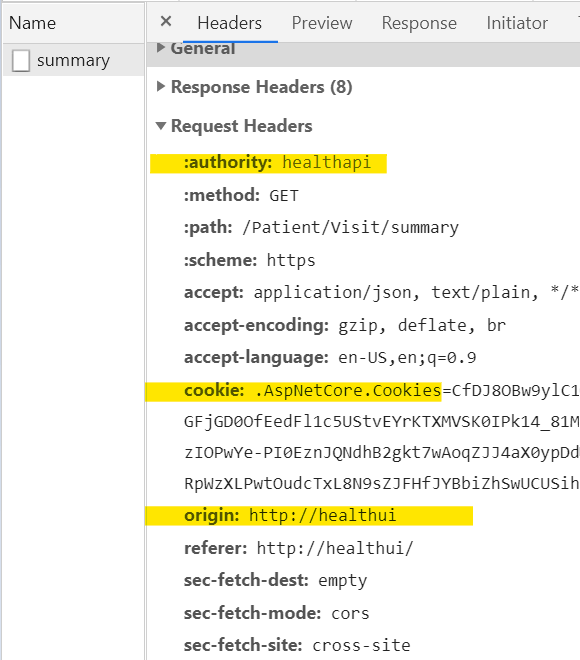
The services count on two auxiliary methods: one for extracting the UTF-8 value of a string, and the other for converting JSON to F# objects.
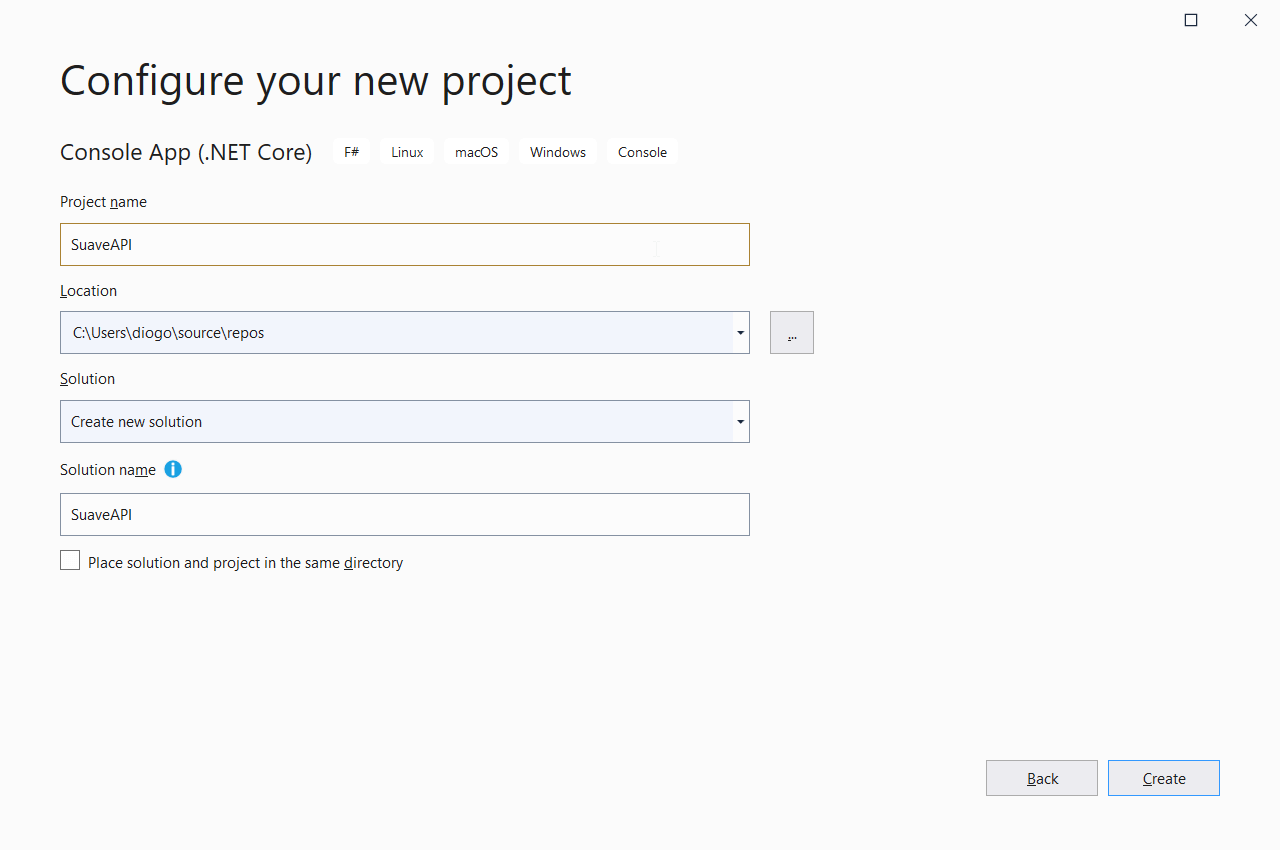
The WebPart config is essential. A WebPart function returns an asynchronous workflow which itself ultimately returns an HttpContext option. It encapsulates both request and response models and simplifies their usage, like setting the Content-Type of our responses, for example.

The Actions resource works as a container for all the API operations. This representation is excellent because it allows porting any API methods to it. If you have other domains for your API (like Accounts, Students, Sales, etc.), you can map the endpoints within other Actions and use them right away.

It all works due to the handle structure. It receives an action and its name and implicitly converts it to each service operation.

Finally, the paths are mapped at the end of the listing, through Suave’s path and pathScan features. They allow redirecting requests to specific methods, and scan path params (as you have with the update, get, and delete operations) to extract the values before processing the request.

The Program

So far, you’ve built everything the API needs to work. Now, set up the main Program F# file. For this, open the Program.fs and add the content presented by Listing 3. You’ll get a few errors, but they’ll go away when you run the program.

Listing 3. Main F# file code.

namespace SuaveAPI
module Program =
    open Suave.Web
    open SuaveAPI.UserService
    open SuaveAPI.UserRepository
    [<EntryPoint>]
    let main argv =
        let userActions =
            handle
                "users"
                { ListUsers = UserRepository.getUsers
                  GetUser = UserRepository.getUser
                  AddUser = UserRepository.createUser
                  UpdateUser = UserRepository.updateUser
                  UpdateUserById = UserRepository.updateUserById
                  DeleteUser = UserRepository.deleteUser }
        startWebServer defaultConfig userActions
        0

This one resembles a bit the previous content of Program.fs. Suave’s server is always started the same way, through the startWebServer method.

The method receives two arguments:

  • The server’s config object. If you want to go raw, just provide it with the default dafaultConfig object.
  • And the WebPart mentioned before.

The WebPart is just a representation of the Actions created within the UserService file. Make sure to call each one of the service methods accordingly.

The code must always end with a 0. The zero says to Suave that the server must stop when you shut it down; otherwise, it’ll keep running forever and locking that port.

Testing

Now it’s time to test the API. For this, you’ll make use of Postman, a great tool for API testing. Download and install it if you still don’t have it.

Then, get back to your application and execute it by hitting the Start button (Figure 7) or pressing F5.

Figure 7. Starting the application up.

It will prompt a window stating that the Suave listener has started at a specific address + port, as shown below.

Figure 8. App successfully started.

Since there’s no user registered yet, you need to create one first. Within Postman, open a new window, and fill it in according to Figure 9.

Figure 9. Creating a new user with Postman.

Make sure to select the proper HTTP verb (POST), and the option “raw” at the Body tab, as well as JSON as the data type. Provide a JSON with the user’s data, as shown in the figure and hit the Send button.

If everything goes well, you may see the newly created user coming back within the response. Now, try retrieving the same user through the GET demonstrated in Figure 10.

Figure 10. Retrieving the newly created user.

Conclusion

As a homework task, I’d ask you to test the rest of the CRUD operations and check if everything’s working fine. It’d be also great to substitute the in-memory dictionary as the database for a real one, like MySQL or SQL Server. This way, you can understand better how F# and Suave communicate with real databases.

Plus, make sure to refer to the official docs for more on what you can do with this amazing web server.


The post Creating your first CRUD app with Suave and F# appeared first on Simple Talk.


from Simple Talk https://ift.tt/39KpYTM
via