Tuesday, June 29, 2021

SQL Server performance monitor data: Introduction and usage

Windows collects a wide array of useful metrics that can be used to measure the performance of the SQL Server service. By default, this data is available but not collected or retained in SQL Server. Therefore, it falls to a developer or administrator to choose to collect and use this data for performance analysis if they don’t have a tool like SQL Monitor to do it for them. This article introduces the performance monitor view, the data contained within it and prepares the reader to build a data collection solution that uses SQL Server performance monitor data.Introducing dm_os_performance_counters

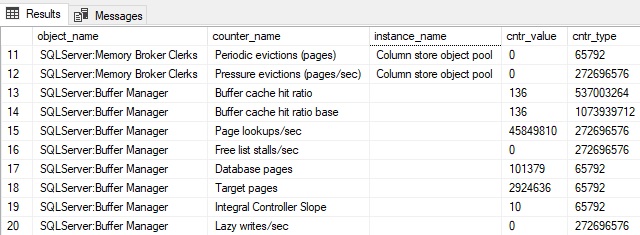
The view sys.dm_os_performance_counters will be front and center in this article, providing more information than there are pages to cover. The following is a subset of results when selecting everything from the view:

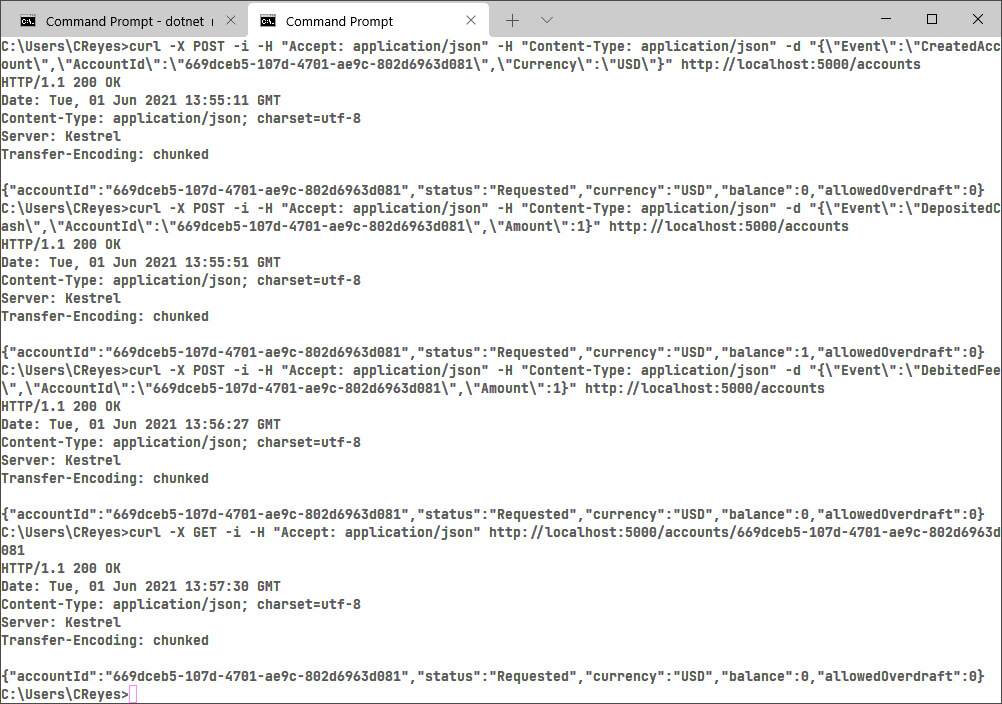
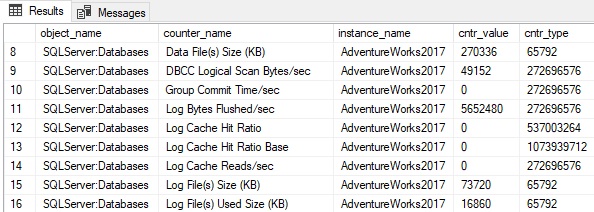
Each row represents a single performance counter and its measurement. Some are server-scoped, and others are database-scoped. A database-level performance counter will include the database name in the instance_name column, like this:

The instance_name column can contain an empty string but not NULL, so checking for a database name or other metadata is straightforward.

Cntr_value contains the current value for the performance counter.

Cntr_type is a system value that describes the type of counter. This can be useful, but once familiar with each counter and what it does, this type of column is of little value. Extensive detail on the types and what they mean can be found here:

WMI Performance Counter Types – Win32 apps | Microsoft Docs

To summarize the common counter types seen in this article and that will be typical in troubleshooting or capacity planning, the following list can be referenced:

Cntr_type

Meaning

65792

Provides a point-in-time snapshot of the last observed value. These are not averages or cumulative and can be used as-is.

272696320 & 272696576

These are cumulative values. To use these, two points in time must be compared, and the difference divided by time to calculate a metric-per-second value. These counters reset when the SQL Server service restarts.

537003264

Represents a ratio between a counter and its base. Each of these counters will have 2 values that need to be used together to calculate a meaningful result.

1073874176

Provides an average measure for an operation over time. Like 537003264, a base is provided and dividing by it is needed to obtain useful results.

1073939712

This is the base value needed for 537003264 and 1073874176

My local SQL Server 2019 test server with five databases returns 2000 rows in total from this view. Since some counters return database-level data, the number of rows returned by the view will increase as the number of databases increases.

What Can Be Measured?

The short answer is, “A LOT”. Counters are maintained and made available in SQL Server for an extensive selection of metrics. Some are common to all SQL Server installations, whereas others are associated with specific features (if they are installed/enabled).

Some of the more common objects that are useful to administrators and developers include: (Note that the heading contains the object_name, and the detail contains the counter_name)

SQLServer: Buffer Manager

The Buffer Manager measures usage of the buffer pool, telling us about memory usage, as well as the volume of data being written and read by SQL Server.

Page Life Expectancy: A measure of how long pages will remain in the buffer cache before they are removed and replaced with newer pages. When memory pressure occurs, older pages are removed from the cache more aggressively to make room for newer ones.

A decreasing value over time indicates increasing memory pressure. There is no universal target for this number, and memory expectations are different for different kinds of databases. For example, a transactional database where the same queries are executed repeatedly should have a high PLE that is stable over time. An analytic server with infrequent but large and inconsistent queries would see PLE change dramatically between quiet and busy periods.

This is an exceptionally useful metric that gains value when trended over a long period of time, both for alerting/monitoring, and for capacity planning. The number provided in the view indicates the value at the time the view was sampled:

Image showing page life expectancy SQL Server performance monitoring data

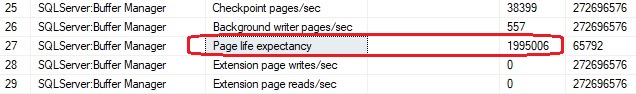
Since my local server has not recently processed any big data (and I have a lot of memory), the number is quite large. In this case, it has not experienced any memory pressure since it was restarted last, and hence a PLE of more than 23 days.

Page Reads /sec, Page Writes /sec, Page Lookups /sec, Lazy Writes /sec: Measures physical and logical reads and writes to/from the buffer cache. This provides an overall view of IO in SQL Server and the amount of IO that applications are performing against a database server. Page Reads and Page Writes indicate physical reads to/from the cache. Page Lookups measure the number of times data was requested from the cache. Lazy Writes measure the number of writes to storage outside of a checkpoint due to memory pressure.

Since physical IO is expensive, increasing numbers for physical reads can indicate memory pressure.

Since a page is 8kb, some arithmetic can describe the amount of IO on a given SQL Server. For example, if a server shows an average of 1million page reads per second and 10k page writes per second, it could be inferred that the buffer cache is servicing 7.629GB of reads per second and 78.125MB of writes per second (by dividing by 8,192 to get bytes and then converting to the storage unit of choice).

When captured over time, these metrics can describe overall trends, as well as indicate times when reads or writes are unusually high and should be investigated.

Note that all of these are cumulative counters that start at zero when SQL Server is restarted and are incremented indefinitely. To use this data meaningfully, multiple data points need to be collected and compared. This additional collection & arithmetic will be tackled later in this article.

Target Pages: This is the target number of pages that SQL Server wants to maintain in the buffer cache. Adding memory increases this number, whereas removing memory will reduce it. If the amount of data needed to regularly service queries is far greater than this number, then memory pressure will exist that will manifest in physical reads and a decreasing page life expectancy. As with other page-related data, multiplying by 8kb provides a raw amount of data. For example, on my local server, this counter currently shows:

Image showing target pages data

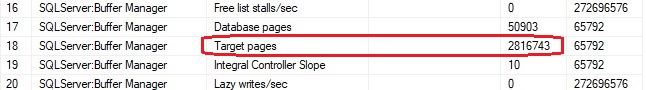
This equates to about 21.49GB of data (2816743 * 8 / (10242)

SQLServer:General Statistics

These counters provide a variety of information at the server-level, with a focus on connections and important counts that are retained by SQL Server.

Logins /sec and Logouts /sec: These track cumulative counts of logins or logouts over time. Taking the difference between two samples provides the count of logins and logouts over that time frame. The following are two samples from my local server that are taken 10 minutes apart from each other:

Image showing logins/sec and logouts/sec

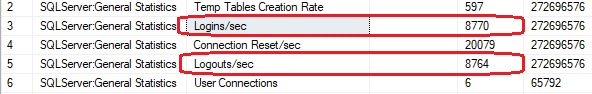
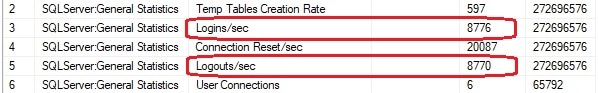
The numbers above indicate, based on subtracting the second readings from the first, that there had been six logins and six logouts during the time in between samples. Sampling these counters regularly would allow for measurements every minute/hour/day for counts of logins and logouts to SQL Server.

Temp Tables Creation Rate: This provides a running total of temporary tables and table variables created in SQL Server. This can be a handy measure to gauge if there are processes on a server that are creating an excessive number of temporary objects, and when that creation is occurring most.

Note that this counter only measures table creation and not re-use. If T-SQL creates a temporary object and proceeds to use it for many operations, only its creation will be logged. The following code samples this counter before/after a temp table is created:

SELECT
        *
FROM sys.dm_os_performance_counters
WHERE object_name = 'SQLServer:General Statistics'
AND counter_name = 'Temp Tables Creation Rate';
CREATE TABLE #test2 (id INT);
SELECT
        *
FROM sys.dm_os_performance_counters
WHERE object_name = 'SQLServer:General Statistics'
AND counter_name = 'Temp Tables Creation Rate';
DROP TABLE #test2;
SELECT
        *
FROM sys.dm_os_performance_counters
WHERE object_name = 'SQLServer:General Statistics'
AND counter_name = 'Temp Tables Creation Rate';

The results show an increment by one when the temp table is created:

Image showing the temp table creation rate

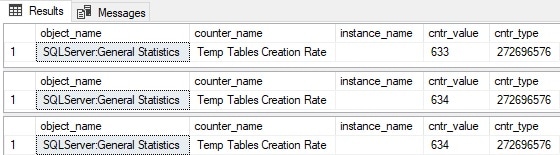
Note that dropping the temporary table had no impact on this performance counter. While expected, this is worth demonstrating.

SQLServer:SQL Statistics

These counters provide a look into query processing and can help quantify query volume across a server, as well as how execution plans are being generated for those queries.

All of the metrics below are cumulative. Therefore, multiple points in time need to be captured and compared to determine the change over time.

Batch Requests/sec: A cumulative measure of batches processed by SQL Server. As a speedy review, a batch is a collection of SQL statements executed together at the same time. This is a rough indicator of how much work SQL Server is doing overall. Expect batch requests to increase during busier times and decrease during quieter times.

Increasing batch requests over an extended period of time indicates that their source application is generating more work for SQL Server and capacity may eventually need to be updated to accommodate those changes. If capacity is not the issue, and such growth is unexpected, then increases in batch requests may indicate inefficiencies within the app that are generating more work that is needed.

This is one good metric to collect and retain for a long period of time as it provides a measure of SQL Server activity that is not directly tied to a specific resource, such as CPU, memory, or storage.

SQL Compilations/sec and SQL Re-Compilations/sec: These counters measure the activity of the query optimizer. When a query is executed for the first time, an execution plan is generated by the query optimizer that is cached and reused for future executions. In general, compilations will be high when:

  • SQL Server or an application are first started
  • When workloads change drastically
  • When memory pressure forces plans out of the cache
  • When ad-hoc queries overwhelm the execution plan cache

This is an exceptionally useful metric to collect as it measures plan cache activity independently of other system/SQL resources. Short-term increases in compilations may indicate app/server changes that generated a burst of plan cache activity whereas long-term increases typically represent an increase in ad-hoc query activity.

Recompilations occur when an existing execution plan in cache is discarded at runtime and replaced with a new plan. This can happen for a variety of reasons, such as:

  • Significant data size changes after an execution plan is first compiled.
  • A RECOMPILE hint is used
  • DDL changes to the underlying schema used in an execution plan.
  • Changes in SET options that affect execution plans

A full list of reasons can be found via this query:

SELECT
        *
FROM sys.dm_xe_map_values
WHERE dm_xe_map_values.name = 'statement_recompile_cause';

Recompilations will occur in any busy SQL Server, but should be kept low. If this number increases unexpectedly, then it’s worth investigating the cause. Increases in recompilations will ultimately result in increased CPU and slower queries as SQL Server needs to take time to generate a new execution plan rather than reuse an existing one.

Both compilations and recompilations can result from a variety of causes not discussed here, ranging from connection settings to database and server settings, or poorly written T-SQL. A deep discussion of the topic is out of scope for this article, but worth research if performance challenges are met in this area.

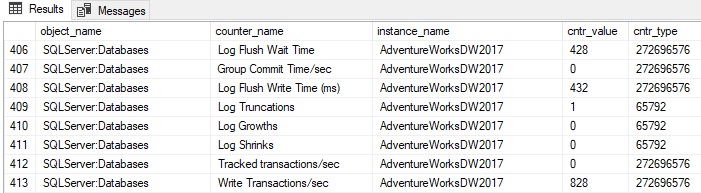
Database Counters: There is a wide variety of metrics that are collected at the database level that can provide more granular insight into server performance. Details are available about the size and usage of data/log files, transactions per second, log growths/shrinks, write transactions per second, and more. The instance_name column indicates the database name:

Image with SQL Server performance monitor counters for the database

Be sure when collecting database-scoped metrics that they are captured for only the databases of interest and are stored in a format that differentiates them from server-scoped metrics.

And More!

A discussion of every counter in dm_os_performance_counters would consume hundreds of pages and bore the reader into a stupor. Needless to say, there is a wide variety of performance counters available to collect, analyze, and use in SQL Server.

Collecting and maintaining all of them would likely be a waste of resources. Instead, choose the ones that have the most utility for a given environment. Adding or removing counters at a later time is not difficult and is a better option than trying to keep track of everything.

Performance of dm_os_performance_counters

This view derives from a pair of system tables that are not indexed. Therefore, the performance of the view will be proportional to the number of rows returned by it. The row count returned will be primarily affected by the number of databases on a server.

On my local server with 6 user databases, that count is about 2000.

On another server with 92 user databases, the row count increases to about 7700.

On another server with 665 user databases, the row count increases to about 19681.

One yet another server with 4141 databases, the row count increases to about 278000.

Querying dm_os_performance_counters is speedy (sub-second) on the first three examples above, but quite slow on the fourth. This is a factor of both row count and the computing resources available on that server.

The lesson here is to test performance prior to using this code in a production environment. Ensure that it executes quickly, and if not, consider reducing the frequency of execution so that it is not simply running nonstop all day collecting counter data. It goes without saying that the collection of server and database metrics should in no way interfere with the server that is being monitored

SQL Server Performance Monitor Data

SQL Server provides easy access to a vast array of performance counter data. It can be conveniently collected and stored directly in SQL Server and then analyzed using whatever tools of choice are available.

This provides a powerful window into server and database operations and can allow both for long-term capacity planning as well as short term altering and monitoring. Sudden drops in page life expectancy, for example, can be alerted on and additional data gathered to troubleshoot the problem. Similarly, slow long term drops in page life expectancy can be used to budget and schedule memory upgrades or code review of targeted parts of an application that have changed at the start of that time period.

The uses of this data are diverse and in the second part of this article, a process will be built that can collect and maintain this data for long-term storage and use.

The post SQL Server performance monitor data: Introduction and usage appeared first on Simple Talk.


from Simple Talk https://ift.tt/2SAC0ZL
via

DevOps is more than continuous integration and delivery

I recently presented a session about DevOps for DBAs, explaining what it is and why DBAs should care. One of the comments I received was “I thought I knew what DevOps was. Thanks to your session, now I know better.”

Here’s one definition of DevOps:

The union of people, process, and products to enable continuous delivery of value to our end users –Donovan Brown, Partner Program Manager, Azure Incubations at Microsoft

Notice that the definition doesn’t say you must use any particular toolset or prescribed methodology. The “people” are equally as important as the “processes” and “products” (tools).

You have probably heard (or said yourself) “It worked on my machine!” In a DevOps organization, everyone must be accountable for the end result – delivering customer value – not just responsibility in their domain. DBAs who are traditionally rewarded for keeping systems stable must embrace change. Developers who are traditionally rewarded for delivering functionality quickly must make sure that the changes can be safely deployed. Both sides share responsibility for stability and release tempo and must keep the end goal in mind.

DevOps is more than automating builds and deployments. DevOps requires that barriers between departments and teams are broken down. Communication, collaboration, and trust are paramount. As professionals, we often like to work independently or within our own teams even hoarding knowledge, but these silos can be broken down and replaced with cross-functional teams. DBAs can be embedded in dev teams, for example, and both sides benefit by sharing domain knowledge, information, and ideas.

DevOps is a mind shift within a company and can affect all aspects of the business. While automating infrastructure, builds, and testing is essential, DevOps means more. For example, when something goes wrong, understand the failure and learn from it; don’t assign blame. DevOps means continuously learning and continuously improving from the C-level down.

An organization can adopt DevOps because of a proclamation from management, but it can also happen via a grassroots effort. If DevOps practices are successful for a small project, word can get around, and it can eventually spread across the organization. I found the book The Phoenix Project by Gene Kim, Kevin Behr and George Spafford helpful for understanding how a company can embrace DevOps. It’s a fun fiction novel that shows how communication, trust, and cooperation are critical for DevOps.

DevOps is as much about culture and cooperation as it is about automating deployments.


Commentary Competition

Enjoyed the topic? Have a relevant anecdote? Disagree with the author? Leave your two cents on this post in the comments below, and our favourite response will win a $50 Amazon gift card. The competition closes two weeks from the date of publication, and the winner will be announced in the next Simple Talk newsletter.


The post DevOps is more than continuous integration and delivery appeared first on Simple Talk.


from Simple Talk https://ift.tt/3h2qQGo
via

Managing SQL Server transaction log size

The transaction log is a file that contains all the data modifications that are made. The size of a transaction log is impacted by the frequency of updates to a database, the recovery model, the frequency of checkpoints, and how often transaction log backups are run. Ideally, a transaction log should never need to grow because it is sized based on the database processing requirements. In reality, transaction logs grow, mainly for new databases, but sometimes even the log files of mature databases can grow. This article covers transaction log growth, how the log grows over time, and managing SQL Server transaction log size.

Sizing the transaction log

Ideally, you should size your transaction log so it will never need to grow, but in the real world, it is hard to predict how big a transaction log needs to be. Most of the time, the transaction log for a new database will be too small or too big. When it is too small, it will need to be expanded, and when it is too large, it wastes valuable disk space. Therefore, it is best to create a transaction log as big as you think it needs to be, set it up to autogrow, and then monitor it over time to see how much space it uses and how often it grows.

Transaction log growth settings

There are two settings associated with the growth of the transaction log: file growth and max file size. The file growth setting identifies how much additional space will be added to the transaction log each time it grows. Whereas, the max file size sets the upper limit on how big the transaction log can get.

File growth settings

The transaction log size can be fixed or can be set up to autogrow. A transaction log that has a fixed size will not grow when it runs out of space. When a transaction fills up the transaction log the transaction will fail with a 9002 error msg. Alternatively, you can set up the transaction log to autogrow. When the transaction log is set up to autogrow, it will grow automatically when the transaction log becomes full. There are two different settings for how the transaction log will autogrow: by percentage or by megabytes.

When the transaction log is set up to grow based on a percentage, the amount it grows is calculated based on the percentage value of the current size of the transaction log. For example, if the transaction log is currently 100 GB in size and specified to grow by 15%, then 15 GB will be added to the transaction log when it runs out of space and grows. When the transaction log is set to grow based on percentages, the amount of space added increases with each autogrowth.

Growing in percentages does not scale well as the transaction log grows larger. It doesn’t scale well because more space is allocated with each successive autogrow operation as the transaction log gets bigger. This might be fine for small transaction logs, but when the transaction logs become quite large, autogrowth based on a percentage might allocate way more space than the transaction log will ever need. In the worst-case situation, it might take up all of the disk space available, leaving no free space on the disk drive, which is usually not a good thing.

When the log file is set to autogrow based on a fixed size, the transaction log will grow the same amount each time. If a transaction log for a database is set to autogrow by a fixed amount of 10 GB, it will grow 10 GB each time it needs to grow. Using a fixed growth space setting is much more manageable than using a percentage. Therefore best practice is to grow the transaction log in a fixed amount to avoid adding more transaction log space than needed when using the percentage growth setting.

Maximum file size

The maximum file size setting for the transaction log identifies the maximum size a transaction log can be. There are two different options for maximum file size: limited and unlimited. By using limited, you can identify a maximum size the transaction log will grow. Using the limited setting allows you to make sure the transaction log doesn’t grow out of control. Once the transaction log grows to the limit, it will not grow any more, until the limit is increased. The unlimited setting allows the transaction log to grow as big as it needs to, or until it takes up all the disk space. In reality, using the unlimited setting is also a limited setting, but with a very large size, because SQL Server at this time only supports transaction logs that are 2 TB or less. If you set the maximum file size to unlimited, the maximum size for the transaction log will be set to the limiting amount of 2 TB.

Viewing or changing the file growth setting of an existing database

You can use SSMS to view the file growth settings for an existing database by reviewing the “Autogrowth/Maxsize” settings. These settings are shown in the ”Files” section of the database properties pane, by right-clicking on a database and then selecting the “Database Properties” option from context menu displayed. Figure 1 shows my SampleDB using the “In Percent” options for file growth with a “Maximum File Size” that is limited to 10 MB.

Image showing SSMS autogrowth settings

Figure 1: Database Properties pane for SampleDB

If you need to change the autogrowth setting of a database, you can do it using SSMS by adjusting the settings shown in Figure 1, and then clicking on the OK button. Alternatively, you can change the file growth settings by using TSQL.

To change the autogrowth setting for the transaction log using TSQL, you issue an ALTER DATBASE MODIFY FILE command. The FILEGROWTH, and MAXSIZE parameters are used to change the autogrowth settings. Listing 1 shows how to modify the transaction log autogrowth settings for the SampleDB database.

Listing 1: Change the autogrowth settings of SampleDB

ALTER DATABASE [SampleDB]
        MODIFY FILE
                (NAME = N'SampleDB_log', FILEGROWTH = 100MB, MAXSIZE = 200MB )
GO

Expanding Transaction Log Manually

When the transaction log is automatically expanded, any transaction that requires a write to the log will have to wait while the log is expanded. This means transactions are delayed for however long it takes to expand the transaction log. This might be a minimal amount of time if the transaction log only grows a small amount.

You might not want the transaction log to grow automatically, especially during the middle of a busy day when users issue lots of transactions. To avoid holding up transactions while the log automatically expands, you can expand the transaction log manually during some scheduled off-hours of your choice. The script in Listing 2 shows how to use TSQL to expand the transaction log.

Listing 2: Increasing log file to 12 MB

USE [master]
GO
ALTER DATABASE [SampleDB] 
MODIFY FILE ( NAME = N'SampleDB_log', SIZE = 12MB)
G

The command in Listing 2 expands the SampleDB transaction log to 12 MB by modifying the transaction log file setting using the “SIZE” parameter.

Identifying the number of VLF’s in your Transaction Log

Each time the transaction log is expanded, more virtual log files (VLFs) are created and associated with the log file. If the transaction log has been expanded over time, by small increments of disk space, then a database will have more VLFs than if the log file has been expanded by large amounts. For SQL Server 2014 and above Table 1 shows the number of VLFs that will be added depending on the amount of space added to the transaction log.

Table 1: Number of VLFs added based on Growth Size of the Transaction Log

Number of VLFs

Growth Size

1

< 1/8 the size of the transaction log

4

< 64 MB and > 1/8 the size of the transaction log

8

>= 64 MB and < 1 GB and > 1/8 the size of the transaction log

16

>= 1 GB and > 1/8 the size of the transaction log

  • Is the growth size less than 1/8 the size of the current log size?
  • Yes: create 1 new VLF equal to the growth size
  • No: use the formula above

Here’s the formula:

  • 8 VLFs from the initial log creation
  • All growths up to the log being 4.5 GB would use the formula, so growths at 1, 1.5, 2, 2.5, 3, 3.5, 4, 4.5 GB would each add 8 VLFs = 56 VLFs
  • All growths over 4.5 GB will only create 1 VLF per growth = (200 – 4.5) x 2 = 391 VLFs
  • Total = 391 + 56 + 8 = 455 VLFs

You can use the undocumented DBCC LOGINFO command to display the number of VLFs for a database. There is one row returned for each VLF. The script in Listing 3 will display the number of VLFs associated with the AdventureWorks2019 database.

Listing 3: Running DBCC LOGINFO against the AdventureWorks2019 database

USE AdventureWorks2019; 
GO 
DBCC LOGINFO () WITH NO_INFOMSGS;

The results from my copy of the database are shown in Report 1.

Report 1: Output when the script in Listing 3 is run.

Because DBCC LOGINFO is undocumented, no official documentation defines what each of these columns means. Many people have written posts that describe the columns, so I have provided the descriptions I’ve found on the internet:

  • RecoveryUnitID – Added in SQL Server 2012, current unused
  • FileID – the FileID number as found in sysfiles
  • FileSize – the size of the VLF in bytes
  • StartOffset – the start of the VLF in bytes, from the front of the transaction log
  • FSeqNo – indicates the order in which transactions have been written to the different VLF files. The VLF with the highest number is the VLF to which log records are currently being written.
  • Status – identifies whether or not a VLF contains part of the active log. A value of 2 indicates an active VLF that can’t be overwritten.
  • Parity – the Parity Value, which can be 0, 64 or 128 (see the Additional Resources section at the end of this article for more information)
  • CreateLSN – Identifies the LSN when the VLF was created. A value of zero indicates that the VLF was created when the database was created. If two VLFs have the same number then they were created at the same time, via a growth event.

Manage Transaction Log Growth by taking Backups

If you have your database set to full or bulk-logged recovery mode, you need to periodically take transaction log backups to keep the transaction log from filling up. Depending on how you have your autogrowth setting for the transaction log, the log might just keep growing based on the FILEGROWTH and MAXSIZE setting. If you never take a take transaction log backups it might grow until it reaches the MAXSIZE setting or fills up the disk drive where the transaction log lives. To removed committed transaction log records from the log, all you need to do is take a transaction log backup.

To back up the transaction log you first need to make sure you have a full backup of the database. Once the full backup has been completed, a backup the transaction log can be taken, using a TSQL command similar to the backup command in Listing 4.

Listing 4: Transaction log backup command

BACKUP LOG [MyDatabase] 
TO  DISK = N'C:\MyBackups\MyDatabase.trn' 
WITH NOFORMAT, NOINIT,  
NAME = N'MyDatabase Log Backup', SKIP, NOREWIND, NOUNLOAD,  STATS = 10;
GO

Each time I run the backup command in Listing 4, a new transaction log backup will be added to the MyDatabase.trn file, and all inactive VLF’s will be removed from the transaction log. The frequency of taking transaction log backups depend on the amount of transactions performed against a database. The more updates performed, the more frequently you should run a transaction log backup. By running the transaction log frequently enough, you might be able to keep your transaction log from growing.

Monitoring the Transaction Log Usage

In order to monitor the size of the transaction log, the team at Microsoft have provided a dynamic view named “sys.dm_db_log_space_usage”. The code in Listing 5 shows how to use this view.

Listing 5: Showing how much used log space on master database

USE master;
GO
SELECT * FROM sys.dm_db_log_space_usage;

When I run the command in Listing 5 on my instance, I get the output shown in Report 2.

Report 2: Amount of space used

By reviewing this report and looking at the used_log_space_in_percent column, you can see that just a little over 55% of my log space is used on my master database.

How to identify when an autogrowth Event Occurs

SQL Server creates an autogrowth event whenever a database file automatically grows. As of SQL Server 2005, the autogrowth events are included in the default trace. If you haven’t turned off the default trace, then the autogrowth events are simple to find, using SSMS or TSQL.

To view the autogrowth events in SSMS, right click on a database name in Object Explorer. In the context menu displayed, hover over the “Reports” item in the context menu, then move the mouse to hover over the “Standard Reports” and then select the “Disk Usage” report. Upon doing this for a database, a report similar to that shown in Report 3 will be displayed. To view the autogrowth events for the database selected, click on the “+” sign next to the “Data/Log Files Autogrowth/Autoshrink” item, as shown by the red arrow in Report 3.

Report to show autogrowth when managing SQL Server transaction log file size

Report 3: Disk Space Usage Report

Clicking the “+” sign displays any autogrowths if they have occurred. Report 3, shows the autogrowth events on my SampleDB database.

Report from default trace to show auto growth

Report 3: Autogrowth events on SampleDB

In Report 3 you can see both Log and Data autogrowth events. Using the SSMS method will show you only autogrowth events in the active file of the default trace for one database. If you want to review autogrowth events for all databases on a server, regardless of whether it is in active file of the default trace or an any of the default trace rollover files you can use a script similar to the one in Listing 6.

Listing 6: Reviewing autogrowth events in the default trace file

DECLARE @filename NVARCHAR(1000);
DECLARE @bc INT;
DECLARE @ec INT;
DECLARE @bfn VARCHAR(1000);
DECLARE @efn VARCHAR(10); 
 
-- Get the name of the current default trace
SELECT @filename = CAST(value AS NVARCHAR(1000))
FROM ::fn_trace_getinfo(DEFAULT)
WHERE traceid = 1 AND property = 2;
 
-- rip apart file name into pieces
SET @filename = REVERSE(@filename);
SET @bc = CHARINDEX('.',@filename);
SET @ec = CHARINDEX('_',@filename)+1;
SET @efn = REVERSE(SUBSTRING(@filename,1,@bc));
SET @bfn = REVERSE(SUBSTRING(@filename,@ec,LEN(@filename)));
 
-- set filename without rollover number
SET @filename = @bfn + @efn
 
-- process all trace files
SELECT 
  ftg.StartTime
,te.name AS EventName
,DB_NAME(ftg.databaseid) AS DatabaseName  
,ftg.Filename
,(ftg.IntegerData*8)/1024.0 AS GrowthMB 
,(ftg.duration/1000)AS DurMS
FROM ::fn_trace_gettable(@filename, DEFAULT) AS ftg 
INNER JOIN sys.trace_events AS te ON ftg.EventClass = te.trace_event_id  
WHERE (ftg.EventClass = 92  -- Date File Autogrow
    OR ftg.EventClass = 93) -- Log File Autogrow
ORDER BY ftg.StartTime

Knowing when, how often, and which databases have had autogrowth event occurs will help you identify when each database is growing. You can then use these time frames to determine which processes are causing your transactions logs to grow.

Managing SQL Server transaction log size

The transaction log is a journal of update activity for a database. It can be used to back out incorrect or uncompleted transaction due to application or system issues. It also can be backed up so the transaction can be used to support point-in-time restores. The transaction log needs to be managed so it doesn’t fill up. One way to keep the transaction log from filling up is transaction log backups periodically. Another way is to allow the transaction log to grow automatically as the transaction log needs additional space. DBAs must understand how the transaction is used and managed and how it supports the integrity of a database.

If you liked this article, you might also like SQL Server transaction log architecture.


The post Managing SQL Server transaction log size appeared first on Simple Talk.


from Simple Talk https://ift.tt/35Zla9R
via

Monday, June 28, 2021

Azure SQL Automation: Improving the Indexing Job

The Azure SQL Databases don’t give us access to the SQL Server Agent. Usually, we use SQL Server Agent to schedule jobs on premise, but in the cloud, we need a different solution.

In the technical sessions I deliver I usually explain about Azure Automation and how we can create runbooks to execute scheduled tasks on SQL Server.

We can start from many ready-to-use runbooks of different kinds provided for us on the Automation Gallery. We choose one, import it and start from this point.

Publishing to the Automation Gallery

These runbooks are not provided only by Microsoft. Anyone can create a repository in github and the repository will appear inside the runbook gallery.

Microsoft provided instructions about how to contribute with the Automation Gallery. We need to follow some rules, but basically it involves including one specific tag on the github repo. Azure will identify the repos with this tag and import the content of the repo to the Automation Gallery, within something like 12 or 24 hours of delay.

There is one small catch: the Automation Account supports 4 kinds of runbook, but although the instructions say it is possible, I only managed to contribute with one of the types. Considering that no one outside Microsoft ever contributed with different types as well, maybe there is something missing on the instructions.

The 4 kinds of runbook supported by the Automation Account are:

  • Powershell script
  • Graphical
  • Powershell Workflow
  • Python Script

This is the filter of the gallery inside the Automation Account:

Graphical user interface, application Description automatically generated

Python Runbook has two “sub-types”, Python 2 and Python 3. Graphical runbook can be a regular graphical one or a Graphical Powershell Workflow.

Graphical user interface, text, application, email Description automatically generated

The only kind of runbook repository we are able to create is the PowerShell script runbook. All the others are not recognized by the Gallery, at least until now no one managed to publish a different type.

Graphical user interface Description automatically generated with low confidence

The Existing Azure SQL indexing script

There is an Azure SQL indexing script created by the Azure Automation team.

This script is very interesting. These are some details:

  • It’s flexible. It has parameters to make the script very flexible, good for many different situations.
  • It checks the fragmentation to decide if it will reindex or not.
  • The fragmentation value used to decide for the reindex is parameterized.
  • We can use the script to reindex all the tables or a single one.

Unfortunately, the script has one bug: It doesn’t use the table schema in the code. This is not a small bug. Any table with a schema different than dbo will cause an error on the script.

Of course, it’s not only about dbo schema. It’s about the default schema configured for the login used to execute the script. Tables on the default schema will work, tables on different schemas will fail. But we don’t need to go so in deep on Azure SQL technical details.

The Solution – a new reindexing Runbook for Azure SQL

I made a fork and a pull request to the original github repository which contains the runbook and the code, contributing with a fix to the code.

However, the review of the pull request will take a while. In the meantime, I received permission from the developer to publish my changes in a new repository if I would like, creating a new runbook template in the gallery.

Unlike the original one, a PowerShell Workflow runbook, the one I created is recognized only as a PowerShell Runbook, but this is already enough to achieve the result.

The code of the new Runbook is this:

<#

.SYNOPSIS 

    Indexes tables in a database if they have a high fragmentation

.DESCRIPTION

    This runbook indexes all of the tables in a given database if the fragmentation is

    above a certain percentage. 

    It highlights how to break up calls into smaller chunks, 

    in this case each table in a database, and use checkpoints. 

    This allows the runbook job to resume for the next chunk of work even if the 

    fairshare feature of Azure Automation puts the job back into the queue every 30 minutes

.PARAMETER SqlServer

    Name of the SqlServer

.PARAMETER Database

    Name of the database


.PARAMETER SQLCredentialName

    Name of the Automation PowerShell credential setting from the Automation asset store. 

    This setting stores the username and password for the SQL Azure server

.PARAMETER FragPercentage

    Optional parameter for specifying over what percentage fragmentation to index database

    Default is 20 percent


 .PARAMETER RebuildOffline

    Optional parameter to rebuild indexes offline if online fails 

    Default is false


 .PARAMETER Table

    Optional parameter for specifying a specific table to index

    Default is all tables


.PARAMETER SqlServerPort

    Optional parameter for specifying the SQL port 

    Default is 1433


.EXAMPLE

    Update-SQLIndexRunbook -SqlServer "server.database.windows.net" -Database "Finance" -SQLCredentialName "FinanceCredentials"

.EXAMPLE

    Update-SQLIndexRunbook -SqlServer "server.database.windows.net" -Database "Finance" -SQLCredentialName "FinanceCredentials" -FragPercentage 30

.EXAMPLE

    Update-SQLIndexRunbook -SqlServer "server.database.windows.net" -Database "Finance" -SQLCredentialName "FinanceCredentials" -Table "Customers" -RebuildOffline $True

.NOTES

    AUTHOR: System Center Automation Team

    LASTEDIT: Oct 8th, 2014 

#>            
            
    param(            
            
        [parameter(Mandatory=$True)]            
            
        [string] $SqlServer,            
            
               
        [parameter(Mandatory=$True)]            
            
        [string] $Database,            
            
                
        [parameter(Mandatory=$True)]            
            
        [string] $SQLCredentialName,            
                    
            
        [parameter(Mandatory=$False)]            
            
        [int] $FragPercentage = 20,            
            
        [parameter(Mandatory=$False)]            
            
        [int] $SqlServerPort = 1433,            
            
                    
        [parameter(Mandatory=$False)]            
            
        [boolean] $RebuildOffline = $False,            
            
        [parameter(Mandatory=$False)]            
            
        [string] $Table            


    )            
            
    # Get the stored username and password from the Automation credential            
            
    $SqlCredential = Get-AutomationPSCredential -Name $SQLCredentialName            
            
    if ($SqlCredential -eq $null)            
            
    {            
            
        throw "Could not retrieve '$SQLCredentialName' credential asset. Check that you created this first in the Automation service."            
            
    }            


    $SqlUsername = $SqlCredential.UserName             
            
    $SqlPass = $SqlCredential.GetNetworkCredential().Password            


    $TableNames = Inlinescript {            


        # Define the connection to the SQL Database            
            
        $Conn = New-Object System.Data.SqlClient.SqlConnection("Server=tcp:$using:SqlServer,$using:SqlServerPort;Database=$using:Database;User ID=$using:SqlUsername;Password=$using:SqlPass;Trusted_Connection=False;Encrypt=True;Connection Timeout=30;")            


        # Open the SQL connection            
            
        $Conn.Open()            


        # SQL command to find tables and their average fragmentation            
            
        $SQLCommandString = @"

        SELECT a.object_id,so.name as TableName, sc.name as schemaName,avg_fragmentation_in_percent

        FROM sys.dm_db_index_physical_stats (

               DB_ID(N'$Database')

             , OBJECT_ID(0)

             , NULL

             , NULL

             , NULL) AS a

        JOIN sys.indexes AS b 

        ON a.object_id = b.object_id AND a.index_id = b.index_id

        join sys.objects so

        ON a.object_id=so.object_id

        join sys.schemas sc

        on so.schema_id=sc.schema_id

        WHERE so.type_desc='USER_TABLE'

"@            
            
        # Return the tables with their corresponding average fragmentation            
            
        $Cmd=new-object system.Data.SqlClient.SqlCommand($SQLCommandString, $Conn)            
            
        $Cmd.CommandTimeout=120            


        # Execute the SQL command            
            
        $FragmentedTable=New-Object system.Data.DataSet            
            
        $Da=New-Object system.Data.SqlClient.SqlDataAdapter($Cmd)            
            
        [void]$Da.fill($FragmentedTable)            
            
        # Return the table names that have high fragmentation            
            
        ForEach ($FragTable in $FragmentedTable.Tables[0])            
            
        {            
            
            Write-Verbose ("Table Object ID:" + $FragTable.Item("object_id"))            
            
            Write-Verbose ("Fragmentation:" + $FragTable.Item("avg_fragmentation_in_percent"))            


            If ($FragTable.avg_fragmentation_in_percent -ge $Using:FragPercentage)            
            
            {            
            
                # Table is fragmented. Return this table for indexing by finding its name            
            
                $result=$FragTable.Item("schemaName")  + "." + $FragTable.Item("TableName")            
            
                $result                            
            
            }            
            
        }            
            
        $Conn.Close()            
            
    }            
            
    # If a specific table was specified, then find this table if it needs to indexed, otherwise            
            
    # set the TableNames to $null since we shouldn't process any other tables.            
            
    If ($Table)            
            
    {            
            
        Write-Verbose ("Single Table specified: $Table")            
            
        If ($TableNames -contains $Table)            
            
        {            
            
            $TableNames = $Table            
            
        }            
            
        Else            
            
        {            
            
            # Remove other tables since only a specific table was specified.            
            
            Write-Verbose ("Table not found: $Table")            
            
            $TableNames = $Null            
            
        }            
            
    }            
            
    # Interate through tables with high fragmentation and rebuild indexes            
            
    ForEach ($TableName in $TableNames)            
            
    {            
            
      Write-Verbose "Creating checkpoint"            
            
      Checkpoint-Workflow            
            
      Write-Verbose "Indexing Table $TableName..."            


      InlineScript {            


        $SQLCommandString = @"

        EXEC('ALTER INDEX ALL ON $Using:TableName REBUILD with (ONLINE=ON)')

"@            
            
        # Define the connection to the SQL Database            
            
        $Conn = New-Object System.Data.SqlClient.SqlConnection("Server=tcp:$using:SqlServer,$using:SqlServerPort;Database=$using:Database;User ID=$using:SqlUsername;Password=$using:SqlPass;Trusted_Connection=False;Encrypt=True;Connection Timeout=30;")            


        # Open the SQL connection            
            
        $Conn.Open()            
            
        # Define the SQL command to run. In this case we are getting the number of rows in the table            
            
        $Cmd=new-object system.Data.SqlClient.SqlCommand($SQLCommandString, $Conn)            
            
        # Set the Timeout to be less than 30 minutes since the job will get queued if > 30            
            
        # Setting to 25 minutes to be safe.            
            
        $Cmd.CommandTimeout=1500            
            
        # Execute the SQL command            
            
        Try             
            
        {            
            
            $Ds=New-Object system.Data.DataSet            
            
            $Da=New-Object system.Data.SqlClient.SqlDataAdapter($Cmd)            
            
            [void]$Da.fill($Ds)            
            
        }            
            
        Catch            
            
        {            
            
            if (($_.Exception -match "offline") -and ($Using:RebuildOffline) )            
            
            {            
            
                Write-Verbose ("Building table $Using:TableName offline")            
            
                $SQLCommandString = @"

                EXEC('ALTER INDEX ALL ON $Using:TableName REBUILD')

"@                          
            
                # Define the SQL command to run.             
            
                $Cmd=new-object system.Data.SqlClient.SqlCommand($SQLCommandString, $Conn)            
            
                # Set the Timeout to be less than 30 minutes since the job will get queued if > 30            
            
                # Setting to 25 minutes to be safe.            
            
                $Cmd.CommandTimeout=1500            
            
                # Execute the SQL command            
            
                $Ds=New-Object system.Data.DataSet            
            
                $Da=New-Object system.Data.SqlClient.SqlDataAdapter($Cmd)            
            
                [void]$Da.fill($Ds)            
            
            }            
            
            Else            
            
            {            
            
                # Will catch the exception here so other tables can be processed.            
            
                Write-Error "Table $Using:TableName could not be indexed. Investigate indexing each index instead of the complete table $_"            
            
             }            
            
        }            
            
        # Close the SQL connection            
            
        $Conn.Close()            
            
      }              
            
    }            
            
    Write-Verbose "Finished Indexing"

These are the main differences between this new script and the original one:

  • The original one is a powershell workflow, while the new one is only a powershell script, because the gallery doesn’t recognize workflows runbooks.
  • The new script changed the SQL query to include the sys.schema DMV, making the correct joins to retrieve the table schema
  • The retrieved schema is concatenated with the table name to build the name which will be used during the reindexing.

Conclusion

The Azure Automation Account is a great feature to schedule tasks on Azure SQL and all other Azure services. The fact we can contribute to this feature building runbooks templates on github and offering them to the entire community makes this feature even better.


The post Azure SQL Automation: Improving the Indexing Job appeared first on Simple Talk.


from Simple Talk https://ift.tt/3h7vYI4
via

Functional monads in C#

Monads are foundational in functional programming. In recent years, C# as a programming language has embraced functional features such as pattern matching, LINQ, and lambda expressions. The evolution of this language from classic OOP to a more functional paradigm is definitely worth exploring via elevated data types like monads. In this take, I will explore functional monads in C# via a REST API.

The implementation will adhere to functional programming principles like immutability and expression-based code. This means the entire business logic uses expressions instead of imperative constructs like the conditional if statement. The code remains fluent, so it is possible to dot into multiple expressions without much effort. In the end, I hope you see a new way of looking at problems while remaining right at home and using the already familiar C# type system.

I will assume a firm grasp of generics, OOP principles like inheritance and encapsulation, and delegates. A good solid understanding of the delegate type Func<>, for example, will come in handy. If all this is new to you, I recommend learning those concepts first before diving into functional programming in C#.

The API attempts to solve a real-world banking solution with error handling, retries, and account validation. Of course, no demo code will ever match an actual solution that serves real customers, but this comes close enough to prove the paradigm works and is worth looking into.

Feel free to check out the sample code, which is up on GitHub. I highly encourage cloning the repo, running unit tests, setting a breakpoint, and running the code. It is the best way to pick up new C# skills.

Go ahead and download the latest .NET 5 version if you don’t have this already because this uses the latest C# 9 features. The sample code uses a MongoDB backend to persist account data. MongoDB is lightweight, and a full install only takes up about a few hundred megabytes, so I recommend having an instance running on local. There isn’t enough room here to put a step-by-step guide on how to set up MongoDB, but there are plenty of guides on their website to get a windows service up and running, assuming it runs on Windows 10.

I will reference the code on GitHub quite heavily and will not attempt to make this a tutorial since there is too much code. My goal is to show you how monads work in the real world, not how to set up a project and put using statements. There will be chunks of code that will not be shown so you are encouraged to explore the code further in the GitHub repo.

These are the dependencies added to the project:

  • MongoDB.Driver: talks to MongoDB via a fluent API; I put a wrapper around this to make it testable
  • LanguageExt.Core: C# language extension methods and prelude classes that unleash monads; I opted for the beta version because this has some really cool features like automatic retries
  • MediatR: mediator implementation in .NET with query-command segregation; fits the functional paradigm quite nicely

What are monads?

Monads elevate basic C# types and unlock functional patterns. This is what allows doting into expressions while remaining inside the abstraction. Think of monadic types as containers that hold any generic type. As long as the container holds the data type, it is possible to chain as many expressions as necessary.

The following unit test illustrates:

void Bind() =>
  Assert.Equal(
    5,
    Optional(1)
      .Bind<int>(o => o + 2)
      .Bind<int>(o => o + 2)
  );

The Bind<> method is chainable via a dot and is a must in monads because every monad is composable via Bind. The chain of expressions drives the logic, and everything stays within the abstraction. Optional returns Option<int>, a monadic type containing a basic int, and it is chainable for as long as possible. Monads must also have a way to return the contained type so notice how the test compares the result with a plain int type of 5. The delegate parameter in Bind is of type Func<A, Option<B>>, meaning it takes in a generic type A already in the container and outputs another monad that contains type B.

The LanguageExt.Core library has static methods like Optional via a prelude static using statement. Bringing in the static LanguageExt.Prelude namespace allows any monadic type to be initialized.

A more generic but less powerful pattern is a functor. Monads must have a Bind, and functors must have a Map.

This is how to break out of the monad container via a functor:

void Map() =>
  Assert.Equal(
    "1",
    Optional(1)
      .Map(o => o.ToString(CultureInfo.InvariantCulture))
  );

Think of a Map like Select in LINQ. The example calls a delegate that returns a projection of the contained data type while unwrapping the monad. In this call, the delegate type is Func<int, string> and does not return an elevated data type.

The Option monad is a great place to start learning about functional programming because it encapsulates a ubiquitous programming challenge: whether a type is set to Some<A> or None. Functional programming principles eliminate null, so instead of returning null, it must return a value, in this case, None. This container deals automatically with default or null values and is one reason why it is good to stay within the elevated type for as long as possible.

Classic OOP, technically, has been lying this whole time with APIs that return null. Strictly speaking, a null is not an object but the lack of an object. Returning null is like selling street mangos by making them optional and then telling consumers you never intended to carry any! This is an area where OOP and the functional paradigm start to merge to come up with honest APIs that are predictable and have valid return types.

An interesting behavior with monadic data types is Bind which allows chaining even when everything returns None:

void BindBehavior() =>
  Assert.Equal(
    None,
    Optional(1)
      .Bind<int>(o => o + 2)
      .Bind<int>(_ => None)
      .Bind<int>(_ => 1)
  );

As soon as the logic shorts, it escapes the chain of expressions and simply returns None. This allows fluent code that reads much like plain English, and everything after None does not even execute. This keeps the API flow honest because it is a contradiction to have None and then Some simultaneously.

In contrast, the applicative pattern does the complete opposite because it runs everything and collects the results. This pattern fits perfectly in validation logic that needs to sum up a list of errors. The Apply functional pattern is less generic but more powerful than a functor via Map and less powerful than a monad via Bind.

Containers can be boxes inside other boxes

The following illustrates:

void ApplyValidationFail() =>
  Assert.Equal(
    "[fail_1, fail_2]",
    (
      Success<string, Option<int>>(3),
      Fail<string, Option<int>>("fail_1"),
      Success<string, Option<int>>(3),
      Fail<string, Option<int>>("fail_2")
    )
    .Apply((a, b, c, d) =>
      from w in a
      from x in b
      from y in c
      from z in d
      select w + x + y + z)
    .FailToSeq()
    .ToString()
  );

Be sure to bring in the static namespace LanguageExt.Prelude so Option, Success, and Fail are available. The Apply collects all validation results found in a, b, c, and d. Then, it sums up the result via a chain of monads using Bind. LINQ makes this code more readable with from … select. If this is surprising, it is because monads can declare a SelectMany<B, C> method that does both the bind and subsequent projection using functional composition. What’s nice is that this LINQ statement has the exact same behavior as the example shown earlier. If anything shorts the logic via None, it quits early and does not continue execution. In this example, the validation collects errors in FailToSeq and turns the array into a string.

To show how both the monadic and applicative patterns behave, look at two examples where one fails, and one succeeds:

void ApplyValidationNone() =>
  Assert.Equal(
    None,
    (
      Success<string, Option<int>>(3),
      Fail<string, Option<int>>("fail_1"),
      Success<string, Option<int>>(3),
      Fail<string, Option<int>>("fail_2")
    )
    .Apply((a, b, c, d) =>
      from w in a
      from x in b
      from y in c
      from z in d
      select w + x + y + z)
    .Match(
      Succ: o => o,
      Fail: _ => None
    )
  );

void ApplyValidationSome() =>
  Assert.Equal(
    8,
    (
      Success<string, Option<int>>(3),
      Success<string, Option<int>>(1),
      Success<string, Option<int>>(3),
      Success<string, Option<int>>(1)
    )
    .Apply((a, b, c, d) =>
      from w in a
      from x in b
      from y in c
      from z in d
      select w + x + y + z)
    .Match(
      Succ: o => o,
      Fail: _ => None
    )
  );

Ultimately, what drives the logic isn’t the validation container defined as Validation<string, Option<int>> but the Match at the end of the chain of expressions. A Match essentially acts like a fork and only executes a single path depending on the state of the container. If validation passes, it sends back the Option<int>. If not, it returns None. This is a nice way to unwrap the monadic type and simply return a value when the chain of expressions is done.

The last point I want to make is this, look at the validation type once more. It cares about two things, the failure, which is a list of strings, and the valid result which is another monad. Yes, much like Russian nesting dolls, containers can have other containers inside as long as the data type closely models the logic.

In functional programming, smart data types over dumb algorithms are what drives the main logic, as opposed to OOP, where smart algorithms with dumb or anemic types do most of the work. This is one key differentiator because imperative code thrives with dumb types via if statements and for-loops, whereas expressions need to dot into a chain of objects that are much more capable. This makes Bind so powerful because it can compose a long chain of expressions that encapsulate the bulk of the logic.

Enough simple theory with makeshift monadic types, it’s time to throw these same patterns and techniques into a real API.

Grabbing monadic accounts off the database

I opted to use a real database like MongoDB, instead of an in-memory one, because I can then throw asynchrony and error handling at this. Gladly enough, there is a monad in LanguageExt that encapsulates all these requirements: TryOptionAsync. This has the already familiar None and Some, has a Fail state, and it is awaitable like Task<>.

This capability is exactly what I mean by smart data types; you start with the problem at hand then pluck the type that models the solution most closely. This TryOptionAsync<A> container encapsulates everything necessary to build a repository that has a bank account state with plenty of niceties.

If you ever find yourself in a bind, so to speak, it is best to step back and examine the type because it might be working against you.

To get a single account from the database via a monad:

TryOptionAsync<AccountState> GetAccountState(Guid id) =>
  TryOptionAsyncExtensions.RetryBackOff(
    TryOptionAsync(() => _stateDb.FindAsync(a => a.AccountId == id)),
    100);

The RetryBackOff is a nice extra feature with the beta version of this library. It attempts to fire the lambda expression inside TryOptionAsync<AccountState>, and if this fails, it automatically retries. The default setting is 3 retries before bombing out and returning a Fail state. This supports backing off, so the next retry time is doubled, for example, 100, 200, and 400 milliseconds. Even if the MongoDB service is down, it will timeout at the default 30 seconds, connection timeout; it will then attempt to reconnect at least thrice.

Because functional programming has data types that are immutable, they have no side effects. Automatic retries is an added feature that naturally flows from being side-effect free, which allows building robust solutions with high availability.

Asynchrony is another bit of complexity that gets abstracted away with this monad. For the most part, async/await will no longer need to be sprinkled all over the code. The monadic type also implements async correctly via ConfigureAwait(false) and whatnot, so this is doing a lot of the heavy lifting within the container.

I put the database query inside a wrapper so it is testable. This enables unit testing of the nomadic type that comes out of the db repo:

async Task GetAccountState()
{
  _stateDb
    .Setup(m => m.FindAsync(
      It.IsAny<Expression<Func<AccountState, bool>>>(),
      null))
    .ReturnsAsync(AccountState.New(Guid.NewGuid()));

  var result = await _repo.GetAccountState(Guid.NewGuid()).Try(); // Try

  Assert.True(result.IsSome);
}

The logic in the system under test, which is the account repo, is almost trivial. The point here is that monads work well with mocks too. The result that comes out of the repository is a monadic type that supports the property IsSome to verify the container has at least account info in it. Take a close look at Try because this unwraps the container and returns an OptionalResult<AccountState> that has Some or None. The Try expression encapsulates a try/catch and handles errors automatically.

I recommend exploring the rest of this GET endpoint in the GitHub repo. Start in Bank.Data and if you are so bold bust open the GetAccountByIdHandler in Bank.App.Queries. There is even validation to guarantee the id, which is a string in the request, is always a legit Guid.

HTTP status codes with monads

The AccountResponse is a namespace alias that encapsulates the monadic container. This is the data type that has the state of the overall API HTTP response.

using AccountResponse = LanguageExt.Validation<
  Bank.App.Validators.ErrorMsg,
  LanguageExt.TryOptionAsync<Bank.App.Accounts.AccountViewModel>>;

Much like shown earlier with nested types inside a validation container. This elevated type has ErrorMsg to capture a failure, and the view model wrapped around the TryOptionAsync.

Turns out, this very same validation container is useful when handling HTTP responses:

Task<IActionResult> ToActionResult<T>(
  this Validation<ErrorMsg, TryOptionAsync<T>> self) =>
  self.Match(
    Fail: e => Task.FromResult<IActionResult>(
      new BadRequestObjectResult(e)),
    Succ: valid => valid.Match<T, IActionResult>(
      Some: r => new OkObjectResult(r),
      None: () => new NotFoundResult(),
      Fail: _ => new StatusCodeResult(
        StatusCodes.Status500InternalServerError)
    )
  );

The Match drives the response logic and only executes a single path depending on the state of the container. Match also unwraps the monad container and returns Task<IActionResult> which is what the ASP.NET controller wants.

If validation fails, it is a 400 Bad Request response. If there are errors while talking to MongoDB, it is a 500 Internal Server Error. Also, if no account data was found, a 404. Because the elevated type models the problem so well, the code solution appears simple on the surface. Therefore, it is always a good idea to put more thought into design than cranking out a code solution that requires a lot of complexity and elbow grease.

Because ToActionResult is an extension method, the unit test becomes even easier to write without crazy mocks or anything:

async Task ToActionResultOk() =>
  Assert.NotNull(
    await Success<ErrorMsg, TryOptionAsync<AccountViewModel>>(
      TryOptionAsync(AccountViewModel.New(
        AccountState.New(Guid.NewGuid()))))
      .ToActionResult()
    as OkObjectResult
  );

Here I only test the happy path, but you can verify every nook and cranny. A more complete suite of tests can be found in the GitHub repo.

A bit of pattern matching

The POST endpoint takes in an AccountTransaction with a transaction event that makes a mutation to the account. This will do an upsert to the account state and keep an account event trail to track individual transactions.

A switch expression is useful to figure out where the logic splits:

Task<AccountResponse> Handle(
  AccountTransaction request,
  CancellationToken cancellationToken) =>
  request.Event switch
  {
    TransactionEvent.CreatedAccount => CreatedAccount(request),
    TransactionEvent.DebitedFee => DebitedFee(request),
    TransactionEvent.DepositedCash => DepositedCash(request),
    _ => InvalidTransactionEvent()
  };

This app currently supports account creation, deposits, and withdrawals. Any unsupported transactions automatically fail, and nothing else executes.

Account creation is somewhat straightforward because it only validates the account id, and account currency since those must be valid. There is an extension method AccountMustNotExist that fails the request on already existing accounts. Open up AccountTransactionHandler under Bank.App.Accounts.Commands to take a peek.

The most complex transaction is the DebitedFee because it has more validations:

Task<AccountResponse> DebitedFee(AccountTransaction request) =>
  (IsValidGuid(request.AccountId), request.AmountMustBeSet())
    .Apply((id, trans) =>
      _repo.GetAccountState(id).AccountMustExist()
        .Bind(acc => acc.HasEnoughFunds(trans.Amount)) // current state -> acc
        .Bind<TryOptionAsync<AccountViewModel>>(acc =>
          PersistAccountInfo(
            acc.Debit(trans.Amount), trans.ToDebitedEvent())))
    .Bind(resp => resp)
    .AsTask();

The logic remains fluent while simply dotting into the next expression. The Apply acts on a tuple with a list of validations that run even if any fail. The applicative pattern guarantees that all validations execute without quitting early and collects a list of failures.

First, validate the request. If valid, get the account state off the repo using a legit id and validate that it exists in the database via AccountMustExist. Remember the Bind behavior when there is a failure somewhere up in the chain? That’s right, not having enough funds in HasEnoughFunds fails the transaction, and nothing else happens.

Then, dot into persisting the new state and unwrap then wrap it around a Task<>. Because this validates in two places, the unwrapping at the end via Bind nukes the extra Validation<ErrorMsg, AccountResponse> container to just AccountResponse, which already has a Validation. The AsTask is necessary because the mediator implementation requires a Task even though the monad is already async. A bit of a wrinkle when dealing with containers with boxes inside other boxes but expressions keep the unwrapping code minimal.

Persist AccountState and AccountEvent

The PersistAccountInfo grabs the current account state of the database in acc, takes a valid request via trans that comes out of the validated request, and a pplies the mutation that returns a new state and stores both account state and the event in the database.

The following implements this:

TryOptionAsync<AccountViewModel> PersistAccountInfo(
  AccountState state,
  AccountEvent accountEvent) =>
  from st in _repo.UpsertAccountState(state) // new state -> st
  from _ in _repo.AddAccountEvent(accountEvent)
  select AccountViewModel.New(st);

The from … select comes in handy to chain these expressions via Bind. If the upsert fails for any reason, the event is never recorded. The view model in the HTTP response comes from the select because it has the latest persisted state in MongoDB.

Once the state mutates, and it is successfully persisted, there is a way to guarantee an account event gets recorded via a retry:

TryOptionAsync<Unit> AddAccountEvent(AccountEvent accountEvent) =>
      TryOptionAsyncExtensions.RetryBackOff(
        TryOptionAsync(() => 
                 _eventDb.InsertOneAsync(accountEvent).ToUnit()),
        100,
        5);

Much like a FedEx truck that guarantees delivery of the package, t his is identical to the code shown earlier when it grabs the account in the GET endpoint with one small difference. Instead of returning void, return Unit. Functional programming must have at least one return value. A Unit is basically a discard which is exactly what the from in LINQ did with this using an underscore.

There are other alternatives to guarantee an event gets recorded, such as dropping messages in a queue or wrapping both calls in a single db transaction, but monadic retries felt like a good enough approach.

To test GET/POST endpoints via curl, run the Banking app (Bank.Web project), then check out the readme in the GitHub repository. Here, I will show some quick tests:

Image showing code test using monads in c#

Functional monads in C#

C# has come a long way from its humble beginnings since its first release, which was heavily biased towards OOP. The elegant type-system, generics, lambda expressions, pattern matching, and LINQ turn this general-purpose language into a functional programming juggernaut.

So far, I have been pleasantly surprised at the level of ease with which monads blend into the language. Of course, these patterns and ideas are still experimental, but my hope is it won’t take long for these techniques to be incorporated in .NET proper.

If you liked this article, you might also like Build a REST API in .NET Core.

The post Functional monads in C# appeared first on Simple Talk.


from Simple Talk https://ift.tt/2UCHrb4
via