I was recently working in a SQL Server health check assessment, and the scenario I was investigating made me re-evaluate what I knew about performance counters SQL Compilations/sec, Cache Hit Ratio and the relation of those to Batch Requests/sec.
Consider the following scenario:

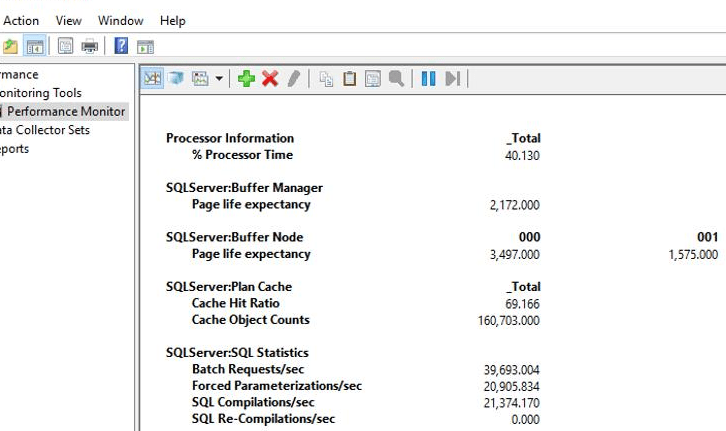
As you can see, the number of SQL Compilations/Sec is very high. It’s important to step back and remember the general description and guideline for this counter and understand what I mean by “high”:
Official Description: “Number of SQL compilations per second. Indicates the number of times the compile code path is entered.”
A typical description: “The number of times that Transact-SQL compilations occur, per second (including recompiles). The lower the value the better. Each compilation uses CPU and other resources, so SQL Server will attempt to reuse cached execution plans wherever possible. Not having to recompile the stored procedure reduces the overhead on the server and speeds up overall performance.”
Guidelines:
- Guideline from Red-Gate’s SQL Monitor tool: “In general, Compilations/sec should be less than 10% of the Batch requests/sec. High values often indicate excessive adhoc querying and should be as low as possible.”
- Guideline from Brent Ozar: “In a transactional system, I expect to see 90% (or higher) query plan reuse – so Compilations/sec should be 10% (or less) of the Batch Request/sec measure.”
Consider the “10% of batch requests/sec guideline”. The counters show 21374 compilations/sec and 39693 batch requests/sec, (21374/39693) * 100 = 54%. Considering the 10% guideline, 54% looks like a very high number.
Another thing that caught my attention is the low value (69%) of “Plan Cache Hit ratio” (Ratio between cache hits and lookups.). The general description for this counter is: “how frequently a compiled plan is found in the plan cache (therefore avoiding the need to compile or a recompile)”. A good guideline is: “the closer this number is to 100%, the better.”
Note: There are other things that I could highlight like, plan cache counts is close to the default limit of 160,036 entries in a 64 bits system.
As always, it is a good practice to ask why. Why those guidelines? Why is evaluating those counters important? Why is plan cache reuse important?
SQL Server plan cache – Compilation and optimization phases
Query plan compilation and optimization are known to be CPU-intensive operations; therefore, SQL Server will attempt to reuse cached execution plans wherever possible. Not having to compile (or recompile) and optimize a statement reduces the overhead on the server and speeds up overall performance. This is the main reason to review the counters I mentioned before.
Notice that I mentioned “compilation” and “optimization.” Those are two different things and are part of the execution plan creation process. Although the cost of a compilation is not low, the optimization phase usually uses more CPU.
In environments with ad hoc intensive workloads, the analysis of performance counter numbers and CPU overhead cost may get tricky (more on that in the “plan cache for ad hoc queries session” of this article). Because of that, it is important to identify the query execution workload. The query plan cache reuse and query execution workload may be one of the following:
- Ad hoc queries
- Auto parameterized queries
- Forced parameterized queries
- Ad hoc with forced parameterized queries
- Prepared queries using either
sp_executesql or the prepare and execute method invoked through the data access API (ADO.NET, OLE DB, ODBC, JDBC and etc.)
- Stored procedures or other compiled objects (triggers, TVFs, etc.)
One way to identify the workload is to look at the SQL compilations/sec counter and its relation to the batch requests/sec. In general, the higher the number of compilations/sec in relation to the batch requests/sec, the more likely the environment is experiencing an ad hoc workload.
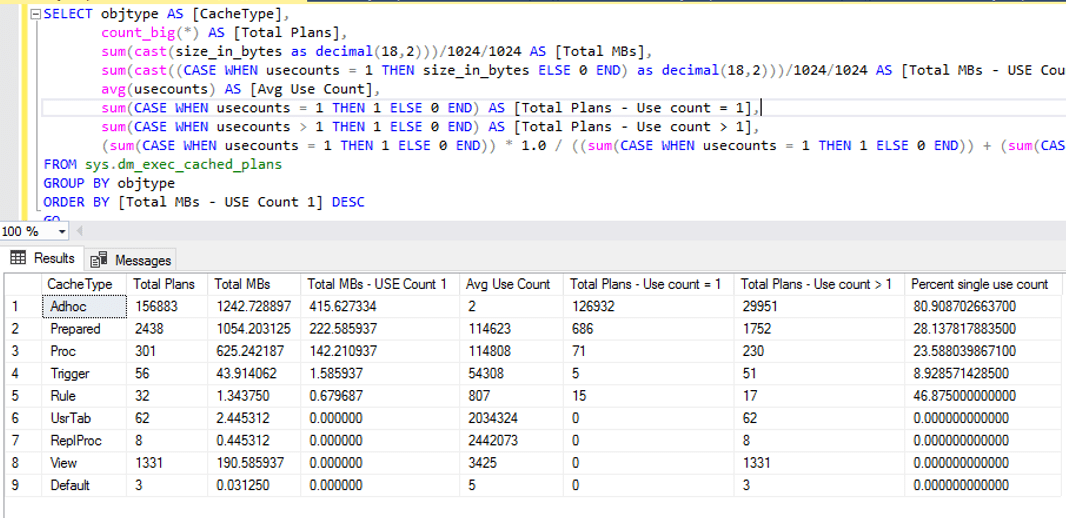
Another quick option to check the workload is to look at sys.dm_exec_cached_plans DMV. For instance, shown in the following image (script based on Erin’s script), the number of ad hoc plans with only one use is very high. The ratio of how many single-use count plans compared to all cached plans is 80%. This is a good indication that this is an ad hoc workload. Also, notice that SQL is using only 415MB to store 156883 ad hoc plans in cache; that is a good indication that the instance probably has the “optimize for ad hoc workloads” server configuration option enabled.
Based on those numbers, the server received many ad hoc queries (an ad hoc workload).
Before I move on with the analysis, I’ll recap how SQL Server manages the plan cache for ad hoc queries, as this is important to understand the scenario.
Plan cache for ad hoc queries
As I wrote before on simple-talk, the chances that a query plan for an ad hoc query to be reused is very low because of the way SQL Server caches ad hoc plans.
In general, the cached plan for an ad hoc query will only be used only in the following conditions:
- Subsequent query statement matches exactly (that includes the query and the filter values).
- Query qualifies for simple parameterization (also referred to as auto-parameterization).
- Query qualifies for forced parameterization, and it is enabled at the database or via plan guide using the
PARAMETERIZATION FORCED query hint.
Take a look at a sample of all the mentioned conditions. To run the tests, I’m using the following script to populate the sample tables:
USE Northwind
GO
-- Run tests without ad hoc workloads
EXEC sys.sp_configure N'show advanced options','1';
GO
RECONFIGURE WITH OVERRIDE;
GO
EXEC sys.sp_configure N'optimize for ad hoc workloads', N'0'
GO
RECONFIGURE WITH OVERRIDE
GO
IF OBJECT_ID('OrdersBig') IS NOT NULL
  DROP TABLE OrdersBig
GO
SELECT TOP 500000
       IDENTITY(Int, 1,1) AS OrderID,
       ABS(CheckSUM(NEWID()) / 10000000) AS CustomerID,
       CONVERT(Date, GETDATE() - (CheckSUM(NEWID()) / 1000000)) AS OrderDate,
       ISNULL(ABS(CONVERT(Numeric(18,2), (CheckSUM(NEWID()) / 1000000.5))),0) AS Value,
       CONVERT(VarChar(250), NEWID()) AS Col1
  INTO OrdersBig
  FROM master.dbo.spt_values A
 CROSS JOIN master.dbo.spt_values B CROSS JOIN master.dbo.spt_values C CROSS JOIN master.dbo.spt_values D
GO
ALTER TABLE OrdersBig ADD CONSTRAINT xpk_OrdersBig PRIMARY KEY(OrderID)
GO
IF OBJECT_ID('CustomersBig') IS NOT NULL
  DROP TABLE CustomersBig
GO
SELECT TOP 500000
       IDENTITY(Int, 1,1) AS CustomerID,
       SubString(CONVERT(VarChar(250),NEWID()),1,20) AS CompanyName,
       SubString(CONVERT(VarChar(250),NEWID()),1,20) AS ContactName,
       CONVERT(VarChar(250), NEWID()) AS Col1,
       CONVERT(VarChar(250), NEWID()) AS Col2
  INTO CustomersBig
  FROM master.dbo.spt_values A
 CROSS JOIN master.dbo.spt_values B CROSS JOIN master.dbo.spt_values C CROSS JOIN master.dbo.spt_values D
GO
ALTER TABLE CustomersBig ADD CONSTRAINT xpk_CustomersBig PRIMARY KEY(CustomerID)
GO
IF OBJECT_ID('ProductsBig') IS NOT NULL
  DROP TABLE ProductsBig
GO
SELECT TOP 500000 IDENTITY(Int, 1,1) AS ProductID,
       SubString(CONVERT(VarChar(250),NEWID()),1,20) AS ProductName,
       CONVERT(VarChar(250), NEWID()) AS Col1
  INTO ProductsBig
  FROM master.dbo.spt_values A
 CROSS JOIN master.dbo.spt_values B CROSS JOIN master.dbo.spt_values C CROSS JOIN master.dbo.spt_values D
GO
UPDATE ProductsBig SET ProductName = 'Produto qualquer'
WHERE ProductID = 1
GO
ALTER TABLE ProductsBig ADD CONSTRAINT xpk_ProductsBig PRIMARY KEY(ProductID)
GO
IF OBJECT_ID('Order_DetailsBig') IS NOT NULL
  DROP TABLE Order_DetailsBig
GO
SELECT OrdersBig.OrderID,
       ISNULL(CONVERT(Integer, CONVERT(Integer, ABS(CheckSUM(NEWID())) / 1000000)),0) AS ProductID,
       GetDate() -  ABS(CheckSUM(NEWID())) / 1000000 AS Shipped_Date,
       CONVERT(Integer, ABS(CheckSUM(NEWID())) / 1000000) AS Quantity
  INTO Order_DetailsBig
  FROM OrdersBig
GO
ALTER TABLE Order_DetailsBig ADD CONSTRAINT [xpk_Order_DetailsBig] PRIMARY KEY([OrderID], [ProductID])
GO
CREATE INDEX ixContactName ON CustomersBig(ContactName)
CREATE INDEX ixProductName ON ProductsBig(ProductName)
CREATE INDEX ixCustomerID ON OrdersBig(CustomerID) INCLUDE(Value)
CREATE INDEX ixProductID ON Order_DetailsBig(ProductID) INCLUDE(Quantity)
CREATE INDEX ixCol1OrderDate ON OrdersBig(Col1, OrderDate) INCLUDE(CustomerID, Value)
GO
Statement match
For example, execute the following four queries in the database.
-- Statement match
-- SET PARAMETERIZATION to SIMPLE
ALTER DATABASE Northwind SET PARAMETERIZATION SIMPLE;
GO
DBCC FREEPROCCACHE()
GO
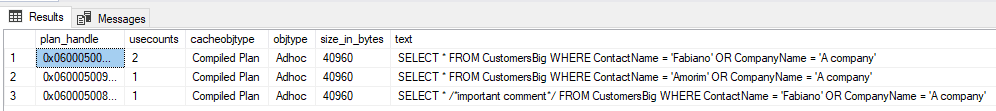
SELECT * FROM CustomersBig WHERE ContactName = 'Fabiano' OR CompanyName = 'A company'
GO
SELECT * FROM CustomersBig WHERE ContactName = 'Fabiano' OR CompanyName = 'A company'
GO
SELECT * /*important comment*/ FROM CustomersBig WHERE ContactName = 'Fabiano' OR CompanyName = 'A company'
GO
SELECT * FROM CustomersBig WHERE ContactName = 'Amorim' OR CompanyName = 'A company'
GO
The first and second queries will use the same plan, but the third and fourth will need to generate a new plan. Notice that the only difference between second and third queries is the comment which is enough to invalidate plan reuse.
Following are the details from the cache DMVs:
SELECT a.plan_handle,
       a.usecounts,
       a.cacheobjtype,
       a.objtype,
       a.size_in_bytes,
       b.text,
       c.query_plan
  FROM sys.dm_exec_cached_plans a
 OUTER APPLY sys.dm_exec_sql_text (a.plan_handle) b
 OUTER APPLY sys.dm_exec_query_plan (a.plan_handle) c
 WHERE b."text" NOT LIKE '%sys.%'
   AND b."text" LIKE '%CustomersBig%'
 ORDER BY a.usecounts DESC
GO
As you can see, to take advantage of the reuse of ad hoc query plans, you need to make sure that the queries are identical, character for character. If one query has a new line or an extra space that another one doesn’t have, they will not be treated as the same. If one contains a comment that the other doesn’t have, they will not be identical. If one uses a different case for either identifiers or keywords, even in a DB with a case-insensitive collation, queries will not be considered the same.
Since SQL considered those queries to be different, each call triggered a query plan compilation and optimization.
Simple parameterization
SQL Server may use ‘simple parameterization’ to turn the literal values into parameters and increase the ability to match SQL statements for different literal values. When this happens, subsequent queries that follow the same basic parameterized query can use the same plan. For example:
-- Auto-param
-- SET PARAMETERIZATION to SIMPLE
ALTER DATABASE Northwind SET PARAMETERIZATION SIMPLE;
GO
DBCC FREEPROCCACHE()
GO
SELECT * FROM OrdersBig WHERE OrderID = 1
GO
SELECT * FROM OrdersBig WHERE OrderID = 2
GO
SELECT * FROM OrdersBig WHERE OrderID = 3
GO
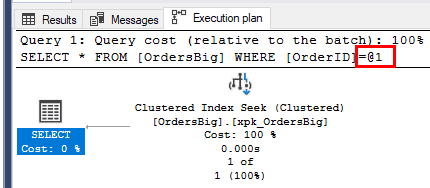
Internally, SQL Server parameterizes the queries as follows:
SELECT * FROM [OrdersBig] WHERE [OrderID]=@1
You can also see the parameterized query in the actual execution plan; notice that the @1 variable is used instead of the literal value:
Following, you can see the details from the cache DMVs:
SELECT a.plan_handle,
       a.usecounts,
       a.cacheobjtype,
       a.objtype,
       b.text,
       c.query_plan
  FROM sys.dm_exec_cached_plans a
 OUTER APPLY sys.dm_exec_sql_text (a.plan_handle) b
 OUTER APPLY sys.dm_exec_query_plan (a.plan_handle) c
 WHERE b."text" NOT LIKE '%sys.%'
   AND b."text" LIKE '%OrdersBig%'
 ORDER BY a.usecounts DESC
GO
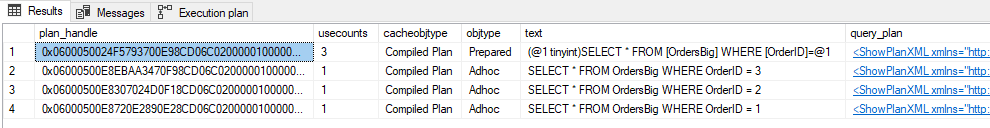
Notice that the three individual queries with their distinct constants do get cached as ad hoc queries. However, these are only considered shell queries and don’t contain the complete execution plan, only a pointer to the full plan in the corresponding prepared plan.
Let me add more comments about those shell queries because they’re the reason I’m writing this article:
- A shell query compilation doesn’t result in an optimization since only the prepared/parameterized query gets optimized. This is good, but the side effect of this is that even those shell queries that don’t get reused will often be cached and use memory. To minimize the impact of those queries, SQL caches them as zero-cost queries. That way, under a memory pressure condition, these would be among the first entries that would be freed from cache. You could look at sys.dm_os_memory_cache_entries to check the cost of each memory object entry.
- The shell queries are only cached to make it easier to find the prepared version of the query if the exact same query with the same constant is executed again later. It will only be useful if you actually re-run the same ad hoc query again, which, for most scenarios, is very unlikely (at least, considering the majority of the queries). Microsoft probably have a reason why they’re doing it, but I’ve noticed that most environments are hitting the plan cache limit due to the high number of ad hoc queries, and forced parameterization can do nothing to help with it. In the article “Useful Queries on DMV’s to understand Plan Cache Behavior” they mentioned that “In some workloads, there is reuse of adhoc queries with the exact same parameter values. In such cases caching of the shell query proves gives better throughput.”
- In my opinion, storing those garbage ad hoc queries in a limited cache space is not a good idea. I wish I had an option (trace flag, anyone?) to change this behavior and not cache the ad hoc queries when a prepared version of the query exists.
Take a look at the XML for the second row (the one with the ad hoc plan with OrderID = 3):
<ShowPlanXML xmlns="http://schemas.microsoft.com/sqlserver/2004/07/showplan" Version="1.539" Build="15.0.4138.2">
  <BatchSequence>
    <Batch>
      <Statements>
        <StmtSimple StatementText="SELECT * FROM OrdersBig WHERE OrderID = 3" StatementId="1" StatementCompId="1" StatementType="SELECT" RetrievedFromCache="true" ParameterizedPlanHandle="0x0600050024F5793700E98CD06C02000001000000000000000000000000000000000000000000000000000000" ParameterizedText="(@1 tinyint)SELECT * FROM [OrdersBig] WHERE [OrderID]=@1" />
      </Statements>
    </Batch>
  </BatchSequence>
</ShowPlanXML>
Notice that there is an attribute ParameterizedPlanHandle with value “0x0600050024F5793700E98CD06C02000001000000000000000000000000000000000000000000000000000000” which is the pointer to the prepared query that has the full execution plan.
By default, SQL Server simple-parameterizes a relatively small class of queries. The engine is very conservative about deciding when to use simple parameterization for a query. It will only parameterize queries if the prepared query plan is considered to be safe.
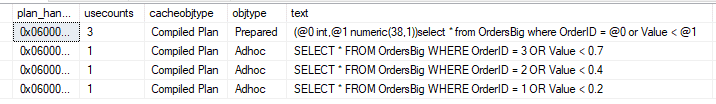
Forced parameterization
You can enable forced parameterization at the DB level to enable parameterization for all queries in the database, subject to certain limitations (for a list of limitations and exceptions, check the BOL).
Once forced param is enabled, the result will be pretty much the same as simple-param, but for all queries.
For example, consider the following queries that would not be simple-parameterized but are parameterized under forced param:
-- Forced-param
-- SET PARAMETERIZATION to FORCED
ALTER DATABASE Northwind SET PARAMETERIZATION FORCED;
GO
DBCC FREEPROCCACHE()
GO
SELECT * FROM OrdersBig WHERE OrderID = 1 OR Value < 0.2
GO
SELECT * FROM OrdersBig WHERE OrderID = 2 OR Value < 0.4
GO
SELECT * FROM OrdersBig WHERE OrderID = 3 OR Value < 0.7
GO
Following, you can see the details from the cache DMVs:
Stored procedures and sp_executesql
It is a best practice to use stored procedures or rely on data access methods parameterization using param markers to increase the reuse of execution plans. For example, consider the same query used with forced param. Once the developer identifies all the parameters in the query, they can use parameter markers (question marks) to replace a constant in an SQL statement and are bound to a program variable. Using parameters at the application, you would see the following calls in the SQL Server:
-- sp_executesql
-- SET PARAMETERIZATION to SIMPLE
ALTER DATABASE Northwind SET PARAMETERIZATION SIMPLE;
GO
DBCC FREEPROCCACHE()
GO
EXEC sp_executesql N'SELECT * FROM OrdersBig WHERE OrderID = @OrderID OR Value < @Value',
                   N'@OrderID Int, @Value NUMERIC(18,2)',
                   @OrderID =1,
                   @Value = 0.2
GO
EXEC sp_executesql N'SELECT * FROM OrdersBig WHERE OrderID = @OrderID OR Value < @Value',
                   N'@OrderID Int, @Value NUMERIC(18,2)',
                   @OrderID = 2,
                   @Value = 0.4
GO
EXEC sp_executesql N'SELECT * FROM OrdersBig WHERE OrderID = @OrderID OR Value < @Value',
                   N'@OrderID Int, @Value NUMERIC(18,2)',
                   @OrderID = 3,
                   @Value = 0.7
GO
Following, you can see the details from the cache DMVs:
When using sp_executesql, there are no entries for the ad hoc shell query (unparameterized) queries. Not having the ad hoc shell queries in the plan cache is a key factor for the analysis I was doing, as 80% of the plan cache was filled with those shell queries.
Note: It is worthy of adding a note in favor of parameterization. Using parameters to hold values that end users type is more secure than concatenating the values into a string that is then executed by using either a data access API method, the EXECUTE statement, or the sp_executesql stored procedure. SQL injection, anyone?
Back to the scenario analysis
Now that you understand how SQL manages plan cache for ad hoc queries, it’s time to get back to the analysis.
Once I looked at the batch request/sec and compilations/sec numbers, I started to question myself: How can I have such a high number of compilations/sec if most requests use forced parameterization? (notice that forced param/sec counter is pretty much the same as compilations/sec). If an ad hoc query execution is parameterized (via forced param), how could I still have a compilation? Shouldn’t they use the “prepared” plan and count as a cache hit (found the plan in cache)?
Remember, on both simple-param and forced-param, SQL Server also adds the ad hoc shell query in the plan cache. When it happens, since the plan for the ad hoc query is not in cache, it counts as a cache miss (couldn’t find query plan in cache). This will decrease the plan cache hit ratio and increases compilations/sec. However, there is an important thing to consider: those compilations/sec are not triggering an optimization, so the CPU cost of the compilation is not so bad. Since it is not triggering the optimization, it may use less CPU.
In other words, considering CPU usage, a high number of compilation/sec per batch requests/sec may not necessarily be a problem. This is still definitely something of concern if you consider the internal/local memory pressure it may cause. As a result of having many ad hoc plans in cache, you may have the following problems:
- If the number of ad hoc shell entries gets too big, you’ll reach a point (there is no more room left in plan cache) where you hit the limit of entries in the plan cache memory table. This will make SQL run the eviction policy algorithm to determines which plans to remove from cache.
- When the plan cache reaches its entry limit, plans with low cost must be evicted in order to insert new plans. Suppose there are many concurrent users/sessions trying to insert or remove rows in the same hash table (in the case of ad hoc queries, I’m talking about the SQL Plans internal area). In that case, there may be spinlock (SOS_CACHESTORE and/or SOS_CACHESTORE_CLOCK) contention which can cause high CPU usage.
- Consider a scenario with the same ad hoc query being called hundreds of times per second. SQL will cache the ad hoc shell query for each unique (individual calls using different constant values) call, even though there may be only one cached prepared plan available and being reused. In such scenarios, the CMEMTHREAD wait may start to pop up, indicating you have contention on the memory object from which cache descriptors are allocated. Even though Microsoft already tried to optimize the code to avoid this, you may still see those.
- If optimize for ad hoc workloads is not enabled, you’ll probably end up with a cache bloat problem.
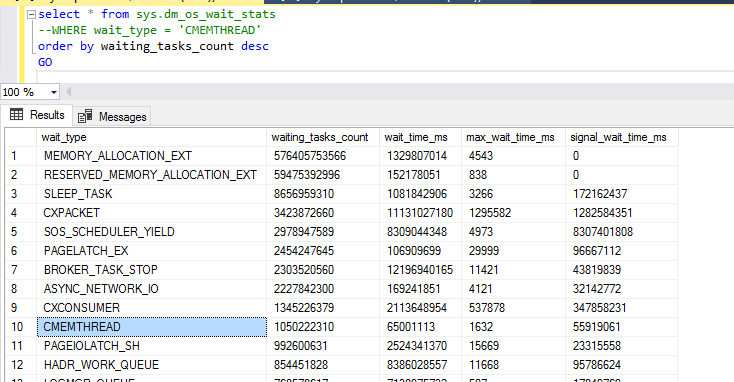
Considering that, I decided to check the internal memory pressure condition. I started by looking at the wait CMEMTHREAD, and it is indeed there.
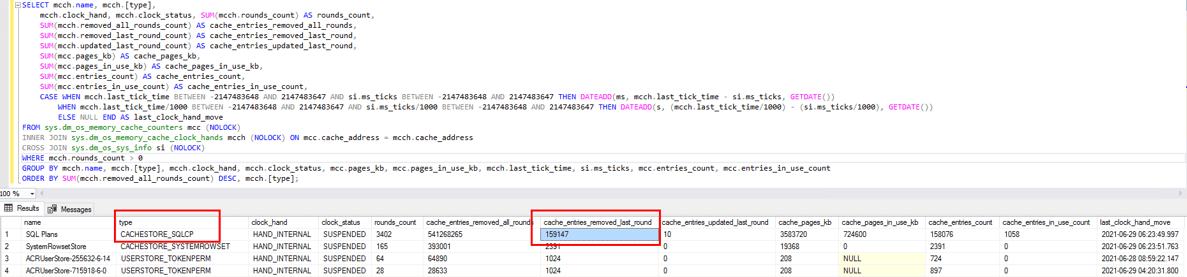
I’ve also looked at DMV sys.dm_os_memory_cache_clock_hands, This DMV has information about how many clock rounds have been made for each cache store. The query below returns information about cache stores with most entries removed in the last round. Notice that internal (internal and external clock hand distinguishes internal and external memory pressure respectively) clock hand for CACHESTORE_SQLCP indicates the number of entries (plans) removed in the last round was 161098 (pretty much everything).
SELECT mcch.name,
       mcch.[type],
       mcch.clock_hand,
       mcch.clock_status,
       SUM(mcch.rounds_count) AS rounds_count,
       SUM(mcch.removed_all_rounds_count) AS cache_entries_removed_all_rounds,
       SUM(mcch.removed_last_round_count) AS cache_entries_removed_last_round,
       SUM(mcch.updated_last_round_count) AS cache_entries_updated_last_round,
       SUM(mcc.pages_kb) AS cache_pages_kb,
       SUM(mcc.pages_in_use_kb) AS cache_pages_in_use_kb,
       SUM(mcc.entries_count) AS cache_entries_count,
       SUM(mcc.entries_in_use_count) AS cache_entries_in_use_count,
       CASE
           WHEN mcch.last_tick_time
                BETWEEN -2147483648 AND 2147483647
                AND si.ms_ticks
                BETWEEN -2147483648 AND 2147483647 THEN
               DATEADD(ms, mcch.last_tick_time - si.ms_ticks, GETDATE())
           WHEN mcch.last_tick_time / 1000
                BETWEEN -2147483648 AND 2147483647
                AND si.ms_ticks / 1000
                BETWEEN -2147483648 AND 2147483647 THEN
               DATEADD(s, (mcch.last_tick_time / 1000) - (si.ms_ticks / 1000), GETDATE())
           ELSE
               NULL
       END AS last_clock_hand_move
FROM sys.dm_os_memory_cache_counters mcc (NOLOCK)
    INNER JOIN sys.dm_os_memory_cache_clock_hands mcch (NOLOCK)
        ON mcc.cache_address = mcch.cache_address
    CROSS JOIN sys.dm_os_sys_info si (NOLOCK)
WHERE mcch.rounds_count > 0
GROUP BY mcch.name,
         mcch.[type],
         mcch.clock_hand,
         mcch.clock_status,
         mcc.pages_kb,
         mcc.pages_in_use_kb,
         mcch.last_tick_time,
         si.ms_ticks,
         mcc.entries_count,
         mcc.entries_in_use_count
ORDER BY SUM(mcch.removed_all_rounds_count) DESC,
         mcch.[type];
I also noticed that this was removing avg of 161k entries every 5 seconds.
Luckily, the number of CPUs (96) available in the server was good enough to keep up with the workload and avoid CPU pressure, but that only happened because it has forced parameterization enabled in all DBs in the instance. This was helping to avoid the full optimization of all the ad hoc queries, which I’m sure would make the CPU go to 100% in just a few seconds if it wasn’t the case. Forced parameterization does fix the issue of optimizing the query plan for each ad-hoc query execution, but it does not fix the issue of compiling the plan and bloating the cache with garbage plans which may cause internal memory pressure and consequently the plan cache to be cleaned and the spinlock contention.
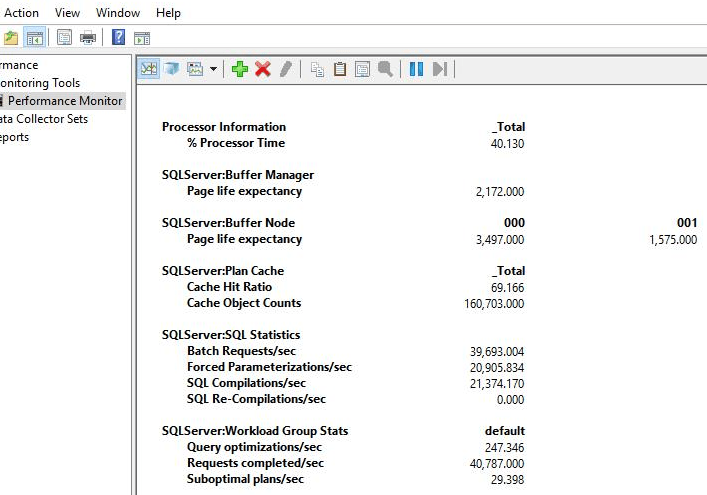
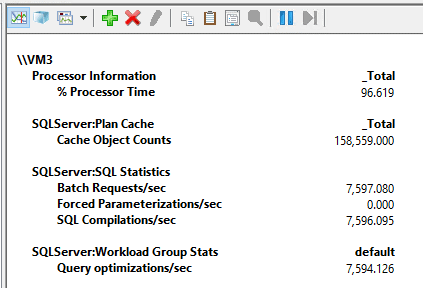
The lesson I learned was, from now on, I’ll look not only at batch requests/sec, compilations/sec and plan cache hit ratio, but also in another important counter which is the “Workload Group Stats: Query optimizations/sec”. When considering this counter, it would be easier to identify those cases where ad hoc queries are causing a high number of compilations but not necessarily triggering optimization. For instance, the following is the same image as before, but now with the info about the query optimizations/sec:
Notice that out of 20905 compilations per second, there were only 247 query optimizations per second—a much better picture of what is going on with the server. The general guideline of “Compilations/sec should be less than 10% of the Batch Request/sec” is still valid as a good practice, but, as you know, a general guideline doesn’t apply for all scenarios.
Time for some tests
Here are some tests to simulate the same scenario I presented before to see it’s possible to identify the problems and analyze the alternatives and the benefits it may provide.
To run the tests, I created the following PowerShell script to run an ad hoc query 50000 times.
Clear-Host
$ScriptBlock = {
    $conn = New-Object System.Data.SqlClient.SqlConnection("Server=vm3;Database=Northwind;User ID=sa;Password=-------;")
    $conn.Open()
    $i = 1
    while ($i -le 50000){
        try {
            $sqlCmd = New-Object System.Data.SqlClient.SqlCommand
            $sqlCmd.Connection = $conn
            [string]$Guid = New-Guid
            $query = "SELECT *, (Select 1) AS Num FROM OrdersBig o
                        WHERE o.Col1 = '$Guid'"
            $sqlCmd.CommandText = $query
            $reader = $sqlCmd.ExecuteReader()
            $reader.Close()
            $i = $i + 1
        }
        catch {
            $ErrorMessage = $_.Exception.Message
            $vGetDate = Get-Date -Format G
            Write-Output "$vGetDate : Connection Failed "$ErrorMessage"... retrying..."
        }
    }
    $conn.Dispose()
}
$current = Get-Date
Invoke-Command -ScriptBlock $ScriptBlock
$end= Get-Date
$diff= New-TimeSpan -Start $current -End $end
Write-Output "Time to run the script: $diff"
<#
exec xp_cmdshell 'powershell -NoLogo -NoProfile "C:\Temp\Test.ps1"'
#>
Then, I’m using SQLQueryStress to call the script with 100 threads using xp_cmdshell. (I know there are easier ways to do it via PS, but that’s good enough for me 😊)
Before I run the tests, I’m also enabling optimize for ad hoc workloads to avoid memory pressure due to the size of the plan caches using the following code:
-- Run tests with ad hoc workloads
EXEC sys.sp_configure N'optimize for ad hoc workloads', N'1'
GO
RECONFIGURE WITH OVERRIDE
GO
Test 1: Ad hoc with simple param triggering compilation and optimization
For the first execution, I tried the script with simple parameterization using 100 concurrent threads. Since the query is a bit complex, it won’t be auto-parameterized, which means it will trigger a compilation and an optimization for each call. The script took 12 minutes and 16 seconds to run, and while it was running, I saw the following counter numbers:
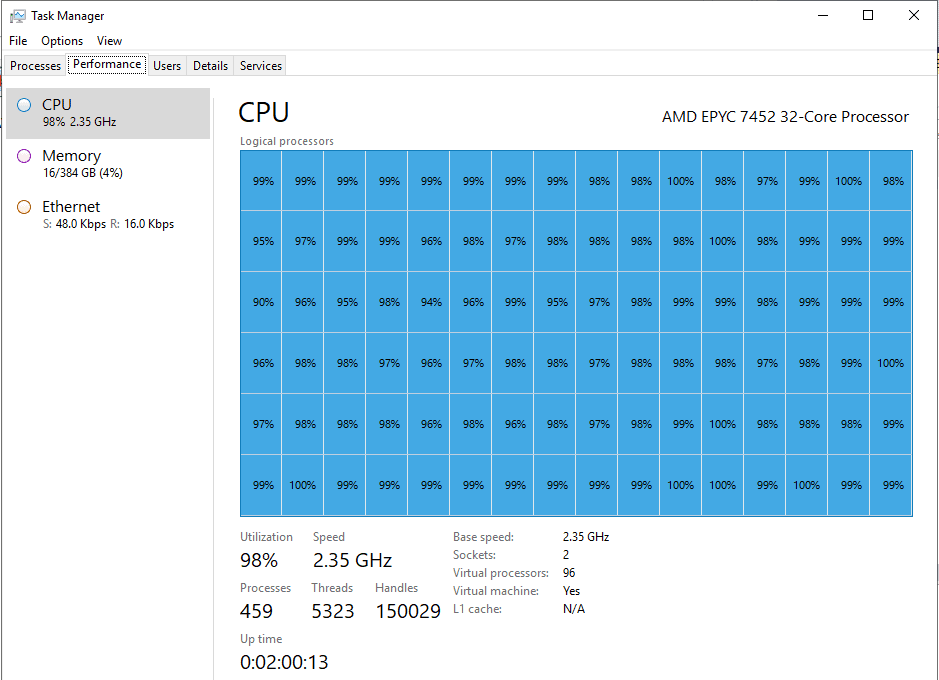
As per the image above, I was able to run an average of 7597 batch requests per second. After a few seconds, I hit the limit of entries in the plan cache. Also, as expected, each ad hoc query execution is compiled and optimized. Since those operations are CPU intensive, with only 7597 batch requests/sec of a very lightweight (query doesn’t return anything and is very fast) query, it is using almost 100% of CPU in my 96 cores VM. That’s a lot of CPU to do nothing other than creating execution plans.
Test 2: Ad hoc with forced param triggering compilation and only 1 optimization
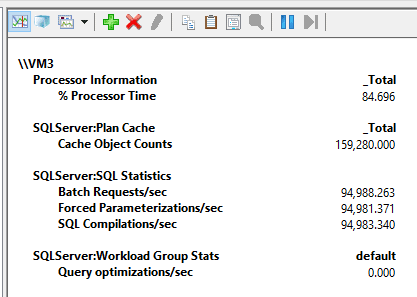
For the second execution, I tried the script with forced parameterization and using the same 100 concurrent threads as before. This will trigger optimization only for the first call of the query, and all subsequent calls will reuse the prepared plan. The script took only 58 seconds to run, and while it was running, I saw the following counter numbers:
As per the image above, I was able to run an average of 94 thousand batch requests per second, and as expected, the compilations/sec counter is showing the same 94 thousand values as each ad hoc query counts as a compilation, although there were no optimizations. Because there was no extra CPU cost related to the optimizations for each call, I was able to run a lot more requests per second.
Test 3: Parameterized queries in the application
For the third execution, I tried the script with a query parameterized from the application. Again, I used the same 100 concurrent threads as before.
To parameterize it from the PS script, I’ve changed the following part of the code:
...
[string]$Guid = New-Guid
$Col1Param = New-Object System.Data.SqlClient.SqlParameter("@Col1",[Data.SQLDBType]::varchar, 250)
$Col1Param.Value = $Guid
$sqlCmd.Parameters.Add($Col1Param) | Out-Null
$query = "SELECT * FROM OrdersBig o
            INNER JOIN CustomersBig c ON o.CustomerID = c.CustomerID
            INNER JOIN Order_DetailsBig od ON o.OrderID = od.OrderID
            INNER JOIN ProductsBig p ON od.ProductID = p.ProductID
            WHERE o.Col1 = @Col1"
$sqlCmd.CommandText = $query
...
Now, the script took only 51 seconds to run, and while it was running, I saw the following counter numbers:
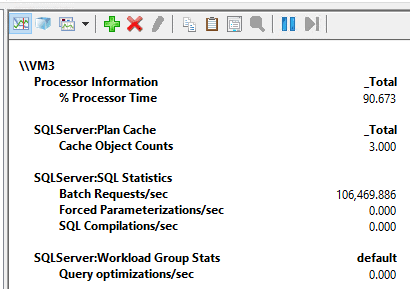
This is 106469 batch requests per second with CPU usage averaging at 90%. At this time, I thought, well, CPU at 90%, I think I can add a few more threads to see how it goes. Here is the result of the execution using 150 threads:
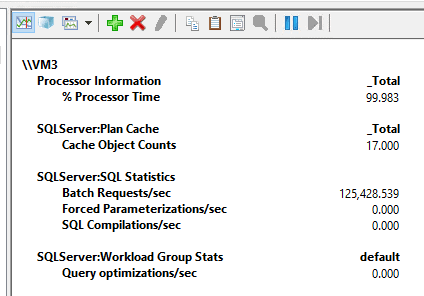
125428 batch requests/sec, that’s a lot of requests 😊.
This will work under simple or forced parameterization, so, it is a good way of guarantee a good parameterized behavior.
To summarize the results:
Following, you can see a table with the summarized results. Using parameterized queries from the application, I was able to run 125 thousand batch requests per second, which is impressive.
|
Scenario
|
Parameterization
|
Threads
|
Avg of batch requests/sec
|
Time to run all requests
|
|
Test 1
|
Simple with auto param
|
100
|
7597
|
12 minutes and 16 seconds
|
|
Test 2
|
Forced
|
100
|
94988
|
58 seconds
|
|
Test 3
|
sp_executesql
|
100
|
106469
|
51 seconds
|
|
Test 3
|
sp_executesql
|
150
|
125428
|
61 seconds
|
SQL compilations/sec
Parameterization plays a very important role in the performance of a system. Although simple parameterization, forced parameterization, and optimize for ad hoc workload features can help to minimize the lack of parameterization, it is a good practice to parameterize queries at the application side or use stored procedures. Using stored procedures is also good because it usually avoids issues with implicit conversions due to wrong parameter data types (although even on SPs users can always use wrong datatypes if variable type is different than table column). This will reduce memory consumption, reduce memory pressure, and reduce CPU usage by saving the compilation and optimization time of each query.
If you liked this article, you might also like SQL Server performance monitor data: Introduction and usage
The post SQL Compilations/sec is not what you think it is appeared first on Simple Talk.
from Simple Talk https://ift.tt/378DSwq
via

 You can still learn a ton from the Kendras and Bobs, but don’t kick yourself for not being them.