Wednesday, June 29, 2022

Searching through a database via SQL

Imagine that while developing or testing a SQL Server database, you get an error message mentioning a database object, and you scratch your head, and mutter ‘by the bones of the saints, what is that?’. If it is a small database, then you can glance, maybe, at the browser pane. Once it gets to any size, you’ve got to search the metadata. If you know it is a column than you can look in information_schema.Columns or in sys.columns, but if you don’t know, or if you want to know more about the column, you’re into a certain difficulty. Someone has probably explained what the column does in an extended property. What table or view is it in? what else is in the table?

Finding things in databases isn’t always straightforward. You might think that you can just search the database objects in SQL Server. No, because user types, for example are stored elsewhere, despite being schema-bound. You might want to search in the scheduled jobs too, but there is no way of working out whether the code in a job step relates to a particular database. You might think that the information_schema represented a consistent industry standard, providing a rational logical layer over the seething reality underneath. You might be wrong.

SQL Server, like all RDBMSs, grow in rather strange way, sometimes in response to the esoteric needs of a major customer, the hobbyhorse of a senior manager, or to head off an industry-trend such as NoSQL or Big Data. We have to make retrospective sense of it all.

SQL Server has the concept of a parent object. This roughly corresponds to table, view and module (aka Routine). These parent objects have child objects, which correspond to constraints, and triggers. Internal tables can be either, depending on whether they are queue messages or XML Index nodes that do, or otherwise don’t.

Columns, indexes or parameters aren’t objects. They are treated as ordered lists of attributes to one particular type. Types are schema-based but they aren’t objects. Databases have attributes that aren’t schema-based but which apply to the database as a whole, such as datafiles or dataSpaces. You see some of them in the CREATE database statements in generated scripts.

All this might seem complicated, but I’ve done it for you. I’ve created two SQL Server routines. One is a Table-valued function that list database objects and their paths, and the other is a view that lists the database attributes as well.

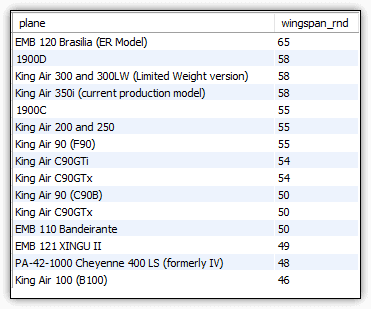
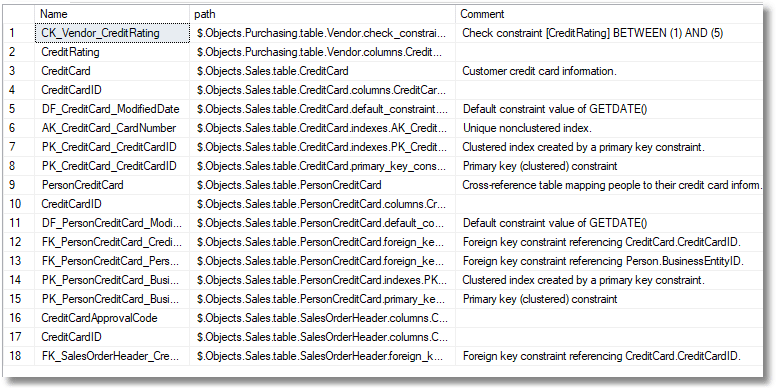
You might use the schemaObjects function by itself if you aren’t interested in the database properties, just the database metadata. The obvious way of searching is this. Want to find out where the database processes credit cards?

SELECT Name, path, Comment
  FROM SchemaObjects ()
  WHERE Name + comment LIKE '%credit%'
  ORDER BY path;


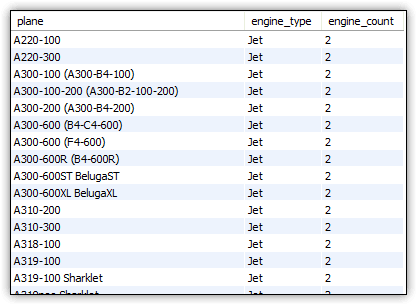
…which gives you (in AdventureWorks) the following

Graphical user interface, text, application Description automatically generated

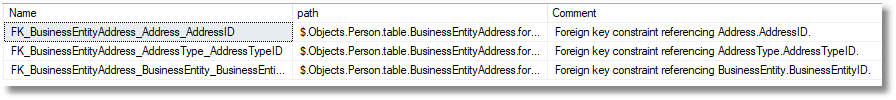
The ‘path’ column gives you a reasonable sort order, except for the order of columns. It comes in handy for searching for a specific database object type, or for, say, the foreign key for a particular table.

Here we are trying to find out all the foreign keys in person.BusinessEntityAddress

SELECT Name, path, Comment
  FROM SchemaObjects ()
  WHERE path LIKE '%.foreign_key_constraint.%' 
  AND path LIKE '%person.table.BusinessEntityAddress%';


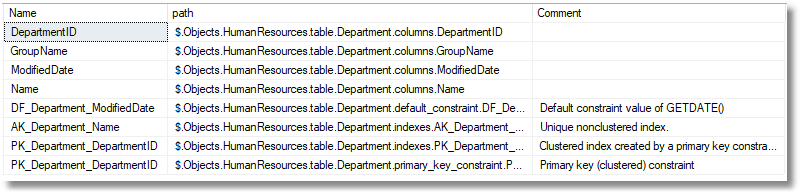
Maybe you just want to see what is in a table

SELECT Name, path, Comment
  FROM SchemaObjects ()
  WHERE path LIKE '%humanresources.table.Department.%'
  ORDER BY path;


Graphical user interface, text Description automatically generated

So here is the source of the application. If it is updated, the latest version will be in the Gloop project TheGloopSQLServerDatabaseDocumenter/SearchDatabase.sql

GO
CREATE OR ALTER FUNCTION dbo.SchemaObjects
  (
/**
Summary: >
  Returns all the schema objects, their name, path and so on.
Author: Phil Factor
Date: Tuesday, 28 June 2022
Examples:
   - Select * from SchemaObjects() order by path
   - Select  Name, path, Comment from SchemaObjects() where Name+comment like '%credit%' order by path
   - Select  Name, path, Comment from SchemaObjects() where path like '%person.table.businessentity.%'
   - Select  Name, path, Comment from SchemaObjects() where path like '%.foreign_key_constraint.%'
Returns: >
  table 
**/
) RETURNS @FoundObjects TABLE
  (TableOrderType INT,
   object_id INT,
   minor_id INT,
   TheType CHAR(2),
   SQL_Name NVARCHAR(400),
   "Name" sysname,
   "path" NVARCHAR(400),
   comment NVARCHAR(3870))
AS
  BEGIN
    INSERT INTO @FoundObjects
      (TableOrderType, object_id, minor_id, TheType, SQL_Name, "Name",
       "path", comment)
    SELECT --objects 
-- SQL Prompt formatting off
           CASE WHEN ob.parent_object_id >0 THEN 10 ELSE 0 END AS TableOrderType,
                 ob.object_id, CASE WHEN ob.parent_object_id >0 THEN 1 ELSE 0 END AS minor_id, ob.type AS TheType,
                 CASE WHEN ob.parent_object_id>0 
                 THEN Object_Schema_Name(ob.parent_object_id)
                 + '.'+Object_Name(ob.parent_object_id)+'.'+ob.name 
                 ELSE Object_Schema_Name(ob.object_id)+'.'+ob.name 
           END AS SQL_Name,ob.name AS name,
                 '$.Objects.'+Object_Schema_Name(ob.object_id) +
           CASE WHEN ob.parent_object_id>0 THEN 
                        CASE WHEN pa.type IN ('TF','FN','IF','FS','FT') THEN '.function'
                                WHEN pa.type IN ('P', 'PC','RF','X') THEN '.procedure' 
                                WHEN pa.type IN ('U','IT') THEN '.table'
                                WHEN pa.type='SQ' THEN '.queue'
                                ELSE '.'+Lower(pa.type_desc)
                        END +'.' +pa.name+'.' ELSE '.' 
           END+
                 CASE WHEN ob.type IN ('TF','FN','IF','FS','FT') THEN 'function'
                          WHEN ob.type IN ('P', 'PC','RF','X') THEN 'procedure' 
                          WHEN ob.type IN ('U','IT') THEN 'table'
                          WHEN ob.type='SQ' THEN 'queue'
                          ELSE 
                          Lower(ob.type_desc)
                 END+'.'
                 --+ CASE WHEN ob.parent_object_id>0 
                --       THEN Object_Name(ob.parent_object_id) COLLATE DATABASE_DEFAULT+'.'
                --       ELSE '' 
                 -- END 
                + ob.name AS "path",
-- SQL Prompt formatting on
      Coalesce (Convert (NVARCHAR(3870), ep.value), '') AS comment
      FROM
      sys.objects ob
        LEFT OUTER JOIN sys.objects pa
          ON pa.object_id = ob.parent_object_id
        LEFT OUTER JOIN sys.extended_properties ep
          ON ep.major_id = ob.object_id
         AND ep.class = 1
         AND ep.minor_id = 0
         AND ep.name = 'MS_Description'
      WHERE
      ob.is_ms_shipped = 0 AND ob.is_ms_shipped = 0
    UNION ALL
    SELECT 0, 0, xc.xml_collection_id, 'XT',
           Schema_Name (xc.schema_id) + '.' + xc.name, xc.name,
           '$.types.' + Schema_Name (xc.schema_id)
           + '.xml_Schema_collection.' + xc.name,
           Coalesce (Convert (NVARCHAR(3870), ep.value), '') AS comment
      FROM
      sys.xml_schema_collections xc
        LEFT OUTER JOIN sys.extended_properties ep
          ON ep.class = 10
         AND ep.major_id = xc.xml_collection_id
         AND ep.name = 'MS_Description'
      WHERE xc.xml_collection_id > 65535
    UNION ALL
    SELECT 0, 0, UT.user_type_id, 'UT',
           Schema_Name (UT.schema_id) + '.' + UT.name, UT.name,
           '$.types.' + Schema_Name (UT.schema_id) + '.user_types.' + UT.name,
           Coalesce (Convert (NVARCHAR(3870), ep.value), '') AS comment
      FROM
      sys.types UT
        LEFT OUTER JOIN sys.extended_properties ep
          ON ep.class = 6
         AND ep.major_id = UT.user_type_id
         AND ep.name = 'MS_Description'
      WHERE
      UT.user_type_id <> UT.system_type_id
  AND Schema_Name (UT.schema_id) <> 'sys';


    INSERT INTO @FoundObjects
      (TableOrderType, object_id, minor_id, TheType, SQL_Name, "Name",
       "path", comment)
    SELECT 7, F.object_id AS "OBJECT_ID", ix.index_id AS Minor_id, 'IX',
           F.SQL_Name + '.' + ix.name, ix.name,
           F.path + '.indexes.' + ix.name,
           Coalesce (Convert (NVARCHAR(3870), ep.value), '')
      FROM
      @FoundObjects F
        INNER JOIN sys.indexes ix
          ON F.object_id = ix.object_id
        LEFT OUTER JOIN sys.extended_properties ep
          ON ep.major_id = ix.object_id
         AND ep.class = 7
         AND ep.name = 'MS_Description'
      WHERE
      ix.index_id > 0 AND ep.minor_id = ix.index_id
    UNION ALL
    SELECT 2, F.object_id AS "OBJECT_ID", par.parameter_id AS Minor_id, 'PA',
           F.SQL_Name + '.' + par.name, par.name,
           F.path + '.parameters.' + par.name,
           Coalesce (Convert (NVARCHAR(3870), ep.value), '')
      FROM
      @FoundObjects F
        INNER JOIN sys.parameters par
          ON F.object_id = par.object_id
        LEFT OUTER JOIN sys.extended_properties ep
          ON ep.major_id = par.object_id
         AND ep.class = 2
         AND ep.name = 'MS_Description'
         AND ep.minor_id = par.parameter_id
      WHERE par.parameter_id > 0
    UNION ALL
    SELECT 3, F.object_id AS "OBJECT_ID", Col.column_id AS Minor_id, 'CO',
           F.SQL_Name + '.' + Col.name, Col.name,
           F.path + '.columns.' + Col.name,
           Coalesce (Convert (NVARCHAR(3870), ep.value), '')
      FROM
      @FoundObjects F
        INNER JOIN sys.columns Col
          ON F.object_id = Col.object_id
        LEFT OUTER JOIN sys.extended_properties ep
          ON ep.major_id = Col.object_id
         AND ep.class = 2
         AND ep.name = 'MS_Description'
         AND ep.minor_id = Col.column_id;
    RETURN;
  END;
GO


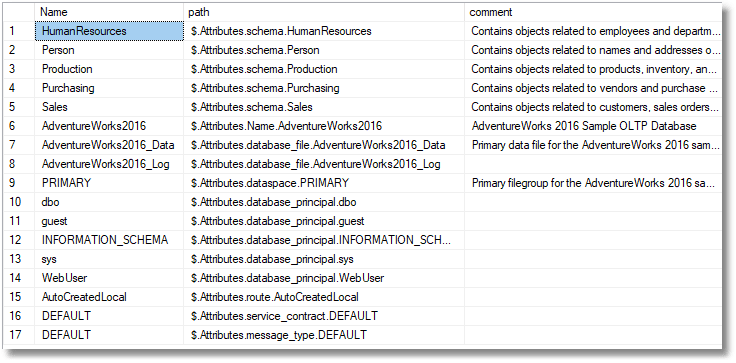
The view adds the attributes at database level. Of course, there aren’t going to be many of these in a sample database but here goes

Select * from The_Metadata where path like ‘$.Attributes%’

Graphical user interface, text, application Description automatically generated

CREATE OR ALTER VIEW The_Metadata
/**
Summary: >
  This is a view of all the database-level attributes 
  of the current database
Author: Phil Factor
Date: Tuesday, 28 June 2022
Database: AdventureWorks
Examples:
   -Select Name, Path, Comment from The_Metadata where name+' '+comment like '%credit%' order by path
   -Select * from The_Metadata where path like '$.Attributes%' 
Returns: >
  table
**/
AS
  SELECT Name, path, comment FROM SchemaObjects ()
  UNION ALL
  SELECT --schemas
    sch.name, '$.Attributes.schema.' + sch.name AS Attribute,
    Coalesce (Convert (NVARCHAR(3870), ep.value), '')
    FROM
    sys.schemas sch
      LEFT OUTER JOIN sys.extended_properties ep
        ON ep.class = 3
       AND ep.major_id = sch.schema_id
       AND ep.name = 'MS_Description'
    WHERE
    sch.schema_id > 4 AND sch.name NOT LIKE 'DB%'
  UNION ALL --Database 
  SELECT f.Object, '$.Attributes.Name.' + f.Object,
         Coalesce (Convert (NVARCHAR(3870), ep.value), '')
    FROM (VALUES (Db_Name (), 'database')) f ("Object", "type")
      LEFT OUTER JOIN sys.extended_properties ep
        ON ep.class = 0 AND ep.name = 'MS_Description'
  UNION ALL
  SELECT --Database Files
    df.name, '$.Attributes.database_file.' + df.name,
    Coalesce (Convert (NVARCHAR(3870), ep.value), '')
    FROM
    sys.database_files df
      LEFT OUTER JOIN sys.extended_properties ep
        ON ep.class = 22
       AND ep.major_id = df.file_id
       AND ep.name = 'MS_Description'
  UNION ALL
  SELECT --Data Spaces
    ds.name, '$.Attributes.dataspace.' + ds.name,
    Coalesce (Convert (NVARCHAR(3870), ep.value), '')
    FROM
    sys.data_spaces ds
      LEFT OUTER JOIN sys.extended_properties ep
        ON ep.class = 20
       AND ep.major_id = ds.data_space_id
       AND ep.name = 'MS_Description'
  UNION ALL
  SELECT --USER
    dp.name, '$.Attributes.database_principal.' + dp.name,
    Coalesce (Convert (NVARCHAR(3870), ep.value), '')
    FROM
    sys.database_principals dp
      LEFT OUTER JOIN sys.extended_properties ep
        ON ep.class = 4
       AND ep.major_id = dp.principal_id
       AND ep.name = 'MS_Description'
    WHERE dp.type = 'S'
  UNION ALL
  SELECT --PARTITION FUNCTION
    pf.name, '$.Attributes.partition_function.' + pf.name,
    Coalesce (Convert (NVARCHAR(3870), ep.value), '')
    FROM
    sys.partition_functions pf
      LEFT OUTER JOIN sys.extended_properties ep
        ON ep.class = 21
       AND ep.major_id = pf.function_id
       AND ep.name = 'MS_Description'
  UNION ALL
  SELECT --REMOTE SERVICE BINDING
    rsb.name, '$.Attributes.remote_service_binding.' + rsb.name,
    Coalesce (Convert (NVARCHAR(3870), ep.value), '')
    FROM
    sys.remote_service_bindings rsb
      LEFT OUTER JOIN sys.extended_properties ep
        ON ep.class = 18
       AND ep.major_id = rsb.remote_service_binding_id
       AND ep.name = 'MS_Description'
  UNION ALL
  SELECT --Route
    rt.name, '$.Attributes.route.' + rt.name,
    Coalesce (Convert (NVARCHAR(3870), ep.value), '')
    FROM
    sys.routes rt
      LEFT OUTER JOIN sys.extended_properties ep
        ON ep.class = 19
       AND ep.major_id = rt.route_id
       AND ep.name = 'MS_Description'
  UNION ALL
  SELECT --Service
    sv.name COLLATE DATABASE_DEFAULT, '$.Attributes.service.' + sv.name,
    Coalesce (Convert (NVARCHAR(3870), ep.value), '')
    FROM
    sys.services sv
      LEFT OUTER JOIN sys.extended_properties ep
        ON ep.class = 17
       AND ep.major_id = sv.service_id
       AND ep.name = 'MS_Description'
    WHERE sv.name NOT LIKE 'http://schemas.microsoft.com/SQL%'
  UNION ALL
  SELECT -- 'CONTRACT'
    svc.name COLLATE DATABASE_DEFAULT,
    '$.Attributes.service_contract.' + svc.name COLLATE DATABASE_DEFAULT,
    Coalesce (Convert (NVARCHAR(3870), ep.value), '')
    FROM
    sys.service_contracts svc
      LEFT OUTER JOIN sys.extended_properties ep
        ON ep.class = 16
       AND ep.major_id = svc.service_contract_id
       AND ep.name = 'MS_Description'
    WHERE svc.name NOT LIKE 'http://schemas.microsoft.com/SQL%'
  UNION ALL
  SELECT -- 'MESSAGE TYPE'
    smt.name,
    '$.Attributes.message_type.' + smt.name COLLATE DATABASE_DEFAULT,
    Coalesce (Convert (NVARCHAR(3870), ep.value), '')
    FROM
    sys.service_message_types smt
      LEFT OUTER JOIN sys.extended_properties ep
        ON ep.class = 15
       AND ep.major_id = smt.message_type_id
       AND ep.name = 'MS_Description'
    WHERE smt.name NOT LIKE 'http://schemas.microsoft.com/SQL%'
  UNION ALL
  SELECT -- 'assembly'
    asy.name, '$.Attributes.assembly.' + asy.name COLLATE DATABASE_DEFAULT,
    Coalesce (Convert (NVARCHAR(3870), ep.value), '')
    FROM
    sys.assemblies asy
      LEFT OUTER JOIN sys.extended_properties ep
        ON ep.class = 5
       AND ep.major_id = asy.assembly_id
       AND ep.name = 'MS_Description'
    WHERE asy.name NOT LIKE 'Microsoft.SqlServer.Types'
  UNION ALL
  SELECT --'CERTIFICATE'
    cer.name, '$.Attributes.certificate.' + cer.name, ''
    FROM sys.certificates cer
  UNION ALL
  SELECT --'ASYMMETRIC KEY'
    amk.name, '$.Attributes.asymmetric_key.' + amk.name, ''
    FROM sys.asymmetric_keys amk
  UNION ALL
  SELECT --'SYMMETRIC KEY'
    smk.name, '$.Attributes.symmetric_key.' + smk.name, ''
    FROM sys.symmetric_keys smk
  UNION ALL
  SELECT -- 'PLAN GUIDE' 
    pg.name, '$.Attributes.plan_guide.' + pg.name,
    Coalesce (Convert (NVARCHAR(3870), ep.value), '')
    FROM
    sys.plan_guides pg
      LEFT OUTER JOIN sys.extended_properties ep
        ON ep.class = 27
       AND ep.major_id = pg.plan_guide_id
       AND ep.name = 'MS_Description';
GO


Conclusion

If you are like me, you will tend to do ad-hoc searching via SQL Calls that are written for the immediate purpose. They aren’t always good for their purpose and I weas inspired to write this so as to be able to do path-based searches and to be able to see the comments (extended properties.) It is based various routines I’d needed for another purpose so it is good to pull it all into shape for this function and view.


The post Searching through a database via SQL appeared first on Simple Talk.


from Simple Talk https://ift.tt/VeCMIgG
via

Monday, June 27, 2022

Parameterizing Azure Policy and Ensuring Azure SQL AD Authentication

I wrote before about enforcing Azure SQL AD Authentication using Azure Policies in two different ways. First, only auditing if the Azure SQL is using AD Authentication or not. Later, automatically enabling the AD Authentication on Azure SQL Servers where this authentication is not enabled.

What about if we could create one single policy definition and let each IT department in your company decides if the policy will only audit the non-compliance SQL or if they would like to fix them automatically ?

We can parameterize our policy and the policy effect, leaving the choice to the moment of the assignment.

The first thing we need to do is to carefully plan the effects we would like the policy to accept. Audit and Deny are two effects easy to combine, because they don’t have additional parameters. DeployIfNotExists, on the other hand, uses additional parameters, such as existanceCondition. Combining the DeployIfNotExists with the Audit may have bad results, failing the evaluation in one or the other case. Luckily, we have the AuditIfNotExists. We can combine DeployIfNotExists with AuditIfNotExists to get a good result.

The new policy with the effect parameter definition appers like this:

{
   "parameters":{
      "effect": {
         "type": "String",
         "metadata": {
           "displayName": "Effect",
           "description": "Enable or disable the execution of the policy"
         },
         "allowedValues": [
           "DeployIfNotExists",
           "AuditIfNotExists",
           "Disabled"
         ],
         "defaultValue": "DeployIfNotExists"
       }
  },
   "policyRule":{
      "if":{
         "allOf":[
            {
               "field":"type",
               "equals":"Microsoft.Sql/servers"
            }
         ]
      },
      "then":{
         "effect": "[parameters('effect')]",
         "details":{
            "type":"Microsoft.Sql/servers/azureADOnlyAuthentications",
            "roleDefinitionIds":[
               "/providers/Microsoft.Authorization/roleDefinitions/056cd41c-7e88-42e1-933e-88ba6a50c9c3",
               "/providers/Microsoft.Authorization/roleDefinitions/8e3af657-a8ff-443c-a75c-2fe8c4bcb635"
            ],
            "existenceCondition":{
               "allOf":[
                  {
                     "field":"Microsoft.Sql/servers/azureADOnlyAuthentications/azureADOnlyAuthentication",
                     "equals":true
                  }
               ]
            },
            "deployment":{
               "properties":{
                  "mode":"incremental",
                  "name":"Default",
                  "template":{
                     "$schema":"https://schema.management.azure.com/schemas/2015-01-01/deploymentTemplate.json#",
                     "contentVersion":"1.0.0.0",
                     "parameters":{
                        "fullServerName":{
                           "type":"string"
                        }
                     },
                     "resources":[
                        {
                           "name":"[concat(parameters('fullServerName'), '/Default')]",
                           "apiVersion":"2021-02-01-preview",
                           "type":"Microsoft.Sql/servers/azureADOnlyAuthentications",
                           "properties":{
                              "azureADOnlyAuthentication":true
                           }
                        }
                     ]
                  },
                  "parameters":{
                     "fullServerName":{
                        "value":"[field('name')]"
                     }
                  }
               }
            }
         }
      }
   }
}


Policy Assignment

The difference will happen when assigning the policy. We will be able to choose which effect we would like to use, AuditIfNotExists or DeployIfNotExists.


In a world wide company, or a company spread across multiple branches, the cloud environment can be organized in multiple management groups and subscriptions. For each Management Group and Subscription the company may have an IT team responsible for it, taking the decisions about how to manage that specific set of projects and cloud services.

This would be similar to my own personal organization you can see on the image below:

That’s the benefit of a parameterized policy: Each IT team can make their own decision about how to manage their area of cloud services.


The post Parameterizing Azure Policy and Ensuring Azure SQL AD Authentication appeared first on Simple Talk.


from Simple Talk https://ift.tt/ALUfZSk
via

Wednesday, June 22, 2022

Mighty Tester: Analysis Paralysis

Image showing comic strip. Tester is at the computer and sees a message. "What do you mean? I don't understand the question. That makes zero sense... Before we can answer that, we must first define...BLAH...BLAH... Actually, do you know the origin of the word was...BLAH...BLAH...BLAH...BLAH. Gotta go. Next meeting, bye." She then says to herself All I asked was "Did you enjoy your sunny weekend?"

Commentary Competition

Enjoyed the topic? Have a relevant anecdote? Disagree with the author? Leave your two cents on this post in the comments below, and our favourite response will win a $50 Amazon gift card. The competition closes two weeks from the date of publication, and the winner will be announced in the next Simple Talk newsletter.

The post Mighty Tester: Analysis Paralysis appeared first on Simple Talk.


from Simple Talk https://ift.tt/gwbm9eD
via

Thursday, June 16, 2022

Introducing the MySQL SELECT statement

The series so far:

  1. Getting started with MySQL
  2. Working with MySQL tables
  3. Working with MySQL views
  4. Working with MySQL stored procedures
  5. Working with MySQL stored functions

Up to this point in the series, I’ve focused primarily on creating schema objects in a MySQL database. The SQL statements used to create these objects are typically categorized as data definition language (DDL). They include statements such as CREATE TABLE, CREATE VIEW, and CREATE PROCEDURE.

Beginning with this article, I’m switching my attention to data manipulation language (DML), which includes statements used to query and modify data. Four of the most common DML statements are SELECT, INSERT, UPDATE, and DELETE. You can use the SELECT statement to retrieve data, the INSERT statement to add data, the UPDATE statement to modify data, and the DELETE statement to remove data.

In this article, I focus on the SELECT statement, which is used extensively when working with relational databases. You can use the SELECT statement to return data from one or more MySQL tables, as well as to retrieve information about the server and database environment. The SELECT statement is one of the most commonly used SQL statements in MySQL. It is also one of the most complex.

You got a taste of the SELECT statement in earlier articles in this series, but it was included only to support the DDL examples in those articles. This article focuses exclusively on the SELECT statement and the basic elements that go into building one. I’ll be covering other DML statements later in this series.

Preparing your MySQL environment

For the examples in this article, I used the same database (travel) that you saw in the previous articles and the same two tables (manufacturers and airplanes). However, I added a lot more data this time around. If you want to try out the examples for yourself, you can download the MySQL_06_setup file and run it against your MySQL instance. The SQL in the file creates the database, adds the two tables, and inserts data in both tables.

For your convenience, I’ve included the two table definitions here so you can reference them when trying out the SELECT statements in the examples later in the article:

CREATE TABLE manufacturers (
  manufacturer_id INT UNSIGNED NOT NULL AUTO_INCREMENT,
  manufacturer VARCHAR(50) NOT NULL,
  create_date TIMESTAMP NOT NULL DEFAULT CURRENT_TIMESTAMP,
  last_update TIMESTAMP NOT NULL 
    DEFAULT CURRENT_TIMESTAMP ON UPDATE CURRENT_TIMESTAMP,
  PRIMARY KEY (manufacturer_id) ) 
ENGINE=InnoDB AUTO_INCREMENT=1001;
CREATE TABLE airplanes (
  plane_id INT UNSIGNED NOT NULL AUTO_INCREMENT,
  plane VARCHAR(50) NOT NULL,
  manufacturer_id INT UNSIGNED NOT NULL,
  engine_type VARCHAR(50) NOT NULL,
  engine_count TINYINT NOT NULL,
  max_weight MEDIUMINT UNSIGNED NOT NULL,
  wingspan DECIMAL(5,2) NOT NULL,
  plane_length DECIMAL(5,2) NOT NULL,
  parking_area INT GENERATED ALWAYS AS ((wingspan * plane_length)) STORED,
  icao_code CHAR(4) NOT NULL,
  create_date TIMESTAMP NOT NULL DEFAULT CURRENT_TIMESTAMP,
  last_update TIMESTAMP NOT NULL 
    DEFAULT CURRENT_TIMESTAMP ON UPDATE CURRENT_TIMESTAMP,
  PRIMARY KEY (plane_id),
  CONSTRAINT fk_manufacturer_id FOREIGN KEY (manufacturer_id) 
    REFERENCES manufacturers (manufacturer_id) ) 
ENGINE=InnoDB AUTO_INCREMENT=101;

If you already have the database and tables on your MySQL instance and don’t want to re-create them, you can run just the INSERT statements in the MySQL_06_setup.sql script. However, you should first delete any data in the table because the data being added to the airplanes table references specific values in the manufacturers table. Starting with empty tables will also ensure that you’re seeing the same results as in my examples. When you run the INSERT statements, be sure to execute them in the order specified in the file.

The SELECT statement syntax

A MySQL SELECT statement is typically used to retrieve data from a single table or from multiple tables. The statement is made up of one or more clauses that together provide the logic needed to retrieve the necessary data. The statement’s syntax is fairly elaborate, but to help you get started, I’ve narrowed it down to the most fundamental elements:

SELECT [ALL | DISTINCT] select_list 
[FROM table_ref] 
[WHERE where_condition] 
[GROUP BY group_list] 
[HAVING having_condition]
[ORDER BY order_list]

The five clauses shown in the syntax are highly versatile and can be used to build a wide range of statements:

  • The SELECT clause is the only required clause in a SELECT statement. The clause typically specifies the columns from which to retrieve data from the target table or tables, but it can also be used to return the results of an expression, such as a system function or calculation.
  • The FROM clause specifies the target table or tables from which to retrieve data. If you specify multiple tables, you are performing a join.
  • The WHERE clause acts as a filter that limits the rows returned by the query. The clause defines one or more search conditions that must evaluate to true for a row to be returned. Multiple search conditions are linked together with logical operators that determine how to apply those conditions.
  • The GROUP BY clause groups the data based on one or more specified expressions, which are typically columns in the target tables.
  • The HAVING clause is similar to the WHERE clause because it defines one or more search conditions that limit the results. However, the HAVING clause is specific to grouped data and is processed after the GROUP by clause.
  • The ORDER BY clause sorts the data based on one or more specified expressions, which are typically the columns in the target tables.

There are a number of other clauses and options that I have not included here, and they are also important to understand, but for now, these five clauses provide a good starting point for learning how to use a SELECT statement to query a database.

The SELECT clause

At a minimum, the SELECT clause requires the SELECT keyword and the select list, which is made up of one or more expressions. An expression can be a column name, calculation, function, subquery, literal value, or other construction. The select list commonly includes columns from the tables referenced in the FROM clause (if one is included).

Unlike the other clauses in the SELECT statement, the SELECT clause can stand on its own to create a very simple statement. For example, the following SELECT statement includes only the SELECT clause, and the select list within that clause includes only one expression:

SELECT CURRENT_TIMESTAMP;

The expression, in this case, is the CURRENT_TIMESTAMP function, which returns the current date and time. If you run this statement, MySQL returns a single value that contains both the date and time in a format that depends on your location and server settings. For example, when I ran the statement, I received the following results:

2022-06-03 15:03:13

As you can see, a SELECT statement can be fairly basic, as long as it includes the SELECT clause and a select list with at least one expression.

The FROM clause

The FROM clause references the table or tables that contain the source data. Although it is an optional clause, most SELECT statements include the FROM clause. If you are targeting only one table, you need only specify the FROM keyword, followed by the table name. For example, the following SELECT statement retrieves data only from the airplanes table:

SELECT * FROM airplanes;

Notice that the SELECT clause specifies only an asterisk for the select list. In MySQL, like many relational database systems, you can use an asterisk to indicate that all columns should be returned from the table or tables referenced in the FROM clause, which in this case, points only to the airplanes table. Figure 1 shows part of the results returned by this statement. In all, the query should return 241 rows.

Table Description automatically generated 
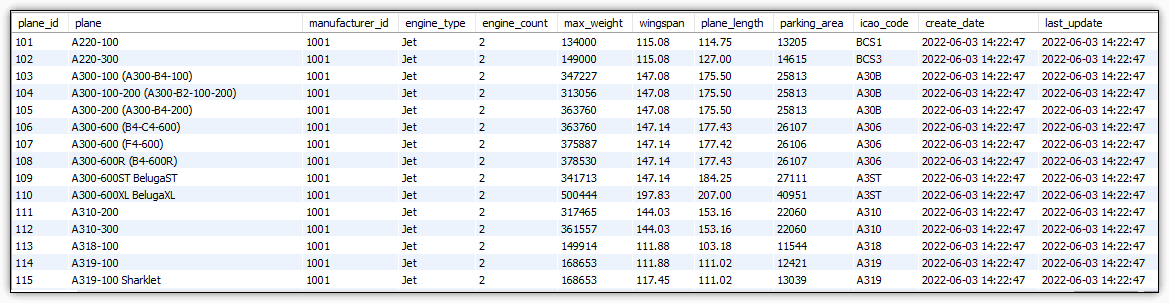
Figure 1. Retrieving all rows and columns from the airplanes table

The SELECT statement in the preceding example demonstrates the basic construction needed to return all rows and columns from a table. However, you can narrow down your SELECT clause by specifying the exact columns to return. For example, the following SELECT statement returns the plane, engine_type, and engine_count columns from the airplanes table:

SELECT plane, engine_type, engine_count
FROM airplanes;

Notice that the expressions (column names) in the select list are separated with commas, but there is no comma after the SELECT clause itself. The SELECT statement still returns 241 rows from the airplanes table; however, the results now include only these three columns, as shown in Figure 2.

An image showing the query results. Columns plane, engine_type, engine_count

Figure 2. Retrieving specific columns from the airplanes table

You can refine your select list even further when retrieving data from the target table. For example, the select list in the following SELECT statement uses the ROUND system function to round the wingspan value to the nearest integer:

SELECT plane, ROUND(wingspan) AS wingspan_rnd
FROM airplanes;

The wingspan column is passed in as an argument to the ROUND function, which is followed by the AS keyword and then by the wingspan_rnd alias. The alias is assigned to the output column generated by the ROUND function, as shown in Figure 3. When assigning a column alias, you can omit the AS keyword, but it can be useful to retain for clarity.

An image showing the query results. Columns plane and wingspan_rnd

Figure 3. Using a system function in a select expression

The SELECT statement still returns 241 rows from the airplanes table, but now it includes only the plane and wingspan_rnd columns. As you can see from the examples in the section, the SELECT clause works hand-in-hand with the FROM clause in determining what column data to return. However, the FROM clause itself remained unchanged in all these examples. When a FROM clause is included in a SELECT statement, it serves as the foundation on which the rest of the SELECT statement is built.

The WHERE clause

In the previous section, you saw how the SELECT clause can be used to limit the columns returned from the table specified in the FROM clause. The WHERE clause is similar in this respect, except that it is used to limit the rows returned from the target table.

When defining the WHERE clause, you need to specify at least one search condition, which must evaluate to true for a row to be returned. For example, the following SELECT statement includes a WHERE clause that limits the returned rows to those with an engine_type value that equals turboprop:

SELECT plane, ROUND(wingspan) AS wingspan_rnd
FROM airplanes
WHERE engine_type = 'turboprop';

The WHERE clause search condition (engine_type = 'turboprop') states that the engine_type value must equal turboprop for a row to be returned. The expression uses the equal (=) comparison operator to compare the engine_type value to the turboprop string. If they are equal, the search condition evaluates to true, and the row is returned.

Figure 4 shows part of the results that the statement returns. The result set now includes only 26 rows because only those rows satisfy the search condition.

An image showing the query results with columns plane and wingspan_rnd

Figure 4. Using a WHERE clause to filter data

When you add a WHERE clause to your SELECT statement, you can define multiple search conditions. For example, the following SELECT statement again includes a WHERE clause, but this time it specifies that the engine_type value must equal turboprop and that the max_weight value must be greater than 10000:

SELECT plane, ROUND(wingspan) AS wingspan_rnd
FROM airplanes
WHERE engine_type = 'turboprop' AND max_weight > 10000;

The second search condition uses the greater than (>) operator rather than equal, but the basic concept is the same in terms of filtering data. However, notice that the two search conditions are connected by the AND logical operator. This means that both search conditions must evaluate to true for a row to be returned. Figure 5 shows the results after running the SELECT statement, which now returns only 15 rows.

An image showing the query results with columns plane and wingspan_rnd

Figure 5. Defining multiple search conditions in a WHERE clause

MySQL supports several types of logical operators. Although the AND operator is commonly used, you might want to define different logic. For example, you can use an OR operator to indicate that either of the two search conditions must evaluate to true, but not necessarily both. You can also string together more than two search conditions, but you need to be sure to implement the logic correctly, or you risk incorrect results. For more information about using logical operators, check out the MySQL documentation.

The ORDER BY clause

The ORDER BY clause lets you sort the results returned by your SELECT statement. You can specify one or more expressions, which are typically columns. You can also define the sort order as either ASC (ascending) or DESC (descending). For example, the following SELECT statement is the same as the preceding one except that it now includes an ORDER BY clause that sorts the results by the wingspan_rnd column, in descending order:

SELECT plane, ROUND(wingspan) AS wingspan_rnd
FROM airplanes
WHERE engine_type = 'turboprop' AND max_weight > 10000
ORDER BY wingspan_rnd DESC;

Figure 6 shows the results returned by this statement. As you can see, you can use a column alias defined in the select list within your ORDER BY clause.

An image showing the query results with columns plane and wingspan_rnd

Figure 6. Sorting the results by the wingspan_rnd column

When using an ORDER BY clause, you might discover that some values are duplicated. For example, the above results show that several planes have a wingspan of 55 feet and several others are 50 feet. In some cases, you might want to return a single column so you can view its range of values, such as in the following example:

SELECT ROUND(wingspan) AS wingspan_rnd
FROM airplanes
WHERE engine_type = 'turboprop' AND max_weight > 10000
ORDER BY wingspan_rnd DESC;

Now the SELECT statement returns only the wingspan_rnd column, as shown in Figure 7.

An image showing the query results with column wingspan_rnd

Figure 7. Returning a single column

If all you’re after is a range of values and don’t want the duplicate values, you can add the DISTINCT keyword to your SELECT clause. You might do this, for example, to populate an application’s drop-down list. The following SELECT statement uses DISTINCT to remove the duplicates in the wingspan_rnd column:

SELECT DISTINCT ROUND(wingspan) AS wingspan_rnd
FROM airplanes
WHERE engine_type = 'turboprop' AND max_weight > 10000
ORDER BY wingspan_rnd DESC;

Figure 8 shows the results of running the SELECT statement with DISTINCT included. Now the statement returns only eight rows, and each row is unique.

An image showing the query results with column wingspan_rnd

Figure 8. Removing duplicate rows

The SELECT clause supports both the DISTINCT and ALL options. As you have seen, the DISTINCT option species that all duplicate rows should be removed from the result set. The ALL option specifies that all rows should be returned. This is the default, so you do not need to include it.

Joining tables in the FROM clause

When retrieving data from a MySQL database, you might want to pull the data from multiple tables, in which case you can create a join that effectively merges the results from both tables together. MySQL, like other relational database systems, supports multiple ways to join tables, although they don’t necessarily approach joins in the same way.

When you’re first getting started with MySQL joins, it’s important to know that most joins fall into one of two basic categories:

  • Inner joins. Matches one or more columns in two tables and returns all rows with matching values.
  • Outer joins. Matches one or more columns in two tables and returns all rows with matching values, but also returns the non-matching rows from either the left table (left outer join) or the right table (right outer join).

The best way to understand how a join works is to see one in action. In the following example, I join the airplanes and manufacturers tables based on the manufacturer_id column in both tables:

SELECT m.manufacturer, a.plane, a.engine_type, 
  a.engine_count, a.parking_area
FROM airplanes a INNER JOIN manufacturers m
  ON a.manufacturer_id = m.manufacturer_id
WHERE a.parking_area > 1000 AND max_weight > 10000
ORDER BY a.parking_area DESC, m.manufacturer, a.plane;

This statement creates an inner join, as indicated by the INNER JOIN keywords in the FROM clause (in between the two table names). The FROM clause also includes the ON subclause, which specifies that the manufacturer_id value in the manufacturers table must equal the manufacturer_id value in the airplanes table.

Because this is an inner join, MySQL will find all the rows with matching manufacturer_id values. You must make sure that your column references in any of the SELECT statement clauses are not ambiguous in any way, which can occur if the two tables contain columns with the same name, as in manufacturer_id. This includes the FROM clause itself.

The easiest way to address any ambiguity is to assign aliases to the table names and then use those aliases when referencing the columns in the rest of the statement. For example, the FROM clause assigns the alias a to airplanes, so all column references are preceded by an a, followed by a period, and then followed by the column name.

Figure 9 shows part of the results returned by the SELECT statement, which includes 152 rows in all.

An image showing the query results with columns manufacturer, plane, engine_type, engine_count, parking_area

Figure 9. Creating an inner join between two tables

There is much more to joins than what I’ve shown you here, but this should at least give you a sense of how they work until we can spend more time on them. In the meantime, you might want to check out the MySQL documentation on joins. The information can be a little difficult to weed through, but it might help you better understand how they work.

The GROUP BY clause

Another important clause in the SELECT statement is GROUP BY, which makes it possible to group and aggregate data in the target tables. The clause requires at least one expression in addition to the GROUP BY keywords. The expression is usually one of the columns in the target tables. For example, the following SELECT statement includes a GROUP BY clause that groups the data based on the manufacturer_id column in the manufacturers table:

SELECT m.manufacturer, COUNT(*) AS plane_cnt
FROM airplanes a INNER JOIN manufacturers m
  ON a.manufacturer_id = m.manufacturer_id
WHERE max_weight < 1000000
GROUP BY m.manufacturer_id
ORDER BY plane_cnt DESC;

When using a GROUP BY clause, you typically limit the columns in the select list to those included in the GROUP BY clause or to those derived from aggregate expressions. This example does both.

The select list includes the manufacturer_id column, which is also referenced in the GROUP BY clause. The select list also includes the COUNT(*) aggregate function, which returns the total number of rows in each group. The COUNT function is a special type of function that takes an asterisk as its argument. The function provides a simple way to return the total number of rows (number of airplanes) for each manufacturer group. Figure 10 shows the statement’s results.

An image showing query results with columns manufacturer and plane_cnt

Figure 10. Grouping data

As you can see, the results show the total number of planes associated with each manufacturer. You can also group the data based on more than one column. For example, the GROUP BY clause in the following SELECT statement groups the data first by manufacturer_id and then by engine_type:

SELECT m.manufacturer, a.engine_type, COUNT(*) AS plane_cnt
FROM airplanes a INNER JOIN manufacturers m
  ON a.manufacturer_id = m.manufacturer_id
WHERE max_weight < 1000000
GROUP BY m.manufacturer_id, a.engine_type
ORDER BY m.manufacturer ASC, a.engine_type ASC;

The select list has also been updated to include the engine_type column, which is now in the GROUP BY clause. Figure 11 shows the results returned by the SELECT statement.

An image showing query results with columns manufacturer, engine_type, plane_cnt

Figure 11. Grouping data by multiple columns

The results now show the total number of airplanes for each engine type from each manufacturer. However, this time the results are sorted first by the manufacturer values and then by the engine_type values.

Working with the SELECT statement

The five clauses I’ve covered here—SELECT, FROM, WHERE, ORDER BY, and GROUP BY—can provide you with a good foundation for getting started with SELECT statements. With these five clauses, you can build very precise queries that retrieve exactly the data you need from your MySQL databases.

That said, this article only skims the surface of the SELECT statement. There is much more to each clause, and there are additional clauses. In fact, a full discussion of the SELECT statement could easily fill an entire volume—if not more. But this information should at least provide you with a launching off point. Just know that there is much more to the MySQL SELECT statement than can be described in a single article.

The post Introducing the MySQL SELECT statement appeared first on Simple Talk.


from Simple Talk https://ift.tt/vM7DZNY
via

Friday, June 3, 2022

The ultimate guide to web accessibility

An images showing a desktop with a laptop sitting on it. Above it says Web Accessibility

You brought cake for your family party but forgot to bring a vegan cake for Aunt Kara. You tell her, “Sorry, but I guess you can’t have any cake today.” Aunt Kara is upset, and she would think twice before coming to any future family gatherings hosted by you. This is how people with disabilities feel when they visit inaccessible websites. They are invited to a party where they cannot enjoy cake.  Making your website accessible for people with disabilities allows for an inclusive experience, allowing them to have their cake and eat it, too. This article will visit basic topics concerning web accessibility and guide you towards charting an inclusive path for your organization.

What does web accessibility mean?

Web accessibility, which is also known as digital accessibility, is a practice that involves removing or preventing any barriers that users may face while accessing or interacting with a web application.

Why should you care about web accessibility?

A girl staring at a blackboard above which contains the word: Why?

Did you know that it’s estimated that over 1 billion people around the world have some form of disability? Many people with disabilities often face significant difficulties while performing day-to-day activities. Fortunately, the advent of the internet and the availability of umpteen websites and apps help users with disabilities to perform their tasks easily. However, if websites and apps are not accessible, they are just becoming a part of the problem rather than the solution.

An accessible website helps create an all-inclusive environment where all users have equal access to information and functionality.

Here are some benefits of having an accessible website

  • Enhanced user experience
  • Broadens your audience reach
  • Boosts your SEO
  • Builds positive PR
  • Protects you against accessibility lawsuits

How is web accessibility enforced?

Closeup Shot of a Person Holding a Gavel on the Table

Now that you understand why web accessibility is important, the next step is to understand who enforces or manages web accessibility.

The World Wide Consortium or W3C is an internet community that develops open standards that ensure that the web attains its complete potential. In 1997, the W3C launched an initiative known as the Web Accessibility Initiative (WAI) ,which is focused on guiding people to build more accessible websites.

The WAI consists of industry, disability organizations, government, accessibility research organizations, and much more. They worked together and developed Web Content Accessibility Guidelines (WCAG).

The WCAG is a globally accepted standard that guides developers and organizations in building an accessible website.

Web accessibility standards to follow

A typical study table that contains folders standards and rules stacked on top of each other

The WCAG (Web Content Accessibility Guidelines) is the international standard for web accessibility. The WCAG recommends focusing on four main principles while building an accessible website. You can easily remember by their acronym POUR:

Perceivable(P)

Make the content on your website available to users in how they perceive information. In other words, make sure that your content can be perceived or recognized by multiple senses instead of just focusing on one sense.

For example, if there is an image on your website, make sure that users with vision impairments can access it by providing appropriate alt text so their screen readers can announce the image description.

Operable(O)

Make sure that all users can access all functions or are able to operate all controls on your website.

For example, if there is a video on your website, ensure that users can play, pause or stop the video even through a keyboard rather than using only a mouse to access the controls.

Understandable(U)

Keep it simple, i.e., users should easily understand the content on your website. Furthermore, ensure that users easily understand how to operate any functions of the interface elements.

For example, if there is too much jargon on your website, then it is difficult for users who are not aware of it to understand the content.

Robust(R)

The website content should be compatible with Assistive Technologies (AT) as the users with disabilities use them to access your website.

For example, if the content of your website is optimized for only one type of AT, it will deny others who are using a different technology.


Before jumping into the most common web accessibility issues, first try to understand the barriers faced by users with disabilities. Here are some of the common barriers

  1. Auditory: Users have partial or complete hearing loss, making it difficult for them to consume knowledge from content that relies on audio to convey the message
  2. Visual: Users have low vision, color blindness, or sometimes total vision loss which makes it difficult for them to consume knowledge for images, videos, gifs, etc.
  3. Motor: Users have partial or total loss of function in a body part such as limbs, making it difficult for them to navigate websites or complete tasks using devices such as a mouse
  4. Cognitive: Users have difficulty concentrating, learning, or remembering new things which makes it difficult for them to fill out forms if they don’t have clear instructions

Furthermore, some barriers may arise due to certain situations. For example, a user living in a cold region such as Alaska, where the average winter temperature is 20 to −10 °F (−7 to −23 °C), may sometimes rely on voice-activated commands as taking off their gloves might cause frostbite due to the cold weather.

Note: This is not the complete list of disabilities. However, they are the most common forms of disabilities that come under WCAG.

Here are the five most common accessibility issues to avoid

A signboard that reads: 5 common accessibility issues

Color and contrast

Some users may not comprehend the content if color is solely used to convey crucial information. Users with low eyesight or who use screen readers, for example, will not be able to differentiate colors and therefore may not understand the information as the author intended.

Use a color that meets the WCAG color contrast requirements, a visible focus, and a hover highlight to work towards achieving maximum accessibility.

Make sure there is adequate contrast between the background and foreground colors while designing. WCAG recommends a minimum contrast ratio of 4.5:1 for text and images and at least 3:1 for large text and images.

:

If you are unsure about contrast ratio or color schemes, fret not, I have got you covered. Here is my favorite tool to check color contrast on websites.

Screengrab of WebAim website

Images

Users with vision impairments have difficulties understanding the information if it is conveyed only through images. The WCAG recommends organizations or developers provide an alternative to images known as Alt-text.

Alt-text is a brief summary of the information conveyed through the image. The alt-text provided must be precise and convey all the relevant information to users. If the image used is purely for decorative purposes, then mark the image as decorative.

Two images. First: "Almost had a heart attack this morning" there is tiger next to the fence. Second: Moving closer, it's a dog with shadows from the fence.

Here is an example of how to write alt-text for the above image

Bad Alt-text: Tiger sleeping on a sidewalk

Good Alt-text: A dog lying on the sidewalk in front of a gate with the striped shadow of the rails falling on its back, making it appear as a tiger

Videos

Videos on the website should include captions so that it is easier for people with hearing impairments to easily understand the content. Furthermore, you can also provide an extended text description if the captions in the video are insufficient to convey the information.

Avoid using gifs or animations that have flashing lights or contrasting light and dark patterns that might trigger photosensitive epilepsy.

Tip: You can generate free captions for your videos by using websites like Youtube, Descript, etc.

Forms and labels

In order to help individuals fill out forms quickly, the usage of placeholder text is very common. Unfortunately, if placeholders are used entirely to designate form fields, it causes three issues.

  • Due to the poor or low color contrast, people with low vision may not be able to notice the placeholders as clearly as sighted users.
  • The keyboard is typically used by screen reader users to traverse the form fields. The screen reader will not announce the field requiring user input if the <label> tag is missing from the form field.
  • The tab order should be such that keyboard navigation is simple and that each field important to completing the form has labels.

Links

Many websites use links to guide users to a different web page or to provide sources of the acclaimed fact. Since links guide users to a different page, it might cause panic among users, especially people with vision impairments if they are not notified. Here is how you can make links accessible:

  • Notify users about the link’s destination so that they won’t panic if it is an accidental activation.
  • Avoid using words like “click here,” “read more,” etc., as they don’t make sense when read out of context.
  • Make sure that the links are accurate and descriptive so that users can easily understand the purpose behind the links.

For example, say you want to redirect your visitors to the Amazon website

Bad way to write links: To learn more about the product click here.

Good way to write links: To learn more about the product visit the Amazon website

Best free web accessibility testing tools

A person analyzing a program

Accessibility testing ensures that a website is user-friendly for everyone, including people with disabilities. A testing tool is your guardian angel that can conduct extensive testing and generate comprehensive reports that update you on the current accessibility status of the website.


WAVE

WAVE is a free accessibility evaluation tool developed by WebAIM.org that aids in the creating accessible content on websites. WAVE analyzes and matches content against the WCAG guidelines and provides you with a comprehensive visual report that contains all the accessibility violations.


Cynthia Says

The next one on the list is Cynthia Says, fun fact, Cynthia was developed to raise more awareness about web accessibility testing and its importance. The tool allows you to check the accessibility of every page and provides detailed feedback about the accessibility errors present on the pages.


Accessibility Checker by CKSource

The Accessibility Checker is extremely flexible and has one of the most user-friendly UI. It will assist you in inspecting all the compliance errors on the page and also can fix common accessibility issues with its “Quick Fix” function.


LERA

LERA is an automated web accessibility testing and reporting tool that provides you with a detailed report of your website’s accessibility issues. It can evaluate websites based on the WCAG 2.1 accessibility guidelines to identify the violations and suggest potential fixes.

LERA is the only fully automated web accessibility extension that provides both Accessibility Audits and Accessibility Reports for free.

There are many more tools available online that are free as well paid. Although these tools can recognize many accessibility issues, one must understand that the tools can only find up to 20% of accessibility errors. Organizations should try to have an in-house accessibility expert or outsource it to others to be on track towards the path of maximum accessibility.

Accessible website examples to inspire you

First, the W3C.

Screengrab of W3C website, an example of web accessibility

Can you imagine Domino’s not selling pizzas?

Exactly! It would be ironic if the community that developed the WCAG guidelines did not follow them. W3C is the greatest example of an accessible website. It also contains web accessibility guidelines and best practices that guide other websites to become more accessible.


The ACLU

Screengrab of ACLU website, an example of web accessibility

According to Wikipedia, the American Civil Liberties Union (ACLU) is a nonprofit organization founded in 1920 “to defend and preserve the individual rights and liberties guaranteed to every person in this country by the Constitution and laws of the United States.

In short, ACLU fights to preserve the rights of individuals as guaranteed by the Constitution and also files cases against discrimination of oppressed groups.

The ACLU website carefully uses structural elements such as headings, lists, header and footer, and navigational elements and ensures it is accessible to all users. It also provides an option to turn off the autoplay of the image slideshow and much more.

The World Wildlife Fund

Screengrab of WWF website, an example of web accessibility

The World Wildlife Fund or WWF conveys all the information such as its mission, initiatives, educational content, etc., in an accessible way. It also does not overload its web pages with content, which extremely benefits, the navigation and, in turn, boosts accessibility.

The world is constantly changing, and people depend on technology now more than ever. Therefore, it is essential for organizations to create web or mobile applications that offer more support to users with disabilities.

The ultimate guide to web accessibility

Think about it, how would you feel if there was an office chat group with everyone except you? It would make you feel bad, right? Furthermore, having an accessible digital application will help you avoid legal penalties. Lastly, make sure that your services are accessible to everyone regardless of their disabilities; it will not only boost the confidence of disabled people but also help them have a better quality of life.


The post The ultimate guide to web accessibility appeared first on Simple Talk.


from Simple Talk https://ift.tt/VKar3dg
via

Metrics that matter for IT organizations on an agile journey

Key Takeaways

  • Having a set of good metrics is essential for the success of agile teams and IT organizations.
  • Metrics are not numbers to beat. Understanding the value delivered by monitoring any metric is important for the team to truly embrace them.
  • A balance of six dimensions – Business delivery excellence, Operational excellence, Technical excellence, Innovation, Happiness, and Financial excellence is essential for the success of agile teams and IT organizations.

As IT organizations move towards an agile way of functioning, it is natural that teams undergo a major learning curve to understand and adapt to agile principles. It is also natural at this stage that teams lose focus on the “things that matter” to the top and bottom lines of the organization as their focus is more on adjusting and settling down in the new way of working. It is at this juncture that a set of “good metrics” would help teams navigate in the right direction. It is worthwhile to note that the standard agile tools like JIRA, Git, Jenkins, etc., provide a standard set of metrics. Teams should consider these as a starting point and continue to define further metrics that make sense to their team as well as the organization that they are part of. Rather than looking at metrics as a number to beat or something imposed by management, it is important that the teams understand the organization’s objectives and how metrics can help them to continuously improve while meeting the organization’s objectives. This article looks at what should typically be the dimensions on which IT organizations assess and fine tune their team performances and processes and how should the individual teams tailor their metrics to contribute to the overall IT organization goals.

Factors that are critical for the success of organizations of any nature or size are productivity, agility, predictability of the outcomes, quality of the work, and the happiness of the teams.

An IT organisation should focus on the following dimensions so that it is able to support the business, mission and vision of the organization.

  • Business delivery excellence
  • Operational excellence
  • Technical excellence
  • Innovation
  • Happiness of the teams
  • Financial excellence

While the CEO, CTO, and CIO establish objectives and key results around these dimensions, the various agile teams should establish OKRs at their team level that are aligned with and contribute to the organization level OKRs. Let us further look at what should be measured (metrics) at both an IT organization level and individual team level. At the onset, it is important to note that these metrics should not be used to compare one member against another or one team against another. They should rather be looked at holistically in the right spirit to identify areas of improvement, ultimately leading to truly agile teams.

1. Business delivery excellence

In simple terms, business delivery excellence objectively looks at how well the IT organization’s deliveries and outcomes are aligned to the business strategy. To successfully measure and improve business delivery excellence, IT organizations should have the means to measure alignment, agility, and predictability of the organization and teams within.

The set of metrics that would provide a good insight into business delivery excellence are as follows:

1.1 Alignment of IT team efforts to strategic business initiatives

The purpose of this metric is to provide visibility into

  1. The alignment of IT projects with strategic business initiatives
  2. Whether enough resources and funds are being invested to support business initiatives
  3. Whether there any projects/efforts that should be stopped or slowed down

At a team level, the following metrics should be used to report towards this organization metric.

  • Percentage of business requests accepted and committed for delivery by the team

This metric helps establish a dialogue between management and teams on identifying and addressing the root causes due to which team is able to commit only a set of business demands or to understand what the team is sacrificing to commit to business demands.

  • Team effort spread on strategic initiatives vs. technical upgrades vs. support requests
  • Team effort spread on the various strategic initiatives

The above two metrics help understand if sufficient resources are assigned to business initiatives and if there are any specific areas that the teams should divert their focus away from and towards strategic business initiatives. It also gives visibility into whether the team is spending too much of its efforts in handling routine upgrades or business-as-usual kind of support requests, which can then feed into identifying areas of automation that can reduce the need for such maintenance efforts.

1.2 Agility of IT organization in catering to business needs

The purpose of this metric is to provide visibility into how quickly the IT organization can adapt to the changing business needs and is also an indicator of how fungible IT teams are.

At a team level, following metrics should be used to report towards this organization metric.

  • Lead and cycle time to deliver new features to existing products or services
  • Lead and cycle time to deliver new products or services

These metrics give important insights into how fast a request is getting picked up by the team and how long it takes for the team to complete a request and deliver value after starting to work on the request.

Longer lead times indicate that there is either a long cycle time or a long time the request is waiting to be picked by the team. These metrics help establish a dialogue on identifying and addressing the root causes for the long lead or cycle times.

1.3 Predictability of IT deliveries

The Agile Alliance defines “Agile processes promote sustainable development. The sponsors, developers, and users should be able to maintain a constant pace indefinitely.” as one of the principles based on the Agile Manifesto. A regular cadence of working software delivery is essential to build trust with customers. This metric helps the management and teams to measure and assess the predictability of releases and establish how confident they could be of the cadence vis-a-vis actions needed to fix any issues.

  • Team velocity variation measures how team velocity is varying over a period of time. Agile teams generally reach a near-constant velocity after a few sprint cycles. Any large deviations in the velocity are an indicator that there is a high chance of not meeting the commitments. Now the cause for such a deviation need not always be due to team inefficiencies. This could also happen when the team decides to implement pair programming or is learning new technology, all valid reasons that would ultimately improve team performance. Having this metric in place helps the team and management to align on the reasons why predictability could be impacted and stakeholder it appropriately with customers.
  • Planned to Done ratio measures the work that the team completes by the end of the sprint compared to the work the team committed to at the start. While there could be many valid reasons for work to spill over into the next sprints, a view of this ratio over a number of sprints would give a general idea of the estimation accuracy of the team and the predictability of their commitments. A review of this metric provides the team an opportunity to fine-tune the estimation rules they follow.

2. Operational excellence

The Institute for Operational Excellence defines operational excellence as a point in the organization’s continuous improvement journey where each and every employee can see the flow of value to the customer, and fix that flow before it breaks down.

In simple terms operational excellence objectively looks at how well the services are operating and how well the customers perceive the value delivered by those services.

Following are a set of metrics that would provide a good insight towards operational excellence:

2.1 Service Availability

Availability is generally expected as a percentage of time the service is operational within the reporting period. In organizations where there is a segmentation of the service offerings like core/non-core, critical/non-critical etc., this metric can be segmented to provide availability metrics per service segment.

At a team level, the following metrics should be used to report towards this organization metric.

  • Frequency of service downtime measuring when and the number of times the service went down during the reporting period
  • Frequency of scheduled vs. unscheduled deployments

The above two metrics together help answer whether the service downtime was expected (due to scheduled deployments, for instance) or if there is an underlying cause that needs to be looked at as it is causing the downtime with no clear, immediate explanation.

  • Service uptime measures the amount of time that the service was up and running during the reporting period.
  • Service downtime measures the amount of time that the service was down during the reporting period

Availability SLA compliance can be computed using the service uptime, downtime metrics, and customer committed SLAs. This is an important metric as it provides a clear indication of whether the customer is able to access and use the service as agreed upon contractually.

  • Service response time – simulating customer interactions with the service or the website and measuring the response time. This metric is typically captured for critical services. This metric gives a good indication of customer experience with the service and areas that would need to be addressed to further enhance this experience.

2.2 Service Reliability

Reliability measures the probability that a service maintains its performance standards in a specific period of time. Following are the most common reliability metrics that are to be monitored.

  • Mean Time Between Failures (MTBF) measures the average time between consecutive application or service failures. A failure could be a major incident like a total network outage or a small incident lasting a few seconds. Nature of the industry and business, customer service level agreements (SLAs) determine the tolerance for the frequency and duration of service failures. A lower value of MTBF could point to inefficiencies with code quality or hardware and other infrastructure issues. Regular review of this metric provides an opportunity to identify and improve upon these inefficiencies.
  • Mean Time to Recovery (MTTR) measures the average time needed to detect, troubleshoot, fix and return the service to a healthy state. It indicates the speed at which a service downtime is resolved. The review of this metric provides an opportunity to discuss and understand how the different processes leading up to the downtime resolution are working – Is the alerting mechanism working optimally? Is the team taking a long time to troubleshoot and fix the problem, and if so, why?
  • Mean Time to Resolve is the average time needed to return the service to a healthy state and ensure that the underlying cause is fully resolved so that the issue will not recur. As this metric aims at improving the long-term performance and reliability of the service, it is an important metric that can be strongly correlated with customer satisfaction.
  • SLA compliance ratio measuring the percentage of issues resolved within all the SLA parameters. While it is important to have a higher SLA compliance ratio, it does not necessarily mean the IT services are operating at optimal levels. In this context, SLOs (Service Level Objective) and SLIs (Service Level Indicator), which are more stringent, should be looked at. An SLO is a target value or range of values for a service level that is measured by an SLI. SLIs are measured internally to determine whether the SLO and hence SLA is being met. This enables the team to identify when they are nearing an SLA breach and hence respond and react quickly to avoid such a breach.

2.3 Customer service and satisfaction

  • Average first response time indicates the time it takes for the support team to reply to a customer request.
  • Average issue resolution time indicates the time it takes to solve an issue reported by the customer.

A shorter duration for the above two metrics provides a better customer experience and thus impacts customer satisfaction positively.

  • Net Promoter Score (NPS) measures how likely a customer is to recommend the product and services of your organization to others. This is an important metric as it gauges how strong customer engagement is and can have a direct impact on sales and revenue. It is worthwhile to note that Customer Service is not the only factor impacting the NPS. Other key factors that can have a direct impact on NPS are the quality of the product, price, and ease of use.


3 Technical excellence

This dimension should focus on measuring factors that impact technical excellence, namely quality of delivery, agility in the team, and team culture to adapt to industry technology evolution.

3.1 Quality of delivery

  • Escaped defects is the number of defects that have entered the live environment in a particular release. In an ideal situation, these defects should have been caught in test cycles and addressed. Hence, this metric is an indicator of the release quality and the rigor of the quality control processes followed by the teams.
  • Code coverage provides a view of the extent to which the code base is covered by automated tests. It is important to note that having a 100% code coverage metric does not necessarily assure zero defects, however, it is a good measure of untested code.
  • Functional test coverage which provides a view of which features in the release meet the acceptance criteria
  • Sprint Goal success which is an indicator of how often the team meets customer requirements and is also an indicator of the team’s agile maturity.

3.2 Agility in delivery and team culture

  • Lead and cycle time to deliver service requests and other business as usual activities (BAU) – The earlier sections of this article discussed a similar metric related to business deliveries. A typical agile team has to also focus on BAU requests, and this metric gives insights into how fast a request is getting picked up by the team and how long it takes for the team to complete a request and deliver value after starting to work on the request. This metric, when juxtaposed with the related metric for business delivery, gives insights into whether the team prefers business requests over BAU or vice-versa.
  • Average time builds stay “Red” is an indicator that the team is probably unable to focus on a work item till its completion. This could be due to the assignee multi-tasking or not giving priority to fix the build or that a dependency is not met due to which the build cannot be successful. In either case, this metric provides insights into patterns and behaviors involving team dynamics.
  • Technical debt is a tricky thing to measure and track. However, it can severely impact the team’s ability to maintain and enhance software easily. Many times, teams end up focusing on delivering business requests and will be unable to take dedicated time to refactor or re-architect the hot-spots. One common approach many teams follow is club refactoring when that portion of code needs changes to deliver business demands. A metric to monitor how technical debt is evolving from release to release gives a good indication of the team mindset – whether they are focused on delivering the best software or are content with delivering just the business needs.
  • Duration in which a new member of the team becomes productive is another tricky thing to measure and track. However, it is an important element that impacts the overall team productivity and gives insights into the effectiveness of the on-boarding process and team culture, and team dynamics.

4. Innovation

This dimension should focus on measuring factors that impact innovation advancements in the organization.

  • Innovative Culture gauges how conducive is the environment within the organization to promote innovation at all levels and how it is evolving over time. Some of the important metrics covering this aspect are:
    • Employee perception of organization’s innovativeness measured by periodic surveys across all departments of the organization
    • Number of employees who have undergone training related to innovation covering innovation frameworks, internal processes for managing innovation
    • Number of ideas converted into projects having an executive sponsorship
    • Number of ideas proposed by staff vs. executives
    • Effort spent by the teams on innovative ideas vs. other initiatives
  • Innovation pipeline

The focus here is to measure the efficiency of the innovation pipeline and ideation process. Some of the important metrics covering this aspect are:

    • Ratio of new ideas proposed to those implemented
    • Average time an idea stays in the different stages of the idea life cycle
    • How soon ideas that don’t get implemented are killed
  • Innovation outcomes

The focus here is to measure the effectiveness of the innovation process

    • Time to market measuring how long it takes for an idea to get implemented and released to customers
    • Innovation spending converted to new product sales measuring how much revenue each dollar spent on innovation is bringing in
    • Customer perception of the organization’s innovativeness measured by periodic customer surveys and other methods.

5. People growth and happiness

This dimension should focus on gauging how “happy” the teams are. At the most foundational level, a team’s success or failure is highly dependent on its team members.

  • Employee engagement: Employee satisfaction survey is a popular means that organizations have been using for a long time to gauge employee engagement. Net Promoter Score is another popular metric used. However, rather than asking a single question, “How likely are you to recommend others to work at our organization” or “How happy are you with the organization” which evokes a very subjective response, it is prudent to have a set of specific questions so that specific areas of improvement can be identified based on employee feedback.
  • Employee churn is a measure of how many people leave the organization in any given period. This is a strong indicator of how happy employees are, as happy employees are more likely to stay in the organization.
  • Employee upskilling and re-skilling is a measure of how the staff of the organisation are preparing for the future, which is a key factor for building a resilient and adaptable workforce.

6. Financial Excellence

IT Financial Excellence aims to optimize the IT spend while maximizing the value delivered by IT resources.

The following are a set of metrics that would provide a good insight into financial excellence. These metrics help put other key metrics of other dimensions (business delivery, operational and technical) in the context of IT resources and investment.

  • Budget spent on strategic initiatives vs. support requests vs. innovation provides a view of how much is being spent on growing, running and transforming the business and whether this aligns with the organisation’s objectives.
  • Total cost of ownership per service enables IT teams and managers to know the true cost of the service (human resources, infrastructure, and other IT resources including, CapEx and OpEx costs) and enables them to make better decisions on the IT spend considering the service criticality and current spend.

Conclusion

There are many metrics that could be measured. Ensuring a balanced focus on the six dimensions of Business delivery excellence, Operational excellence, Technical excellence, Innovation, Happiness, and Financial excellence and understanding the value each of the metrics brings in are essential for the success of agile teams.

References:

https://hbr.org/2017/09/what-your-innovation-process-should-look-like

https://innovation-leaders.co.uk/pipeline/

https://www.tmaworld.com/2017/11/18/how-create-successful-innovation-pipeline/

https://runway.is/blog/how-to-measure-innovation/

https://www2.planview.com/im3/docs/Planview-Innovation-Maturity-Model.pdf

https://www0.gsb.columbia.edu/mygsb/faculty/research/pubfiles/4566/firm%20innovativeness.pdf

https://www.forbes.com/sites/forbestechcouncil/2020/12/21/why-employee-upskilling-and-reskilling-is-so-important-right-now/?sh=2e0e0dbe3302

https://www.tbmcouncil.org

https://community.tbmcouncil.org/HigherLogic/System/DownloadDocumentFile.ashx?DocumentFileKey=67618692-dd95-4f03-a986-03bca89100b7&forceDialog=0

https://dsimg.ubm-us.net/envelope/151893/296392/1390318118_WP_-_Apptio_IT_Financial_Metrics_Primer.pdf

https://cloud.google.com/blog/products/devops-sre/sre-fundamentals-slis-slas-and-slos

https://sre.google/sre-book/service-level-objectives/

https://financesonline.com/10-important-kpis-and-metrics-your-customer-support-team-should-be-using/

https://www.agilealliance.org/agile101/12-principles-behind-the-agile-manifesto/

https://instituteopex.org


The post Metrics that matter for IT organizations on an agile journey appeared first on Simple Talk.


from Simple Talk https://ift.tt/akAN3QM
via