Friday, December 11, 2020

DBA in training: Know your server’s limits

The series so far:

  1. DBA in training: So, you want to be a DBA...
  2. DBA in training: Preparing for interviews
  3. DBA in training: Know your environment(s)
  4. DBA in training: Security
  5. DBA in training: Backups, SLAs, and restore strategies
  6. DBA in training: DBA in training: Know your server’s limits 

Having taken steps to map your database applications to the databases and address your security and backups, you need to turn your attention to your server’s limits.

What do I mean by limits? Certainly, this is an allusion to how you will monitor your server drive capacity, but I also mean how you will track resource limits, such as latency, CPU, memory, and wait stats. Understanding all of these terms, what normal values are for your server, and what to do to help if the values are not normal, will help to keep your servers as healthy as possible.

These measures are big, in-depth topics in and of themselves. This will only serve to get you started. Links to more in-depth resources are included with each topic, and you will doubtless find others as you progress through your career.

Drive Space

Whether you are hosting servers on-prem or in the cloud, and however your drives may be configured, you need to know how much space your files are consuming, and at what rate. Understanding these measures is essential to helping you to both manage your data (in case you find that it is time to implement archiving, for instance) and your drives (i.e., you’ve managed your data as carefully as you can, and you simply need more space). It is also vital to help you to plan for drive expansion and to provide justification for your requests. Whatever you do, avoid filling the drives. If your drives fill, everything will come to a screeching halt, while you and an unhappy Infrastructure team drop everything to fix it. If you are using Azure Managed Instances, you can increase the space as well. Storage limits and pricing in the cloud will depend on a number of factors – too many to explore here.

How can you monitor for drive capacity? Glenn Berry to the rescue! His diagnostic queries earned him the nickname “Dr. DMV”, and they are indispensable when assessing the health of your servers. They consist of nearly 80 queries, which assess nearly anything you can imagine at the instance and database levels. He is good about updating these once a month, and they work with Azure as well as SQL Server. If you do not like manually exporting your results to Excel and prefer using PowerShell instead, his queries work with that as well. This should get you started. This example (Query 25 of his SQL Server 2016 Diagnostic Information Queries) will give you the information you need for drive space:

SELECT DISTINCT
       vs.volume_mount_point,
       vs.file_system_type,
       vs.logical_volume_name,
       CONVERT(DECIMAL(18, 2), 
            vs.total_bytes / 1073741824.0) AS [Total Size (GB)],
       CONVERT(DECIMAL(18, 2), vs.available_bytes / 1073741824.0) 
            AS [Available Size (GB)],
       CAST(CAST(vs.available_bytes AS FLOAT) / 
            CAST(vs.total_bytes AS FLOAT) AS DECIMAL(18, 2)) 
           * 100 AS [Space Free %]
FROM sys.master_files AS f WITH (NOLOCK)
    CROSS APPLY sys.dm_os_volume_stats(f.database_id, f.[file_id])
        AS vs
OPTION (RECOMPILE);

Tracking the results of this diagnostic query should help to get you started in monitoring your space and checking where you are. Regular tracking of your drive space will help you to see how quickly it is growing and to help you plan when (and how much) to expand them.

To help you track your database growth, you might try something like this query, which I have used countless times. It comes from here and is based on backup file sizes:

DECLARE @startDate DATETIME;
SET @startDate = GetDate();
SELECT PVT.DatabaseName
    ,PVT.[0]
    ,PVT.[-1]
    ,PVT.[-2]
    ,PVT.[-3]
    ,PVT.[-4]
    ,PVT.[-5]
    ,PVT.[-6]
    ,PVT.[-7]
    ,PVT.[-8]
    ,PVT.[-9]
    ,PVT.[-10]
    ,PVT.[-11]
    ,PVT.[-12]
FROM (
    SELECT BS.database_name AS DatabaseName
        ,DATEDIFF(mm, @startDate, BS.backup_start_date) 
              AS MonthsAgo
        ,CONVERT(NUMERIC(10, 1), AVG(BF.file_size / 1048576.0))
              AS AvgSizeMB
    FROM msdb.dbo.backupset AS BS
    INNER JOIN msdb.dbo.backupfile AS BF ON BS.backup_set_id 
             = BF.backup_set_id
    WHERE BS.database_name NOT IN (
            'master'
            ,'msdb'
            ,'model'
            ,'tempdb'
            )
        AND BS.database_name IN (
            SELECT db_name(database_id)
            FROM master.SYS.DATABASES
            WHERE state_desc = 'ONLINE'
            )
        AND BF.[file_type] = 'D'
        AND BS.backup_start_date BETWEEN DATEADD(yy, - 1, @startDate)
            AND @startDate
    GROUP BY BS.database_name
        ,DATEDIFF(mm, @startDate, BS.backup_start_date)
    ) AS BCKSTAT
PIVOT(SUM(BCKSTAT.AvgSizeMB) FOR BCKSTAT.MonthsAgo IN (
            [0]
            ,[-1]
            ,[-2]
            ,[-3]
            ,[-4]
            ,[-5]
            ,[-6]
            ,[-7]
            ,[-8]
            ,[-9]
            ,[-10]
            ,[-11]
            ,[-12]
            )) AS PVT
ORDER BY PVT.DatabaseName;

This gives you an idea of how quickly the databases on your servers have grown over the last twelve months. It can also help you to predict trends over time if there are specific times of year that you see spikes that you need to get ahead of. Between the two, you will have a much better idea of where you stand in terms of space. Before asking for more though, your Infrastructure and network teams will thank you if you carefully manage what you have first. Look at options to make the best use of the space you have. Perhaps some data archival is an option, or compression would work well to reduce space. If you have a reputation for carefully managing space before asking for more, you will have less to justify when you do make the request.

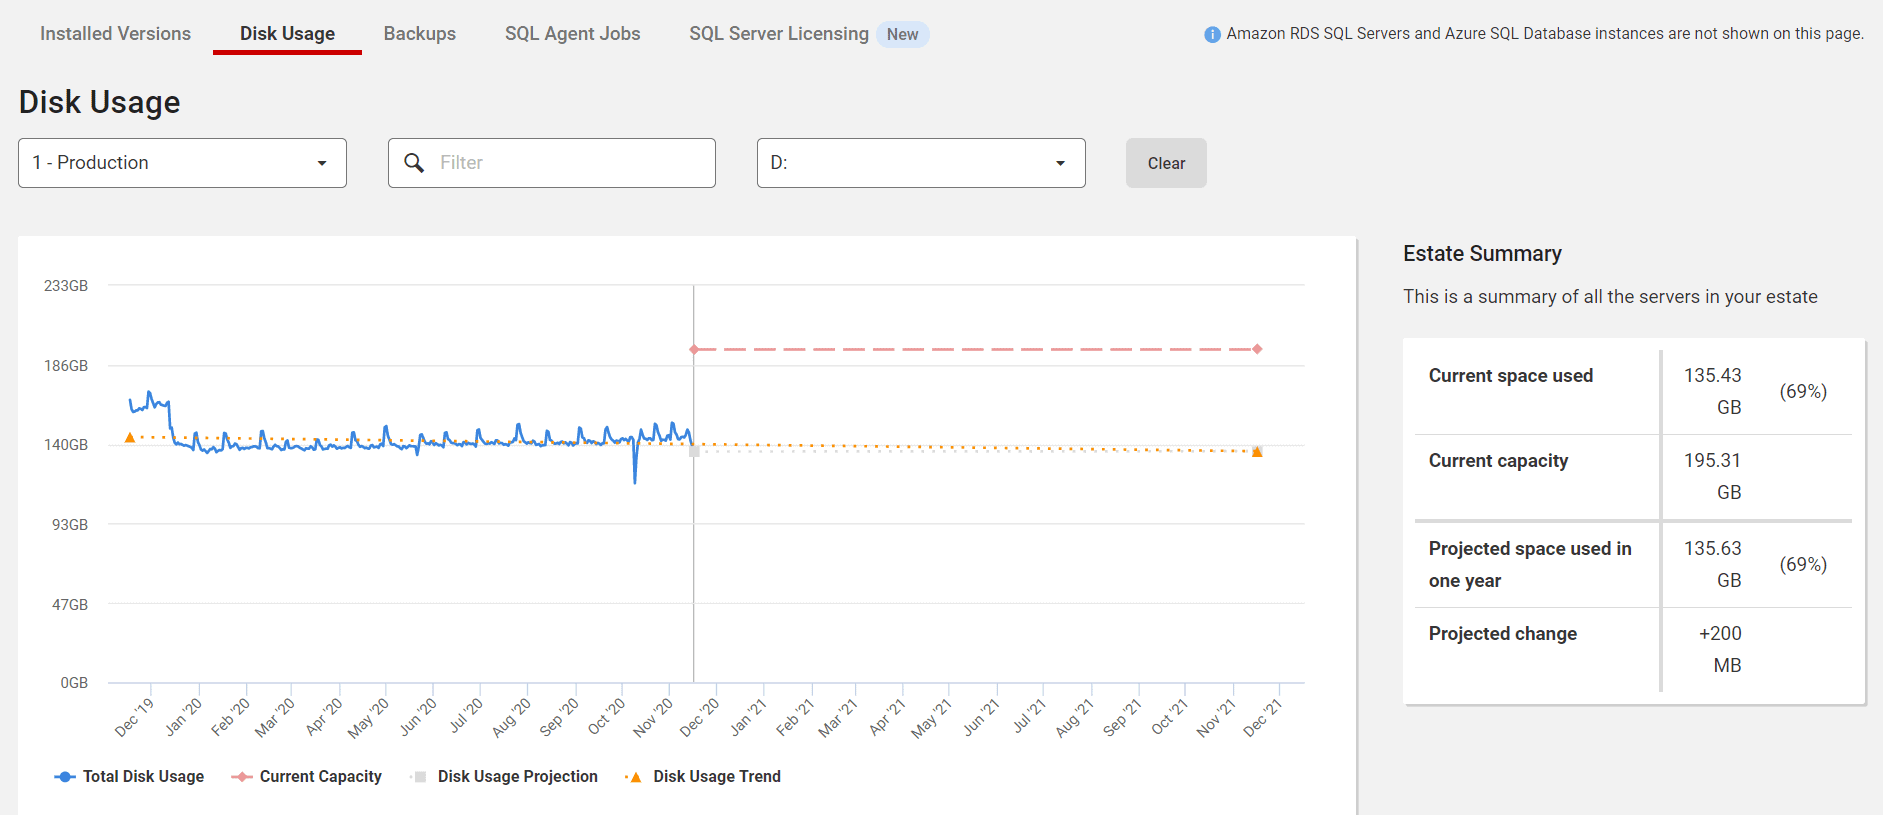
If you have SQL Monitor, you can watch disk growth and project how much you will have left in a year.

SQL Monitor Disk Usage page showing current and predicted capacity.

Know Your Resource Limits

You should now have some sort of idea of idea of how much space you currently have and how quickly your databases are consuming it. Time to look to resource consumption. There are a host of metrics that assess your server’s resource consumption – some more useful than others. For the purposes of this discussion, it will be limited to the basics – latency, CPU, and memory.

Latency

Latency means delay. There are two types of latency: Read latency and write latency. They tend to be lumped together under the term I/O latency (or just latency).

What is a normal number for latency, and what is bad? Paul Randal defines bad latency as starting at 20 ms, but after you assess your environment and tune it as far as you can, you may realize that 20 ms is your normal, at least for some of your servers. The point is that you know what and where your latencies are, and you work toward getting that number as low as you possibly can.

Well, that sounds right, you are probably thinking. How do you do that? You begin by baselining – collecting data on your server performance and maintaining it over time, so that you can see what is normal. Baselining is very similar to a doctor keeping track of your vital signs and labs. It’s common knowledge that 98.6 F is a baseline “normal” temperature, for instance, but normal for you may be 97.8 F instead. A “normal” blood pressure may be 120/80, but for you, 140/90 is as good as it gets, even on medication. Your doctor knows this because they have asked you to modify your diet, exercise and take blood pressure medication, and it is not going down any more than that. Therefore, 140/90 is a normal blood pressure for you. Alternatively, maybe you modified your diet as much as you are willing to, but are faithful to take your medications, and you exercise when you think about it. In that case, your blood pressure could still go down some, but for now, 140/90 is your normal.

The same is true for your servers. Maybe one of your newer servers is on the small side. It does not have a lot of activity yet, but historical data is in the process of back loading into one of the databases for future use. It has 5 ms of read latency and 10 ms of write latency as its normal.

Contrast that with another server in your environment, which gets bulk loaded with huge amounts of data daily. The server is seven years old and stores data from the dawn of time. The data is used for reports that issue a few times a day. It has 5 ms of read latency, but 30 ms of write latency. You know that there are some queries that are candidates for tuning, but other priorities are preventing that from happening. You also realize that this is an older server approaching end of life, but there is no more budget this year for better hardware, so 30 ms of write latency is normal – at least for now. It is not optimal, but you are doing what you can to stay on top of it. The idea is to be as proactive as possible and to spare yourself any nasty surprises.

To understand your baselines, you must collect your data points on a continuous basis. If you are new and no one is screaming about slowness yet, you might have the luxury of a month to begin your determination of what is normal for your environment. You may not. Nevertheless, start collecting it now, and do not stop. The longer you collect information on your I/O latency (and the other points discussed in this article), the clearer the picture becomes. Moreover, you can measurably demonstrate the improvements you made!

If you find that your latency is in the problem zone, the article I referred to before has some great places to begin troubleshooting. Try to be a good citizen first and look at all the alternatives Paul suggests before throwing hardware at the problem. Many times, you are in a position to help. I once had a situation where we were implementing some software, and a developer wrote a “one ring to rule them all” view that wound up crashing the dev server – twice. By simply getting rid of unnecessary columns in the SELECT statement, we reduced the reads in the query from over 217 million to about 344,000. CPU reduced from over 129,000 to 1. If we could have implemented indexing, we could have lowered the reads to 71. On those days, you feel like a hero, and if your server could speak, you would hear the sigh of relief from taking the weight off its shoulders.

Other query issues can also lead to unnecessary latency. One place to check is your tempdb. Here, you want to look for queries inappropriately using temporary structures. You may find, for instance, that temp tables are loaded with thousands of rows of data that are not required, or they are filtered after the temp table is already populated. By filtering the table on the insert, you will save reads – sometimes, a lot of them! You could find a table variable that would perform better as an indexed temp table. Another place to look is at indexing. Duplicate indexes can cause latency issues, as well as bad indexing, which causes SQL Server to throw up its hands and decide that it would be easier to read the entire table rather than to try to use the index you gave it.

CPU

Think of CPU as a measure of how hard your queries are making SQL Server think. Since SQL Server is licensed by logical core, that may lead you to wonder what the problem is with using your CPU. The answer is, nothing – as long as it is normal CPU usage.

So, what is “normal”? Again, baselining will tell you (or your server monitoring software will). Look for sustained spikes of high CPU activity rather than short spurts. Needless to say, if your CPU is pegged at 100% for 20 minutes, that is a problem! On the other hand, if you see 90% CPU usage for short spurts of time, that may be okay. If you do find a server with CPU issues, sp_BlitzCache is helpful to track down possible problem queries. You can, sort by reads or CPU. Even better, you will get concrete suggestions to help.

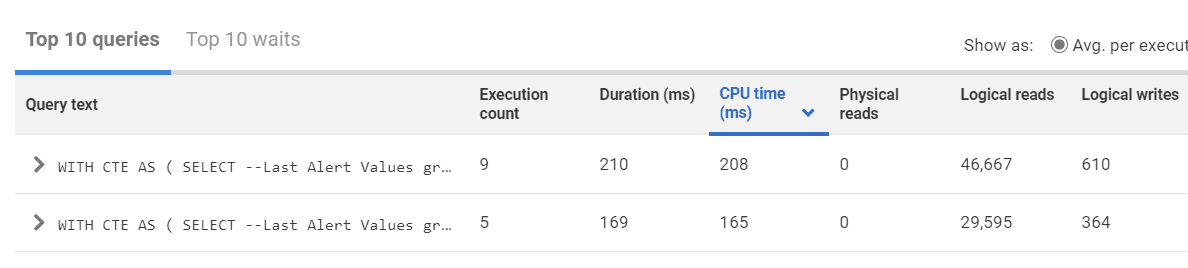
If you have SQL Monitor, you can also sort the top queries by CPU time to find queries taking the most CPU time.

SQL Monitor top 10 queries screen.

One of the most insidious consumers of CPU are implicit conversions. Implicit conversions occur when SQL Server must compare two different data types, usually on a JOIN or an equal operator. SQL Server will try to figure out the “apples to oranges” comparison for you using something called data type precedence, but you will pay in CPU for SQL Server to figure this out – for every agonizing row.

Implicit conversions are not easy to see. Sometimes, the two columns in the implicit conversion have the same name, but under the covers have two different data types. Or it can be more subtle – for instance, an NVARCHAR value without the “N’” used. Worse, you won’t even always see them on execution plans unless you go through the XML, so without monitoring for them, you may never know that you have an issue with them. Yet these invisible performance killers can peg your CPU. Running sp_BlitzCache on your servers will find these and help you with them.

High numbers of recompiles can also cause CPU issues. You might encounter these when code contains the WITH RECOMPILE hint to avoid parameter sniffing issues. If you have stored procedures using WITH RECOMPILE at the top of the procedure, one thing you can try is to see if you have any other alternatives. Maybe only part of the sproc needs the recompile hint instead of the whole thing. It is possible to use the recompile hint at the statement level instead of for the entire stored procedure. On the other hand, maybe a rewrite is in order. BlitzCache will catch stored procedures with RECOMPILE and bring them to your attention.

Memory

When discussing memory issues in SQL Server, a good percentage of DBAs will immediately think of the Page Life Expectancy (PLE) metric. Page life expectancy is a measure of how long a data page stays in memory before it if flushed from the buffer pool. However, PLE can be a faulty indicator of memory performance. For one thing, PLE is skewed by bad execution plans where excessive memory grants are given but not used. In this case, you have a query problem rather than a true memory pressure issue. For another, many people still go by the dated value of 300 seconds as the low limit of PLE, which was an arbitrary measure when first introduced over twenty years ago – it should actually be much higher. How much? It depends on your baseline. If you really love PLE and rely on it as an indicator anyway, look for sustained dips over long periods, then drill down to find out their causes. Chances are that it will still be some bad queries, but the upside is that you may be able to help with that.

What other things might be causing memory pressure? Bad table architecture can be the culprit. Wide tables with fixed rows that waste space still have to be loaded (with the wasted space!) and can quickly become a problem. The fewer data pages that can be loaded at a time, the less churn you will see in your cache. If possible, try to address these issues.

While you are at it, check your max memory setting. If it is set to 2147483647, that means that SQL Server can use all the memory on the OS. Make sure to give the OS some headspace, and do not allow any occasion for SQL Server to use all the memory.

If you are using in-memory OLTP, there are additional things for you to consider. This site will help you with monitoring memory usage for those tables.

Bad indexing can be another possible issue. Here, look for page splits and fragmentation, or missing indexes. If SQL Server can use a smaller copy of the table (a nonclustered index) rather than loading the entire table into memory, the benefits become obvious!

If none of these issues apply to you (or if you find that you just do not have enough memory), you may need to throw some hardware at it. There is nothing wrong with the need for hardware, if it is the proven, best solution.

Summary

Before you can tell if your SQL Server is not performing as well as expected, you need to know what normal performance is for that server. This article covered the three main resources, disk latency, CPU, and memory that you should baseline and continue to


The post DBA in training: Know your server’s limits appeared first on Simple Talk.


from Simple Talk https://ift.tt/39U1Dei
via

Monday, December 7, 2020

Creating your first CRUD app with Suave and F#

F# is the go-to language if you’re seeking functional programming within the .NET world. It is multi-paradigm, flexible, and provides smooth interoperability with C#, which brings even more power to your development stack, but did you know that you can build APIs with F#? Not common, I know, but it’s possible due to the existence of frameworks like Suave.io.

Suave is a lightweight, non-blocking web server. Since it is non-blocking, it means you can create scalable applications that perform way faster than the ordinary APIs. The whole framework was built as a non-blocking organism.

Inspired by Happstack, it aims to embed web server capabilities into applications by providing support to components and services like Websockets, HTTPS, multiple TCP/IP bindings, Basic Access Authentication, Keep-Alive, HTTP compression, and many more.

In this article, you’ll be driven through the Suave server by developing a complete CRUD REST API.

Setting Up

Suave can be installed via NuGet Manager. However, before you can do it, you need to create a project in your Visual Studio Community Edition.

First, make sure you have the .NET Core SDK installed. If not, go ahead and install it.

Then, open Visual Studio, go to the “Create a new project” window, and filter for F# applications, and select the option “Console App (.NET Core)” as shown in Figure 1. Click Next.

Figure 1. Creating a new F# project.

The following window will ask for a project and solution name, as well as the folder destination. Fill the fields according to Figure 2 and click Create.

Figure 2. Providing a project and solution name.

Once the project creation finishes, you’ll be able to see that only one file comes with it: the Program.fs. Within it, there’s a Hello World example in F#.

That’s a very basic structure of an F# program, but this example won’t use any of it.

Installing Suave

Before going any further, you need to set up Suave properly. The usual method recommends doing it via Paket, however, since you’re already within the Visual Studio environment, stick to NuGet.

Right-click the solution and select “Manage NuGet Packages for Solution…” and browse for Suave at the search box.

Select it according to Figure 3 and click the Install button.

Figure 3. Installing Suave at NuGet.

For the API construction, you’ll also need Newtonsoft’s JSON package, as it provides a handful of auxiliary methods to deal with conversions from object to JSON and vice versa.

Follow Figure 4 instructions to install it.

Figure 4. Installing Newtonsoft.Json dependency.

The Project Structure

Great! Now move on to the project building. You noticed that you already have a Program.fs file. You’ll use it as the main execution file. However, two other files are needed: one for the in-memory database operations, and the other for the service operations.

Go ahead and create both of them according to Figures 5 and 6 below.

Figure 5. Creating the user’s repository.

Figure 6. Creating the user’s service.

The Repository

First, start coding the repository since it’s the basis for the rest of the API. Take the code from Listing 1 and paste it into the UserRepository.fs file.

Listing 1. The user’s repository code.

namespace SuaveAPI.UserRepository
open System.Collections.Generic
type User =
    { UserId: int
      Name: string
      Age: int
      Address: string
      Salary: double }
module UserRepository =
    let users = new Dictionary<int, User>()
    let getUsers () = users.Values :> seq<User>
    let getUser id =
        if users.ContainsKey(id) then Some users.[id] else None
    let createUser user =
        let id = users.Values.Count + 1
        let newUser = { user with UserId = id }
        users.Add(id, newUser)
        newUser
    let updateUserById id userToUpdate =
        if users.ContainsKey(id) then
            let updatedUser = { userToUpdate with UserId = id }
            users.[id] <- updatedUser
            Some updatedUser
        else
            None
    let updateUser userToUpdate =
        updateUserById userToUpdate.UserId userToUpdate
    let deleteUser id = users.Remove(id) |> ignore

For the sake of simplicity, this project won’t make use of any physical database, so the user’s data will be stored in an in-memory Dictionary called users.

The dictionary’s keys refer to each user’s id, while the values represent the user objects.

The full repository is made of six main operations:

  • getUsers: take the dictionary and translates it into an F# sequence.
  • getUser: the method will search the dictionary for one specific user based on its id.
  • createUser: creates a new user object, certifying that the id is always going to be replaced with an auto-incremented value.
  • updateUserById/updateUser: to update a user, you first need to make sure the passed id is valid and belongs to a real user. Then, call the updateUser method which will, in turn, updates the user on the dictionary.
  • deleteUser: simply removes the user based on its id.

The Service

Now, head to the service class. Open it and add the Listing 2 contents to it.

Listing 2. User’s service code.

namespace SuaveAPI.UserService
open Newtonsoft.Json
open Newtonsoft.Json.Serialization
open Suave
open Suave.Operators
open Suave.Successful
[<AutoOpen>]
module UserService =
    open Suave.RequestErrors
    open Suave.Filters
    // auxiliary methods
    let getUTF8 (str: byte []) = System.Text.Encoding.UTF8.GetString(str)
    let jsonToObject<'t> json =
        JsonConvert.DeserializeObject(json, typeof<'t>) :?> 't
    // 't -> WebPart
    let JSON v =
        let jsonSerializerSettings = new JsonSerializerSettings()
        jsonSerializerSettings.ContractResolver 
          <- new CamelCasePropertyNamesContractResolver()
        JsonConvert.SerializeObject(v, jsonSerializerSettings)
        |> OK
        >=> Writers.setMimeType "application/json"
    type Actions<'t> =
        { ListUsers: unit -> 't seq
          GetUser: int -> 't option
          AddUser: 't -> 't
          UpdateUser: 't -> 't option
          UpdateUserById: int -> 't -> 't option
          DeleteUser: int -> unit }
    let getActionData<'t> (req: HttpRequest) =
        req.rawForm |> getUTF8 |> jsonToObject<'t>
    let handle nameOfAction action =
        let badRequest =
            BAD_REQUEST "Oops, something went wrong here!"
        let notFound = NOT_FOUND "Oops, I couldn't find that!"
        let handleAction reqError =
            function
            | Some r -> r |> JSON
            | _ -> reqError
        let listAll =
            warbler (fun _ -> action.ListUsers() |> JSON)
        let getById = action.GetUser >> handleAction notFound
        let updateById id =
            request
                (getActionData
                 >> (action.UpdateUserById id)
                 >> handleAction badRequest)
        let deleteById id =
            action.DeleteUser id
            NO_CONTENT
        let actionPath = "/" + nameOfAction
        // path's mapping
        choose [ path actionPath
                 >=> choose [ GET >=> listAll
                              POST
                              >=> request (getActionData 
                              >> action.AddUser >> JSON)
                              PUT
                              >=> request
                                      (getActionData
                                       >> action.UpdateUser
                                       >> handleAction badRequest) ]
                 DELETE >=> pathScan "/users/%d" 
                       (fun id -> deleteById id)
                 GET >=> pathScan "/users/%d" (fun id -> getById id)
                 PUT >=> pathScan "/users/%d" 
                  (fun id -> updateById id) ]

Note that the namespace at the beginning of the file is very important to make the modules available to one another. The AutoOpen annotation above the module declaration helps to expose the let-bound values of our Actions type. However, if you don’t want to use the annotation, you can remove it and directly call the Actions type via the open command.

The services count on two auxiliary methods: one for extracting the UTF-8 value of a string, and the other for converting JSON to F# objects.

The WebPart config is essential. A WebPart function returns an asynchronous workflow which itself ultimately returns an HttpContext option. It encapsulates both request and response models and simplifies their usage, like setting the Content-Type of our responses, for example.

The Actions resource works as a container for all the API operations. This representation is excellent because it allows porting any API methods to it. If you have other domains for your API (like Accounts, Students, Sales, etc.), you can map the endpoints within other Actions and use them right away.

It all works due to the handle structure. It receives an action and its name and implicitly converts it to each service operation.

Finally, the paths are mapped at the end of the listing, through Suave’s path and pathScan features. They allow redirecting requests to specific methods, and scan path params (as you have with the update, get, and delete operations) to extract the values before processing the request.

The Program

So far, you’ve built everything the API needs to work. Now, set up the main Program F# file. For this, open the Program.fs and add the content presented by Listing 3. You’ll get a few errors, but they’ll go away when you run the program.

Listing 3. Main F# file code.

namespace SuaveAPI
module Program =
    open Suave.Web
    open SuaveAPI.UserService
    open SuaveAPI.UserRepository
    [<EntryPoint>]
    let main argv =
        let userActions =
            handle
                "users"
                { ListUsers = UserRepository.getUsers
                  GetUser = UserRepository.getUser
                  AddUser = UserRepository.createUser
                  UpdateUser = UserRepository.updateUser
                  UpdateUserById = UserRepository.updateUserById
                  DeleteUser = UserRepository.deleteUser }
        startWebServer defaultConfig userActions
        0

This one resembles a bit the previous content of Program.fs. Suave’s server is always started the same way, through the startWebServer method.

The method receives two arguments:

  • The server’s config object. If you want to go raw, just provide it with the default dafaultConfig object.
  • And the WebPart mentioned before.

The WebPart is just a representation of the Actions created within the UserService file. Make sure to call each one of the service methods accordingly.

The code must always end with a 0. The zero says to Suave that the server must stop when you shut it down; otherwise, it’ll keep running forever and locking that port.

Testing

Now it’s time to test the API. For this, you’ll make use of Postman, a great tool for API testing. Download and install it if you still don’t have it.

Then, get back to your application and execute it by hitting the Start button (Figure 7) or pressing F5.

Figure 7. Starting the application up.

It will prompt a window stating that the Suave listener has started at a specific address + port, as shown below.

Figure 8. App successfully started.

Since there’s no user registered yet, you need to create one first. Within Postman, open a new window, and fill it in according to Figure 9.

Figure 9. Creating a new user with Postman.

Make sure to select the proper HTTP verb (POST), and the option “raw” at the Body tab, as well as JSON as the data type. Provide a JSON with the user’s data, as shown in the figure and hit the Send button.

If everything goes well, you may see the newly created user coming back within the response. Now, try retrieving the same user through the GET demonstrated in Figure 10.

Figure 10. Retrieving the newly created user.

Conclusion

As a homework task, I’d ask you to test the rest of the CRUD operations and check if everything’s working fine. It’d be also great to substitute the in-memory dictionary as the database for a real one, like MySQL or SQL Server. This way, you can understand better how F# and Suave communicate with real databases.

Plus, make sure to refer to the official docs for more on what you can do with this amazing web server.


The post Creating your first CRUD app with Suave and F# appeared first on Simple Talk.


from Simple Talk https://ift.tt/39KpYTM
via

Ten tips for attracting and retaining DevOps talent

DevOps can help organizations become more agile and responsive to their customers, but it’s only as effective as the individuals who participate on the DevOps teams. Getting the right people in place is paramount to a successful DevOps implementation. Organizations need professionals with expertise in DevOps methodologies and who can work effectively within a cross-functional team structure. But such individuals can be difficult to find, especially as more organizations embrace DevOps for their application delivery.

Competition for qualified DevOps professionals has never been steeper, and managers have to work harder than ever to get the people they need for their teams. In this article, I provide ten tips for attracting and retaining DevOps talent but keep in mind that these are meant only as guidelines, not absolute rules. Much will depend on your organization’s individual circumstances and DevOps operations. That said, these tips should provide you with a good starting point for understanding the types of issues to take into account when looking to hire DevOps professionals.

1. Identity and assess internal talent.

Before opening up your search to the world at large, consider looking for talent in-house. It’s a lot cheaper to keep and train someone who already works in your organization than to incur the costs of recruiting and onboarding someone from the outside. Managers who interface with these individuals already have insight into how they work, how quickly they learn, which technologies they understand, and how well they interact with their coworkers. In addition, existing employees are already familiar with the company culture, which is a big plus.

Even if you don’t recruit from your internal pool, you should still assess the collective skills currently available on your DevOps team and from this information determine where there are gaps. For example, you might have team members with extensive development and operational skills but not a lot of experience with infrastructure as code (IaC). In this case, you might want to look for someone who’s strong in this area. Also keep in mind the need for soft skills, such as the ability to communicate and collaborate effectively.

2. Create a proper job description.

A job description defines exactly what you’re looking for. It outlines roles and responsibilities, lists the required experiences and skills, and includes any other pertinent details. It also provides an overview of compensation and benefits. You can use this information to develop a job post or when discussing the position with candidates, recruiters, or other individuals. For most candidates, compensation will be a top consideration. Still, many are also looking for other benefits, such as health care, flexible schedules, or the ability to work from home, which has become more of a priority in the age of COVID.

But compensation is only one part of the job description. It should also identify the required technical qualifications and, just as important, desired values for participating on a DevOps team. Be careful not to make the requirements so steep or rigid that it will be nearly impossible to fill the position. You also don’t want to discourage individuals who, with a little training, could be excellent additions to the team. At the same time, you need to make it clear that this is a cross-functional DevOps role that goes beyond basic development or operations.

3. Use all available resources.

Finding the right candidates is no small task and often requires that you cast a wide net. For many companies, a good place to start is with their own employees. Some organizations implement employee referral programs that include incentives. If you seek employee referrals, make sure you provide them with specific information about the position you’re trying to fill. In addition, if your company uses recruiters, be sure you work with an individual who has at least a basic understanding of what DevOps is about.

Of course, you can post the position to job boards such as LinkedIn, Stack Overflow, or GitHub Jobs, but you should also consider other venues. For example, you might make contacts through social networks, online platforms, or local meetup groups, keeping in mind that many group gatherings are virtual these days. Another option is schools, which often have programs for matching up graduating students with potential employers, although it could be difficult to get individuals with the experience you need.

4. Attend to the basics.

When assessing candidate qualifications, make certain you cover the basics, such verifying their skillsets, work experiences, and knowledge of DevOps methodologies. Also talk to their references and ensure that they’re credible and not just friends or acquaintances. Ask them questions about such topics as the candidates’ work habits, communication skills, willingness to learn, or anything else that can help you determine how well they’d fit into your company and DevOps culture.

Another area to look at is how long candidates have worked at their respective jobs. If someone has constantly hopped around from one position to the next, chances are you won’t want to invest the time and resources necessary to onboard that individual, unless you’re trying to fill a temporary position. In general, you’re looking for anything that might cue you on how well a candidate will meet your requirements and fit into your organization over the long-term.

5. Ease up on the checklist.

When evaluating candidates, you might use a checklist to help assess their qualifications. Even if it’s only in your head, the checklist provides a simple mechanism for quickly weeding through applicants. Just don’t go overboard. For example, your DevOps team might use Jenkins for automation, so you include it on your checklist. However, a candidate might be experienced with an assortment of other DevOps tools, as well as DevOps processes in general, but doesn’t have hands-on experience with Jenkins, in which case, the applicant would fail the checklist test.

If you make your checklist too rigid, you might rule out individuals who could potentially be valuable assets to your DevOps team. Candidates might not be familiar with specific tools, have the latest certifications, or earned degrees in computer science, but they might still have years of qualified experience and have demonstrated their ability to solve problems, learn new technologies, operate in team settings, and understand how DevOps works from the inside out. Your requirements are still important, but so are many other qualities.

6. Create the right company environment.

Attracting and retaining DevOps talent represent different sides of the same coin, and nowhere is this more apparent than when it comes to creating the right atmosphere for hiring, onboarding, and retaining employees. These days, job applicants often research potential companies to learn about their work environments and employee satisfaction. Organizations should strive to maintain and present inviting and professional atmospheres that appeal to both potential and existing employees. It should be clear to everyone that yours is an organization made up of quality individuals and engaged leadership who understand the importance of the people who work there.

Establishing the right atmosphere starts when first posting a job and interviewing candidates. You should be honest and transparent about your organization and the available position, so there are no surprises if the individual joins your company. You should also ensure that the hiring and onboarding processes are as welcoming and painless as possible. At the same time, keep in mind that DevOps professionals want to work on interesting projects and use cutting-edge technologies, which could mean making some changes to current operations.

7. Create the right DevOps team culture.

It’s often remarked that the key to an effective DevOps process is to establish the right team culture, with communication, collaboration, and cross-functional skills the key ingredients. The same goes for attracting and retaining DevOps professionals. When applying for a job, they want to know that they’ll be joining a functional DevOps team. If they get the job and the team doesn’t meet their expectations, they probably won’t be around for too long.

To build the right team culture, the organization’s leadership must be onboard, providing a unified vision that encourages learning, information sharing, team interaction, and innovation. A DevOps team also requires the autonomy necessary to deliver applications as effectively as possible. To this end, team members must also have the tools they need to perform their jobs and the necessary training to use those tools to their maximum benefit. In addition, teams should be kept relatively small, so they’re flexible enough to achieve their goals.

8. Ensure the candidate is a cultural fit.

One of the most difficult yet important qualifications to look for in candidates is whether or not they’ll fit in naturally with your DevOps culture. A candidate must be able to feel comfortable working on your DevOps team, and team members must feel comfortable working with that individual. For this, you need to probe deeper into the candidate’s abilities, rather than limiting yourself to questions about past experiences and qualifications.

You can get a sense of a candidate’s team experiences from the individual’s references and past positions, but it also helps to ask the candidate probing, open-ended questions. For example, rather than focus only on their work experiences, you might ask them how they’d solve specific problems or what steps they’d take to improve DevOps processes. If possible, have a candidate spend time with team members or join in one of their meetings, and then get their feedback on how he or she might fit in.

9. Implement continuous learning.

DevOps professionals want to work for an organization that values training, education and ongoing personal development. They need to stay current with the ongoing stream of new tools and technologies. If they’re not provided with the time and resources necessary to keep up with the industry, the DevOps processes themselves will suffer, leading to a less effective team and disgruntled workers.

The organization’s leadership should take an active role in promoting and providing an active learning environment, identifying new skillsets and setting the direction. DevOps professionals want to feel challenged in their jobs. They want to grow and make professional gains. At the same time, the organization as a whole can benefit from the acquired collective knowledge. For example, an education program might include a component that focuses on security, which could help build a greater awareness about safeguarding data.

10. Empower individual team members.

An organization’s leadership should instill a sense of empowerment in individual DevOps team members. Although learning opportunities go a long way in achieving this goal, an organization can also take other steps. For example, it’s important to give team members the time and space needed to complete their tasks, while still providing room to learn and innovate, all of which can help increase job satisfaction and minimize boredom.

For many people, it’s also important that they’re provided with opportunities for advancement. One way to demonstrate this is by training internal staff for more advanced positions, such as a DevOps role, rather than bringing in people from outside. Of course, not everyone is looking for advancement opportunities, but they still want work that is engaging and challenging, and they want to be recognized for their efforts, which is why feedback and praise can be so important to overall job satisfaction.

Keeping DevOps people around

There are no hard and fast rules for attracting and retaining DevOps professionals, but these tips can help you get started with your own process. In the end, the people you bring into your organization and how long you keep them will depend on your specific circumstances and your current DevOps teams and operations. Your organization’s leadership will play a key role by helping to create a company culture that values each individual while recognizing the importance of building strong teams that break down silos. Not only is a team mindset imperative to effective DevOps, but it’s essential to attracting and retaining the right talent.


The post Ten tips for attracting and retaining DevOps talent appeared first on Simple Talk.


from Simple Talk https://ift.tt/36P6dsa
via

Predictions for Healthcare and Database Infrastructure in 2021

Why will healthcare organizations evolve the way they manage development and test databases?

Kathi Kellenberger writes: In the US, healthcare organizations must maintain accreditation and certification from Joint Commission and other governing bodies to receive reimbursements from Medicare and Medicaid among other benefits. The accreditations emphasize quality, documented processes, outcomes, and patient satisfaction. Organizations must also comply with HIPAA and other regulations.

Infrastructure as code (IaC) can help healthcare organizations meet these requirements by having standardized, documented, and repeatable processes that will allow the organization to provide value to patients and healthcare providers faster.      

Grant Fritchey writes: As the regulatory and compliance requirements of healthcare are constantly growing and changing, the need to quickly respond within IT has become more necessary. The ability to rapidly deploy new systems is vital. Further, as we’ve seen from the pandemic in 2020, there’s a need to be able to burst capabilities along with demand.

All of this taken together means that the healthcare sector has to adopt methods and mechanisms that let them respond to demand more quickly.

Kendra Little writes: There are three factors that make this important for healthcare organizations: 1) competition is fierce; 2) technological innovation to provide cost-savings is badly needed; 3) code quality is of utmost importance.

These things mean that healthcare development needs to move fast while ensuring that they have high quality code. Using traditional development infrastructure patterns– which feature stale datasets and configurations that don’t match production – slows teams down and adds risk.

How can healthcare organizations use data virtualization / lightweight database clones and snapshots?

Kathi writes: Healthcare is changing rapidly with innovations such as electronic medical records, telemedicine, patient collection of data through wearable devices, and data-driven therapy. It’s also subject to the whims of legislation and court decisions. Organizations must have the ability to move fast, usually faster than is comfortable.  IaC gives the ability to deliver solutions more quickly to comply and be competitive.  

Grant writes: The adoption of a DevOps style development approach generally does two things for any organization; increase protection for production environments and helps speed delivery of value for the organization. The value that a healthcare system has to deliver is also two-fold; support of the patients and clients and safe management of their information. Healthcare will be able to use DevOps and Infrastructure as a Service as a mechanism to support the need for bursts of patients, like during the pandemic.

Further, the added protections through automation of delivery, testing, and a more consistent environment means that they can do deliver this added functionality while still protecting the personal identifying information of the patients and clients.

Kendra writes: When it comes to database environments, infrastructure as code patterns provide a massive benefits to organizations who have large teams working on shared databases, or who have unpredictable release cadences. Infrastructure as code allows much greater flexibility when it comes to managing deployments.

How much do you see modernization of database infrastructure taking off with healthcare organizations in 2021?

Kathi writes: We are in unchartered waters right now in the midst of a global pandemic. I imagine that many organizations are struggling with day-to-day operations and don’t foresee making wholesale changes to the way they work. On the other hand, to stay competitive, healthcare organizations must find ways to move faster and innovate. IaC and DevOps practices can be beneficial in the long run, so I hope they are considering adopting these practices.    

Grant writes: Healthcare is generally not quick to move on new technology, depending on the field. There has been a steady growth in this area as the benefits become more and more visible across the industry. I expect the growth to continue and slowly accelerate. I don’t anticipate a giant leap forward, but rather a constant, and growing, general adoption as an obvious benefit.

Kendra writes: We’ve seen continued steady adoption in this sector over time. I think this trend will continue – strong, steady growth, even as some spending lessens due to the pandemic and economic pressures.

The post Predictions for Healthcare and Database Infrastructure in 2021 appeared first on Simple Talk.


from Simple Talk https://ift.tt/36NQvxv
via

Feature branches and pull requests with Git to manage conflicts

I’ve recently fielded two questions from different customers regarding how to best work as a team committing database changes to Git.

While there are a wide variety of branching models which work well for databases with Git — Release Flow, GitFlow, or environment-specific branching models – almost every successful Git workflow emphasizes two things:

  • Using feature branches (also known as topic branches) for the initial development of code
  • Using Pull Requests to merge changes from feature branches into a mainline or shared code branch

These two patterns are very common because Git encourages workflows that branch and merge often, even multiple times in a day. (To learn more about branching, read Branching in a Nutshell.)

In other words, Git is a powerful VCS and has very complex functionality at hand. In my experience, becoming familiar with patterns of branching, merging, and conflict resolution have helped make Git’s complexity easier to understand and have helped me feel like I’m working with Git – rather than constantly fighting against Git.

A pleasant side effect is that this also makes working with Git more fun: I’m able to work more frequently with common commands that work predictably and focus more on my work, rather than resolving an unexpected error.

What does this workflow look like?

If you’re not an experienced Git user, this probably sounds quite abstract. Here is a diagram of an example workflow which may help you visualize it. This workflow diagram shows a workflow with time flowing from left to right:

Branching diagram

In this workflow, there is a main branch. The main branch represents a mainline of code – it could be named master; it could be named trunk; the naming is up to your preferences. In this example, everything merged into the main branch is expected to be code that has been reviewed and is considered to be ready to be deployable to a QA environment via automation.

Let’s say that our developers are working with the free Git client in VSCode and are using a tool like Redgate’s SQL Source Control, Redgate Change Control, or SQL Change Automation to script their database changes and manage the state of their development databases. (I’m mentioning specific Redgate tools here because I’m very familiar with how they work – if you’re using other tools, they may follow similar flows as this. A lot depends on how the tool has been designed, how much of a Git client is implemented inside the tool, the types of files it uses, and the naming conventions of the files.)

A developer, Amy, has used VSCode’s Git client to create a branch named feature1 off main. Here’s how feature1 progresses:

  • Amy works in a dedicated development database and uses their database development tool of choice (SQL Source Control, Redgate Change Control, SQL Change Automation) to generate database code and commit it to their local clone of the Git repository.
  • After the second commit to feature1, Amy merges from the main branch into feature1 to check if any other commits have been made to main since the feature1 branch was created. In this case, there have been no commits to merge in.
  • When Amy believes their feature is complete, they do a final code generation and commit with their database development tool, then push the feature1 branch to the upstream repository.
  • Amy then creates a Pull Request in the upstream Git repository to merge feature1 into main.
  • The Pull Request process may run a build against the code and automatically add the appropriate reviewers. It also supports discussion and interaction about the change.
  • The Pull Request is approved and completed, resulting in Amy’s changes in feature1 being merged into main.

Another developer, Beth, creates the branch feature2 from main using VSCode’s Git client.

Beth happens to do this a short time after Amy created the feature1 branch, but before Amy used a Pull Request to merge her changes back into main.

  • By the time Beth decides that feature2 is ready to be shared, Amy already merged feature1 back into main via Pull Request.
  • Beth uses the Git client in VSCode to pull down main and see if anything has changed in it recently – and she finds that there have been changes.
  • Beth merges the main branch into feature2 and discovers that some of the files she changed when generating and committing code with her database tool was also changed in main.
  • This is presented as a conflict by the Git client in VSCode. The Git client asks Amy to resolve it for the feature 2 branch.
  • Amy has three choices for each file: she may decide to keep only her own changes which she made to feature2, take only the “incoming” changes (from main), or accept both and combine them. Amy may additionally make changes to the files involved in the conflict, such as fixing up commas or making other manual edits.
  • After deciding how to merge the changes (let’s say they are compatible changes and she decides to combine them), Amy saves the modified files in VSCode. She then stages (“adds”) them and commits the changes into the feature2 branch. This commit concludes the merge process.
  • At this point, it’s useful for Amy to validate that the merge has resulted in valid SQL and to update her development database with any changes she has accepted. She can do this by opening her database development tool and “apply” updates to her development database.
  • When ready to merge changes into main, Amy pushes her commits upstream in the feature1 branch, and follows the same Pull Request workflow described above to merge changes into main.

Q: Can the developers work in a shared database?

In this workflow, developers are working in isolated feature branches and sharing changes by merging. What if each developer doesn’t have their own copy of the database to associate with their feature branch?

First off, dedicated development databases solve many problems and promote better quality code. Troy Hunt outlines why this is the case in his post, The unnecessary evil of the shared development database from 2011. Although this post is a classic, it’s still highly relevant, and the only thing that has changed is that SQL Server Developer Edition is now completely free (it was inexpensive at the time the article was written).

That being said, if you must use a shared development database, you can try to work around the limitations. You may need to take special configuration steps, depending on the tool. For example, if you are using SQL Source Control, you may use a “custom” connection to access a shared database via Git. You may be able to use object locking in your database tool to mitigate the risks of overwriting each other’s work, but you will still see changes in the shared development databases made by other people appear as suggested changes which you could import to version control, which can be very confusing.

Essentially, even if you are sharing a single branch, using a distributed version control system such as Git – where developers each maintain their own local copy of the repo and do not all push and pull to the repo simultaneously – makes using a shared database environment for development awkward.

Whether or not you are using shared or dedicated databases, it is worth your while to get into the practice of using individual feature branches and a Pull Request workflow because of the following benefits.

Building good practices

There are five major things which I really like about this workflow:

1. Team members may share changes safely and easily – Imagine that Amy and Beth do the same changes as above at the same times, but they are both working in the main branch. If either Amy or Beth attempts to push new commits to the main branch and it has been updated since they last pushed, they will get an error that the origin has changed and they cannot push.

What if Amy or Beth is working on an experimental change that they’d like to get feedback on from a team member, without having to integrate other changes? There isn’t a good way to do that when they are sharing the branch.

2. You may push changes upstream regularly without fear – It’s convenient to work in a distributed VCS like Git because you can work in a disconnected fashion when you need to. If you’re using a hosted Git repo like Azure DevOps Services or GitHub and your internet connection fails, no problem! You can still commit locally. However, I think it’s also a good practice to back up your changes by regularly pushing them upstream to the repo. If you have a hardware failure locally or accidentally delete the wrong folder, no worries, you haven’t lost work. Working in a private topic branch means you can push your branch up to the upstream repo anytime without worry about needing to handle a conflict.

3. It makes merging purposeful and frequent – In the scenario where Amy and Beth are both working simultaneously on a shared branch, if one of them pushes a commit, the other will need to merge the changes the next time they pull. This may be done automatically by a Git client if there is no conflict, but if they are working on any of the same files, when pulling they will need to pause to go resolve the conflict. Because this occurs only sometimes on a pull, this feels like a distraction and a break in flow.

To contrast, if Amy and Beth have the habit of working in their own feature branches, they can develop a habit of periodically comparing their branch with mainline branches at the origin, and deciding when they want to merge in changes from those branches. This tends to make merges happen at a point when the developer is ready to consider the merge—not when they might be thinking about solving another problem.

3. It allows frequent commits – Many times when people begin working in a shared branch in Git, it isn’t just any branch – it’s a mainline branch. In other words, it’s a branch that regularly (and perhaps automatically) deploys code to an environment. Doing your early development work in a shared mainline branch like this has some bad effects: it means you are either less likely to experiment, or you are less likely to commit your changes regularly. After all, what if you commit something that is an experiment which you don’t want to get deployed? Well, you’re going to have to undo those commits – that’s not hard, but do you want a commit history full of doing things and then undoing them? Getting into the habit of working in feature branches gives you much more freedom: you can commit and undo commits knowing that at the time you get to a Pull Request, you’ll have some options on squashing your commit history easily when you merge in. Or, if you prefer not to squash commit history, you can always create a temporary feature branch from your existing feature branch to play around with some changes before you decide what you want to do.

5. It encourages early change review and communication – So far, I’ve mainly talked about using Pull Requests as the way in which you merge changes from one branch into another. This is only a small bit of the value PRs give you. PRs often function as a major point of communication and review. Most hosted Git options even allow you to do things like automatically add reviewers and require a specific number of reviewers for a PR to be approved. When a PR is opened, you may also have it automatically run a build and test the code, potentially even deploying it to an environment for the reviewers to examine. In short, PR workflows promote communication and review early in code development. The workflow can be a strong foundation for ensuring you have quality code.

Q: What if I forget to use a feature branch?

If you want everyone to use a PR workflow, you may choose to protect some branches. Many hosted Git providers allow ways to do this: you can configure protected branches in GitHub, create a branch policy in Azure DevOps, or set Branch Permissions in BitBucket, for example. The protections or policies are generally enforced upstream at the origin. If you commit changes locally to a protected branch and attempt to push them, this will result in an error that you’re not allowed to change the upstream branch directly. In this case, you can usually create another branch locally off your updated main branch and proceed from there. If you have some work in progress that you aren’t ready to commit, you may want to stash it.

A detailed video example – “SQL Source Control and VSCode: Handling Git Conflicts”

In this video, I’m using a dedicated development database model with the following setup:

  • Azure DevOps Services Organization and Project – this hosts the upstream Git Repo.
    • The upstream repo is used to push and pull changes for Git clients doing the work. The upstream Git Repo is also where Pull Requests are created, reviewed, approved, and completed.
    • I have cloned two copies of the same Git repo to my local workstation so that I can simulate working as two people, each in their own local repo.
  • SQL Source Control – this compares the SQL Server database to the code in the Git Repo.
    • It identifies when there are changes in the development database to commit to the repo, automatically scripts changes to commit to the repo, and helps keep the development database in sync when new changes come from the Git repo.
    • I’ve already created a SQL Source Control project and committed it to the repo. Both of my local copies of the repo begin with having pulled down copies of the project.
  • VSCode and Azure Data Studio – These free tools from Microsoft share the same free Git client. In this example I use these tools to manage my merge conflicts.
    • I’m using VSCode to represent one user and Azure Data Studio to represent the other, simply because I can set different color schemes in them and it makes it easier for me to track.
    • I have the free GitLens extension installed in both VSCode and Azure Data Studio. This extension makes it easy to see details of commit history and has many more useful options. This is totally optional, simply nice to have in my experience.

A list of chapters is below if you’d like an overview, or if you’d like to jump to specific sections.

Chapters in the video:

  • 00:00 Overview of the demo setup
  • 02:07 Demo begins of a merge conflict when working in the same branch as your teammates
  • 03:17 Why conflicts occur as interrupts if we work in the same branch in Git
  • 04:35 Interpreting Git conflict messages in SQL Source Control
  • 05:58 Resolving a merge conflict within your current branch
  • 08:37 Why working in private feature branches is a common practice for Git users
  • 10:42 Traveling back in time with the GitLens extension
  • 12:07 Resetting SQL Source Control after resetting in Git
  • 14:30 Demo begins of working in a feature branch in SQL Source Control, and proactively merging from main when we’re ready
  • 15:17 Checking out a new branch in VSCode
  • 18:18 Merge changes from the upstream main branch into our feature branch. I have enabled VSCode to regularly fetch changes, so I haven’t manually ‘fetched’.
  • 20:38 Resolving the conflict in VSCode
  • 23:40 Staging and committing to complete the merge
  • 25:05 Applying changes we made in VSCode to our dev database in SQL Source Control
  • 26:06 Pushing our changes to the central Git repo and creating a Pull Request
  • 29:00 Approving and completing the Pull Request

Branching and merging in Git is not as hard as it may seem at first glance!

If you are new to Git, this can seem daunting to learn.

While Git can be quite complex, I have found that hands-on experience with Git and practicing in a test project got me a long way, and it happened faster than I expected. The branching workflows described in this article have also made my work in Git flow easier, which has made it less frustrating and more fun.

I hope this pattern proves useful to your team as well.


The post Feature branches and pull requests with Git to manage conflicts appeared first on Simple Talk.


from Simple Talk https://ift.tt/3oyLzCy
via

Thursday, December 3, 2020

Why it makes sense to monitor SQL Server deadlocks in their own Extended Events trace

We recently had customer ask why SQL Monitor creates an Extended Events session to capture deadlock graphs, when SQL Server has a built-in system-health Extended Events trace which also captures deadlock information?

There are a couple of reasons why a dedicated trace is desirable for capturing deadlock graphs, whether you are rolling your own monitoring scripts or building a monitoring application. I like this question a lot because I feel it gets at an interesting tension/balance which at the heart of monitoring itself.

Segmentation is helpful for users

One reason that SQL Monitor uses a separate Extended Events trace is to segment off what is used by SQL Monitor. This helps administrators understand what is impacted if they stop or modify an Extended Events session. 

While Microsoft recommends that administrators don’t stop, alter, or delete the system_health session, in practice it’s quite easy to do any of these things. An administrator might assume if they have installed other monitoring software that they could stop, delete, or modify the definition of system_health without impacting the alternate monitoring.

Extended Events sessions have retention policies

The current implementation of the system_health session is that it writes data both to an asynchronous ring buffer target and to an event_file. The event files currently have a maximum file size of 5MB and can roll over to 4 files.

While this is a sensible configuration for most systems, the system_health session collects multiple events. In some scenarios, it’s possible for these events to generate a significant amount of data quickly, which could plausibly use up a lot of the event file space and roll off other events. 

It’s also quite possible for Microsoft to add additional events or change the amount of data retained for these logs at any time.

These factors make it desirable to use a separate trace for distinct events which you care about for monitoring purposes. This way you control your own retention policies and can isolate events to their own traces as needed. 

Deadlock reports are lightweight to collect in Extended Events

When creating any Extended Events trace against a production instance, it’s important to evaluate the performance impact of the events you’re collecting. 

The xml_deadlock_report event, for example, is a lightweight event to collect. 

Other events have a greater impact on the instance. The most famous example of this is that starting an Extended Events trace that collects ‘actual’ execution plans using the ‘query_post_execution_showplan’ event can very quickly slow down a SQL Server instance — even if you have applied a filter to only collect plans for a very specific query! This event unfortunately has a very high overhead which filtering does not reduce. (There are some alternatives, but it gets complex pretty fast.)

Monitoring is an art of balancing between observation and impact

I like this example because it gets at a core challenge of monitoring: we always need to balance the impact of observation with the benefits of the data we collect. This is always a tough problem as you build monitoring software, as monitoring queries are also subject to variances in query optimization and performance in a database, just like any other activities.

In the case of deadlock graphs, the impact of collecting these in a dedicated Extended Events session is low enough that the benefits of segmenting this out are persuasive, in my view.

Want to learn more about deadlocks?

The post Why it makes sense to monitor SQL Server deadlocks in their own Extended Events trace appeared first on Simple Talk.


from Simple Talk https://ift.tt/37ujgOP
via

Tuesday, December 1, 2020

Deep Learning with GPU Acceleration

Deep Learning is the most sought-after field of machine learning today due to its ability to produce amazing, jaw-dropping results. However, it was not always the case, and there was a time around 10 years back when deep learning was not a field considered by many to be practical. The long history of deep learning shows that researchers proposed many theories and architectures between the 1950s to 2000s. However, training large neural networks used to take a ridiculous amount of time due to the limited hardware support of those times. Thus, neural networks were deemed highly impractical by the machine learning community.

Although some dedicated researchers continued with their work on neural networks, the significant success came in the late 2000s when researchers started experimenting with training neural networks on GPUs (Graphics Processing Unit) to speed up the process, thus making it somewhat practical. It was, however, the 2012 Imagenet challenge winner Alexnet model which was, trained parallelly, on GPUs, that inspired the use of GPUs to the broader community and catapulted deep learning into the revolution seen today.

What is so special about GPUs that they can accelerate neural network training? And can any GPU be used for deep learning? This article explores the answers to these questions in more detail.

CPU vs GPU Architecture

Traditionally, the CPU (Central Processing Unit) has been the leading powerhouse of computers responsible for all computations taking place behind the scenes on the computer. The GPU is special hardware that was created for the computer graphics industry to boost the computing-intensive graphics rendering process. It was pioneered by NVIDIA who launched the first GPU Geoforce 256 in 1999.

Architecturally, the main difference between the CPU and GPU is that a CPU generally has limited cores for carrying out arithmetic operations. In contrast, a GPU can have hundreds and thousands of cores. For example, a standard high performing CPU generally has 8-16 cores whereas NVIDIA GPU GeForce GTX TITAN Z has 5760 cores! Compared to CPUs, the GPU also has a high memory bandwidth which allows it to move massive data between the memory. The figure below shows the basic architecture of the two processing units.

CPU vs GPU Architecture

Why is the GPU good for Deep Learning?

Since the GPU has a significantly high number of cores and a large memory bandwidth, it can be used to perform high-speed parallel processing on any task that can be broken down for parallel computing. In fact, GPUs are incredibly ideal for embarrassingly parallel tasks that require no effort to break them down for parallel computation.

It so happens that the mathematical matrice operations of the neural network also fall into the embarrassingly parallel category. This means GPU can effortlessly break down the matrice operation of an extensive neural network, load a huge chunk of matrice data into memory due to the high memory bandwidth, and do fast parallel processing with its thousands of cores.

A researcher did a benchmark experiment by running the CNN benchmark on the MNIST dataset on GPU and various CPUs on the Google Cloud Platform. The results clearly show that CPUs are struggling with training time, whereas the GPU is blazingly fast.

GPU vs CPU performance benchmark (Source)

NVIDIA CUDA and CuDNN for Deep Learning

Currently, Deep Learning models can be accelerated only on NVIDIA GPUs, and this is possible with its API called CUDA for doing general-purpose GPU programming (GPGPU). CUDA which stands for Compute Unified Device Architecture, was initially released in 2007, and the Deep Learning community soon picked it up. Seeing the growing popularity of their GPUs with Deep Learning, NVIDIA released CuDNN in 2014, which was a wrapper library built on CUDA for Deep Learning functions like backpropagation, convolution, pooling, etc. This made life easier for people leveraging the GPU for Deep Learning without going through the low-level complexities of CUDA.

Soon all the popular Deep Learning libraries like PyTorch, Tensorflow, Matlab, and MXNet started incorporating CuDNN directly in their framework to give a seamless experience to its users. Hence using a GPU for deep learning has become very simple compared to earlier days.

Deep Learning Libraries supporting CUDA (Source)

NVIDIA Tensor Core

By releasing CuDNN, NVIDIA positioned itself as an innovator in the Deep Learning revolution, but that was not all. In 2017, NVIDIA launched a GPU called Tesla V100, which had a new type of Voltas architecture built with dedicated Tensor Core to carry out tensor operations of the neural network. NVIDIA claimed that it was 12 times faster than its traditional GPUs built on CUDA core.

Voltas Tensor Core Performance (Source)

This performance gain was possible because its Tensor Core was optimized to carry out a specific matrice operation of multiplying two 4×4 FP16 matrices and add another 4×4 FP16 or FP32 matrices. Such operations are quite common in neural networks; hence an optimized Tensor Core for this operation could boost the performance significantly.

Matrice Operation supported by Tensor Core (Source)

NVIDIA added support for FP32, INT4, and INT8 precision in the 2nd generation Turing Tensor Core architecture. Recently, NVIDIA released the 3rd generation A100 Tensor Core GPU based on Ampere architecture with support for FP64 and a new precision Tensor Float 32 which is similar to FP32 and can deliver 20 times more speed without code change.

Turing Tensor Core Performance (Source)

Hands-on with CUDA and PyTorch

Now take a look at how to use CUDA from PyTorch. This example carries out multiple operations both on CPU and GPU and compares the speed. (code source)

First, import the required numpy and PyTorch libraries.

Now multiply the two 10000 x 10000 matrices with CPU using numpy. It took 1min 48s.

Next, carry out the same operation using torch on CPU, and this time it took only 26.5 seconds

Finally, carry this operation using torch on CUDA, and it amazingly takes just 10.6 seconds

To summarize, the GPU was around 2.5 times faster than the CPU with PyTorch.

Points to consider for GPU Purchase

NVIDIA GPUs have undoubtedly helped to spearhead the revolution of Deep Learning, but they are quite costly, and a regular hobbyist might not find it very pocket friendly. It is essential to purchase the right GPU as per your needs and not go for high-end GPUs unless really required.

If your needs are to train state of the art models for regular use or research, you can go for high-end GPUs like RTX 8000, RTX 6000, Titan RTX. In fact, some of the projects may also require you to set up a cluster of GPUs which will require a fair amount of funds.

If you intend to use GPUs for competitions or hobbies and have the money, you can purchase medium to low-end GPUs like RTX 2080, RTX 2070, RTX 2060 GTX 1080. You also have to consider the RAM required for your work since the GPUs come with different RAM sizes and are priced accordingly.

If you don’t have the money and would still like to experience GPU, your best option is to use a Google Colab that gives free but limited GPU support to its users.

Conclusion

I hope this article gave you a very useful introduction into how GPUs have revolutionized Deep Learning. The article made an architectural and practical comparison between CPU and GPU performance and also discussed various aspects that you should consider while choosing GPU for your project.


The post Deep Learning with GPU Acceleration appeared first on Simple Talk.


from Simple Talk https://ift.tt/3mnyN9D
via