Wednesday, November 15, 2023

PASS Summit 2023 – Microsoft Keynote – Limitless growth, limitless opportunities: Data and innovation in an AI world

CEO of Redgate: Jakub Lemik:

This year’s theme is Connect, Share, and Learn. Tomorrow will be 

People are here from 44 countries. The summit has 5 tracsk, 232 sessions with 231 speakers!

43% of attendees are first timers!

Thank you sponsors! (Image coming soon)

Next year’s Summit: 4-8 November 2024!

Vice President of Azure Databases: Shireesh Thota

Community is important to making this all work. Azure Data Community: 150000+ members, 172+ user groups, 44 countries! 

Microsoft loves your feedback!

Showing a history of Microsoft SQL Server. Either the crowd is quite, or not a lot of people here worked with SQL Server 1.0, or even 6.5, I feel old! 

Not sure of the name of the next speaker, from Microsoft

SQL from edge to the cloud. Develop once, deploy anywhere. Last year they announced SQLServer 2022, SQL Server 2022 is the fastest adopted version of SQL Server. Paid instances grew 19% on Windows, and 15% on Linux.

One of the key innovations as been Azure Arc. It extends data services to your data estate. Brings Management, Governance (Purview), and Security (Defender). 

Announcing!

  • Monitoring for SQL Server – Preview
  • Enhanced HA/DR management – Preview
  • Extended Security Updates as a service and Automated patching – Generally Available
  • Azure SQL Managed Instance feature wave – Generally Available (Included things like being able to stop and start the platform.
  • Azure SQL Managed Instance free offer! – Preview. Will give you up to a year of MI to try out the platform

Vladamir Ivanovic

Cloud Modernization Journey – Evaluate, Optimize, Migrate, and Modernize

Demoing Managed Instance, showing how they have Business Critical level, and MI Link. And you can use it to migrate to a Managed Instance.

With an MI instance, you are just a few steps away from modernizing your application by connecting to Microsoft Fabric.

Vice President of Azure Databases: Shireesh Thota Returns

Asks a question about who is building AI apps. No a lot of replies from the crowd!

It is generally accepted forecast that 500 million new apps will be built in next 5 years.

Announcing: Azure SQL Database Hyperscale – Same price as commercial OSS databases- Generally available 

Bob Ward and Conor Cunningham

Both wearing proper clothes for a keynote . GO Cowboys (picture to be added)

Showing us things about hyperscale (and they have a developer edition). Batch mode working on hyperscale. Making lots of investments on this. And always trust Conor (Conor is super smart, but so is Bob).

Next showing how they have solved the schema lock problem. Added a column to a table and other queries didn’t see the column until after it had finished (and was committed).

Next showing a Chat Playground to have a chat session with the data in their SQL Server. You can even build a stored procedure to do the same thing with the database! (Uses the REST API interfaces in the T-SQL)

The Bob and Conor Show did not let us down!

Vice President of Azure Databases: Shireesh Thota Returns

Azure Cosmos DB for AI apps; AI Built-In, Guaranteed performance and scale, Flexibility and efficiency, Mission Critical

Announcing: Dynamic scaling per partition and per region – Public preview

Azure Database for PostgreSQL and MySQL

Fully managed community databases, Built in intelligence, Best total cost of awnershipt

Announcing: Azure Database for PostgreSQL Improvements

  • Premium SSD v2 – public preview
  • Near Zero Downtime Scaling -generally available
  • IOPs Scaling – public preview

Announcing: Azure Database for MySQL Improvements

  • Performance enhancements with Accelerated Logs – Public Preview

The post PASS Summit 2023 – Microsoft Keynote – Limitless growth, limitless opportunities: Data and innovation in an AI world appeared first on Simple Talk.


from Simple Talk https://ift.tt/3vRcgKS
via

Autonomous Databases?

I was talking to some people today about the concept of Autonomous Databases. The idea is that the database platform can do most, if not all, of the work of storing and managing data by itself.  

These are a few of the concepts that were shared, primarily as discussion points, but you have to be in complete denial if you think that no one is working on such a thing: 

Self-driving: The platform could do all the mundane tasks like tuning queries, adding more resources, backing up databases, patching, etc. Without your intervention. 

Self-healing: When system errors occur, the system could heal itself. It might handle high availability for you in case of crashes, then rebuild the replica. 

Self-securing: Detecting any external and internal attacks. For example, a user just happens to be selecting all the data from all your tables. It might also detect personal information being stored and encrypt that data for you. 

Self-scaling: Scaling up and down based on your needs. 

Self-cost managing: Making sure you spend the least amount of money needed. 

Self-designing: You tell the server what you want to store, and then it could create tables and interfaces for you. 

If you search for the term, you will likely find a lot about Oracle’s product of the same name which is a start of this. Azure SQL DB does some of this too. But think of the concept as going all the way into each of these concepts.

This all really starts to sound very Skynet, right? The machines are taking over! Sort of, maybe. There will likely be a day when we can create an AI that rolls up the knowledge of all the great data architects and DBAs in this world. This AI will be able to manage many databases on many servers and platforms better than most people.  

I don’t see platforms becoming truly autonomous anytime soon, if ever. There is just too much that needs to be known about how a system will be used for an AI to operate. What data are you storing, when is this used, when do you expect large numbers of users, and what to do if you need to spend more than a certain amount? But what if the AI just said, “Transactions are very high; can I scale higher than the current spending threshold will allow”? 

Clearly, there is a lot of control that you would have to give up and plenty of concerns. My question for you to think about (and reply to in the comments is this: As a DBA, what control would you give to AI to manage your databases?  


The post Autonomous Databases? appeared first on Simple Talk.


from Simple Talk https://ift.tt/XTnAIY8
via

Monday, November 13, 2023

Getting Started with MongoDB

MongoDB is a scalable database management system that stores data as documents in a collection, rather than as rows in a table, such as you’d find in a relational database system. A document is an object made up of one or more field and value pairs that contain related data. A field’s value can be one of a variety of data types, including arrays or embedded documents. Support for such data types eliminates the need to create the type of complex joins used in relational database.

MongoDB is a NoSQL database system. The acronym NoSQL, which means “not only SQL,” is a term used to describe various types of non-relational databases. NoSQL databases offer more flexibility and greater scalability than relational databases and are often better suited to many of today’s modern workloads. A variety of NoSQL databases are in use today, including document databases, graph databases, wide-column stores, and key-value stores.

MongoDB is considered a type of document database because data is stored as documents. A MongoDB document is similar to a JavaScript Object Notation (JSON) object, a lightweight structure made up of unordered name/value pairs. MongoDB documents are simple to read and understand, yet they can support complex requirements, in part because they can be structured differently within the same collection. This allows a MongoDB database to hold structured data (like a relational database), but also semi-structured and even unstructured data.

MongoDB comes in three editions:

  • MongoDB Atlas. A managed service for deploying MongoDB in the cloud. The service includes a free tier, which is ideal for trying out and learning about MongoDB.
  • MongoDB Community. An on-premises solution that you can download and install for free. It is available for Linux, macOS, and Windows and can be installed within a Docker container. Like the free tier on MongoDB Atlas, the Community edition is ideal for trying out and learning about MongoDB.
  • MongoDB Enterprise. An on-premises, subscription-based solution that includes advanced management and security features for supporting mission-critical workloads. Like the Community edition, the Enterprise edition is available for Linux, macOS, Windows, and Docker.

The basic database functionality is the same regardless of which edition you’re using. If you’re new to MongoDB, you can take advantage of one of the free versions to start exploring the MongoDB environment and learn what it takes to work with document data.

To help with this process, this article introduces you to MongoDB and shows you how get started. The article explains how to connect to MongoDB, create a database and collection, and add a few documents. This article is the first in a series on MongoDB that explores the various ways you can manage and interact with the document data.

For the examples in this article, I use the MongoDB Atlas free tier. I think this is a good way to get to know the platform if you’re new to MongoDB and want to get a sense of how a document database works. This way, you can learn about MongoDB without having to install it on your system or make any long-term commitments. You can also easily access your MongoDB databases from multiple systems.

To interact with MongoDB Atlas, I used MongoDB Compass, an on-premises GUI that you can download for free from the MongoDB site. MongoDB Compass is available for Linux, Windows, and macOS (x86_64 or ARM64). Although you can also use the MongoDB Shell to interact with MongoDB, I think the GUI is a good way to start learning about MongoDB. Compass also comes with the MongoDB Shell embedded directly into the interface, so you get the best of both worlds.

Connecting to MongoDB Atlas from MongoDB Compass

If you want to follow along with the examples in this article (and those in the rest of the series), you’ll need to set up a MongoDB Atlas account and create your first cluster. You’ll also need to install MongoDB Compass on your system and make sure it’s up and running. I installed Compass on a Mac computer, but you can run it on any of the supported platforms.

To set up MongoDB Atlas, you’ll need to head to the Atlas website and register for the service. You should then follow the online instructions to set up your first cluster, referring to the Atlas documentation as necessary. In the next section I will go though the steps that I took as well.

Atlas organizes its services based on a specific hierarchy: Organization > Project > Cluster. However, this hierarchy might not be readily apparent as you step through the process of creating your first cluster. In some cases, Atlas refers to this process as a deployment, which can add to the confusion.

Regardless of how you get there, your main goal is to set up your first cluster so you can connect to it from MongoDB Compass. For this article, I set up my Atlas environment with an organization named org1, a project named proj2, and a cluster named clust1. The following figure shows the Atlas environment after I set up the clust1 cluster.
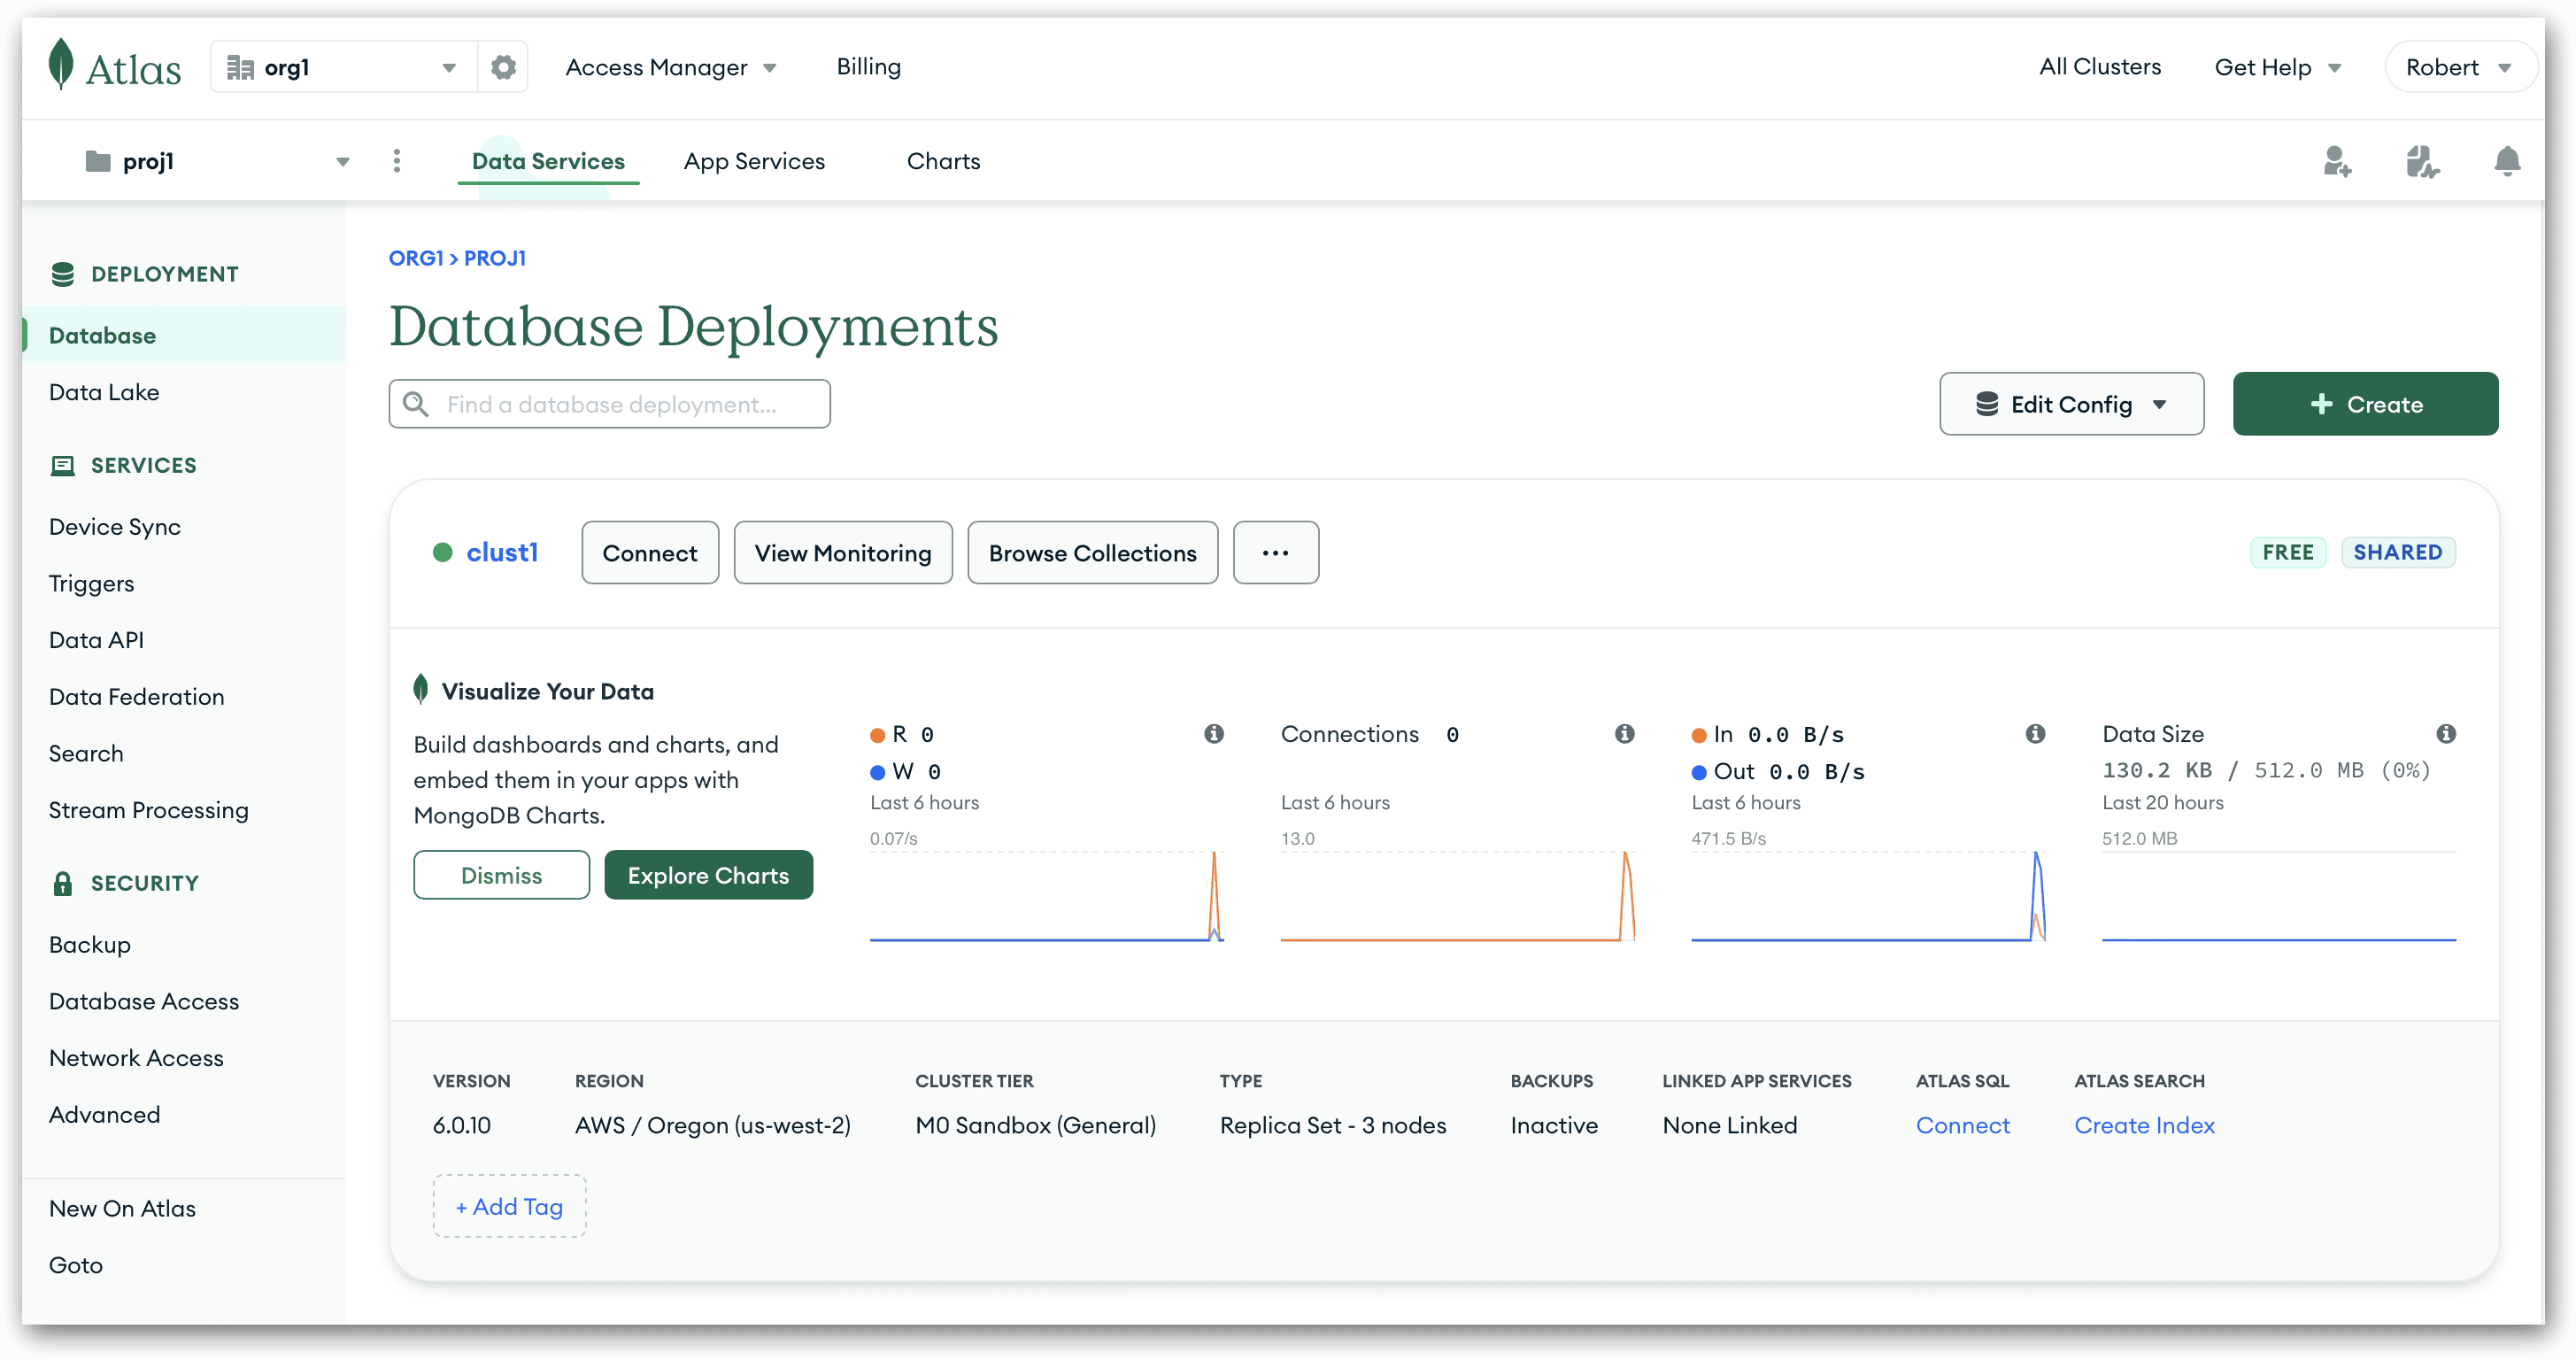
You can use whatever names you want when setting up your Atlas environment. If you use names different from mine, some of the labels you’ll see in the screenshots will not be the same as on your system, but this is a minor issue.

When first setting up your Atlas environment, you’ll be prompted to create a deployment, which steps your through the process of setting up your first cluster. During this process, be sure to select the M0 tier, which is the free service tier available for learning about MongoDB.

You’ll also need to select a provider (AWS, Google Cloud, or Azure) and a region, such as N. Virginia (us-east-1) or Tokyo (ap-northeast-1). Of course, you should pick a region as near to you as possible. Just make sure you select the M0 tier before choosing the provider and region because the free tier is not available to every location.

After you define the basic configuration, you’ll be prompted to create a database user account. This account is different from your MongoDB Atlas account, so you should provide a new username and password. Keep the password handy because you’ll need it again shortly.

After you create the database account, you must then add the IP address of the computer where you’ll be running MongoDB compass. If it’s the same computer you’re using to set up your Atlas environment, simply click Add My Current IP Address. Otherwise, you’ll need to specify the correct IP address. If you have connection issues, this is typically a good first place to start since ISP’s sometimes change addresses without you expecting it.

Note: I’m providing you with only an overview of how to set up your MongoDB Atlas environment. Be sure to carefully read the available documentation and follow the online prompts so you set up your cluster correctly, especially when it comes to selecting the select the M0 service tier. This section is meant only to offer you some pointers for getting started. It is by no means an exhaustive Atlas tutorial.

I would also not consider this method of setting up your cluster good enough for private/personal information.

After you’ve completed setting up your cluster, you should be taken to the Database Deployments screen, which might be only an abbreviated version of the one shown in the figure above. On either version of the screen, there should be a Connect button, which provides access to the connection string you’ll need for MongoDB Compass. When you click the Connect button, you’ll be presented with the Connect to dialog box, as shown in the following figure.
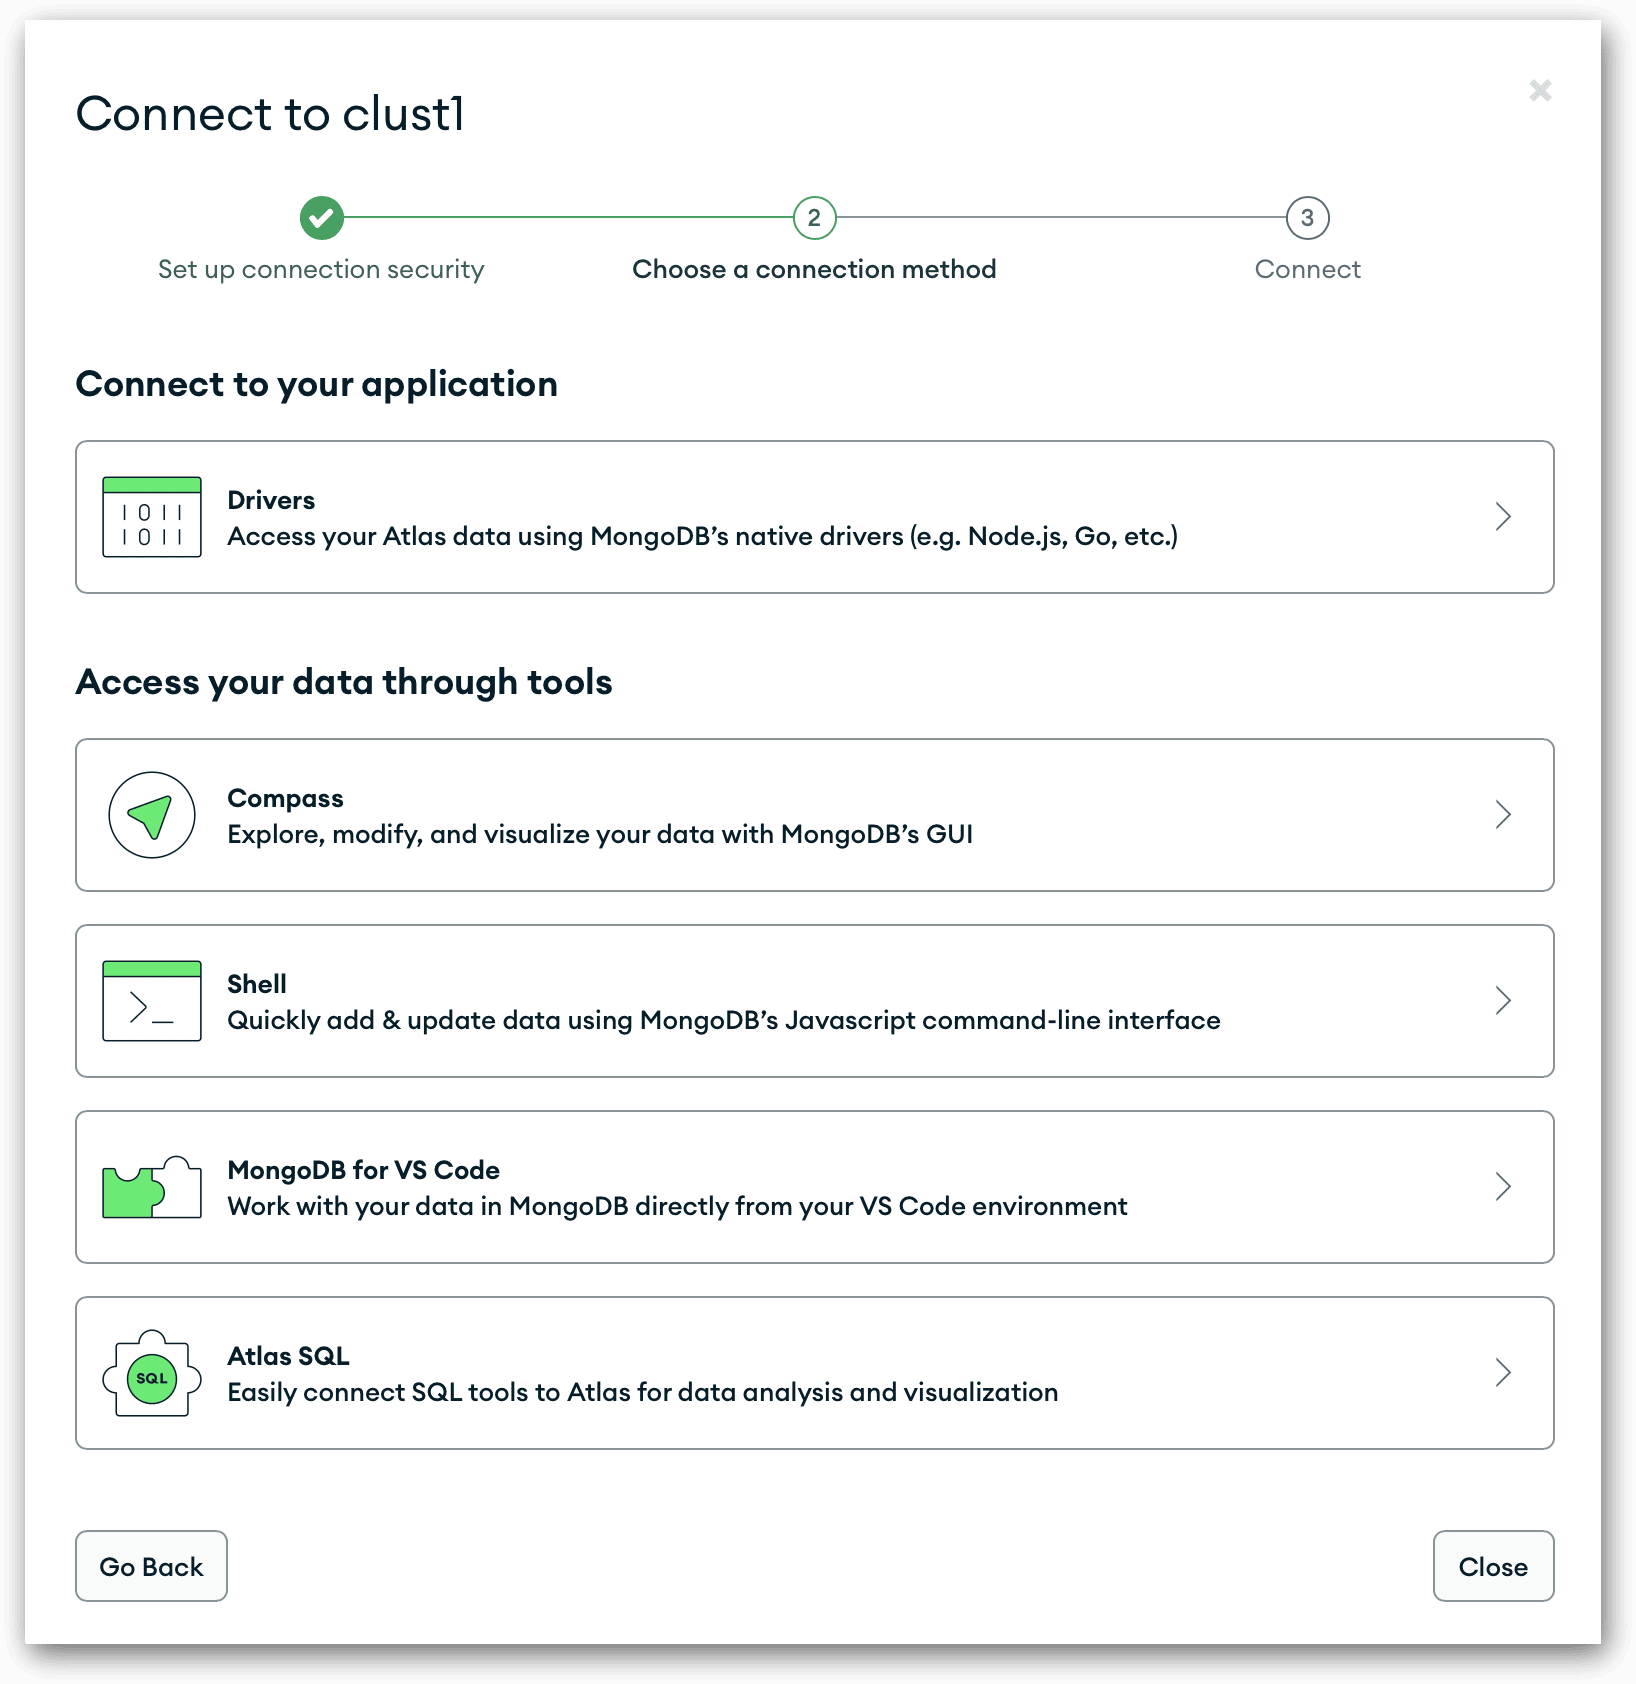
In this dialog box, click the Compass option and, on the next screen, copy the connection string to your clipboard. The connection string includes the username of the database account you just created, followed by a colon and the <password> placeholder. You’ll need to replace the placeholder with the actual password.

If you haven’t already done so, launch MongoDB Compass, which should open to the New Connection screen, shown in the following figure. In the URI text box, delete the default connection string, paste in the connection string from the clipboard, and replace the <password> placeholder with your password.
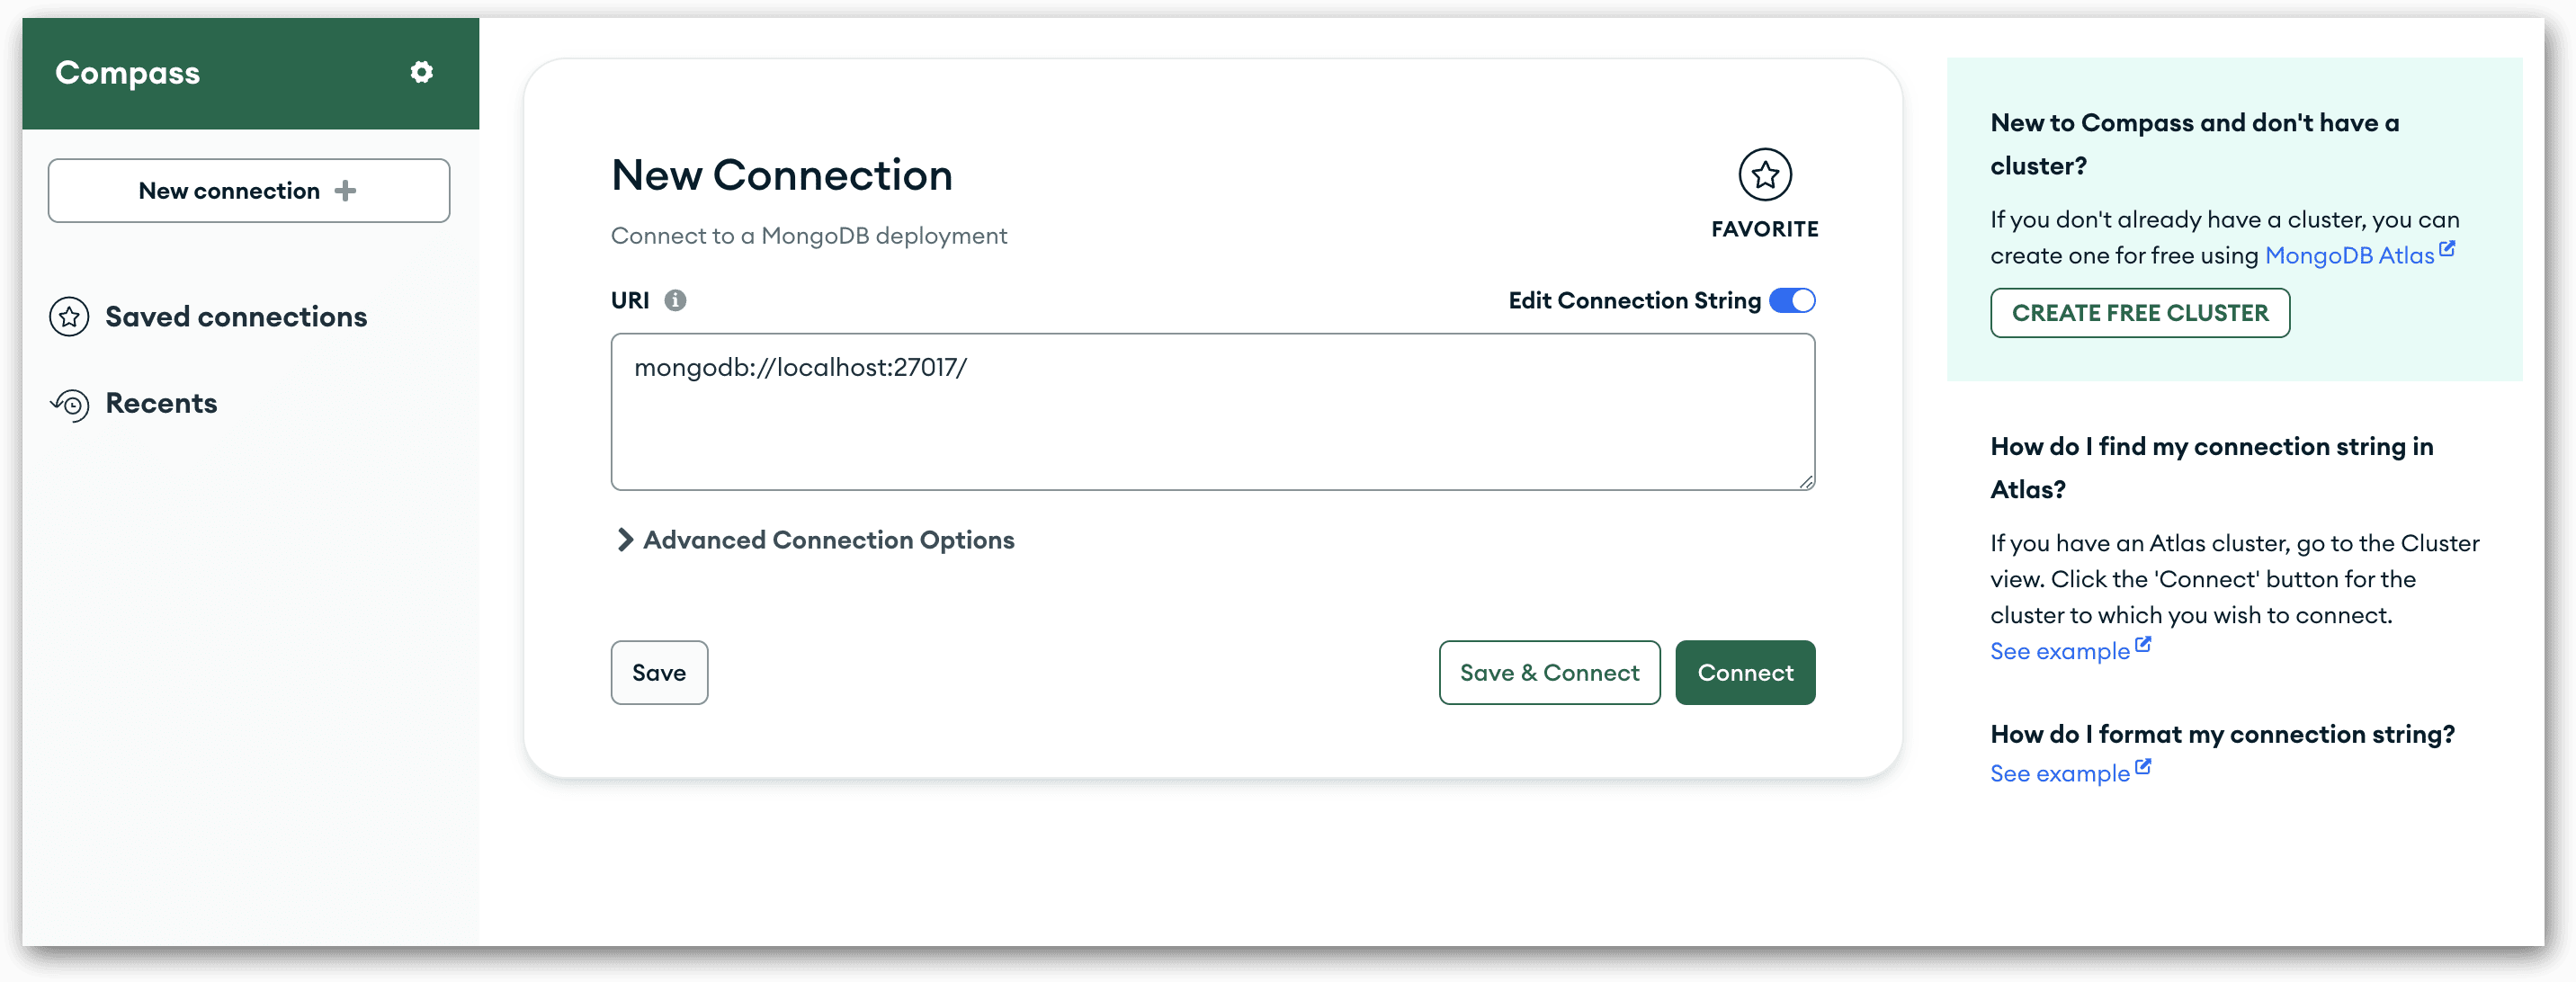
Next, click the edit icon (pencil) to the right of the New Connection title. You need to hover near the title to see the icon. In the Edit favorite dialog box, type a name for the connection, select a color, if desired, and click Save. (On my system, I named the connection connect1 and selected dark green as the color.) Now click Connect.

This should connect you to your Atlas cluster and display the My Queries tab in the Compass main window. The left panel should also show two databases nodes: admin and local. MongoDB automatically creates these databases for administrative purposes. You do not need to be concerned with them for now. Just don’t mess with them.

After you’ve established a connection to Atlas, you can sign out of the Atlas service through your browser. Your cluster will continue to run and be available to Compass, where you can add your first database and collection.

If for some reason, you don’t want to create an Atlas account, you can install the MongoDB Community edition on your local computer. I used Homebrew to install it on my Mac, but you’ll need to check the MongoDB documentation for your system.

Once you’ve installed the Community edition, you can create a connection in Compass that points to your MongoDB instance. If Compass and MongoDB are running on the same system, should be able to use the default connection string (mongodb://localhost:27017) when you create your connection in Compass. Refer to the MongoDB documentation for more information.

Whether you connect to Atlas or the Community edition, the process of working MongoDB data is the same. This means you’ll still be able to follow along with the examples in the rest of the article, as well as with those in the rest of the series, because the core functionality is the same in both environments.

Creating a MongoDB database and a collection

Now that we’ve gotten through the setup process, we can move onto something more interesting, which is to create a database and a collection. In MongoDB, a database is simply a container for one or more collections. A collection, in turn, is a structure for holding zero or more documents, similar to a table in a relational database.

Normally, the documents in a collection are related in some way, like rows in a relational table, but this is not an absolute requirement in MongoDB. In fact, the documents don’t even need to adhere to the same structure like a table does. The ability for documents to have different structures within the same collection is a big part of MongoDB’s flexibility. That said, MongoDB does let you define validation rules to enforce a data structure on a collection’s documents, something I’ll be discussing later in this series.

With that in mind, let’s returns to MongoDB Compass. When you click the Databases node in the left panel, Compass displays the current databases in the main window, as shown in the following figure.
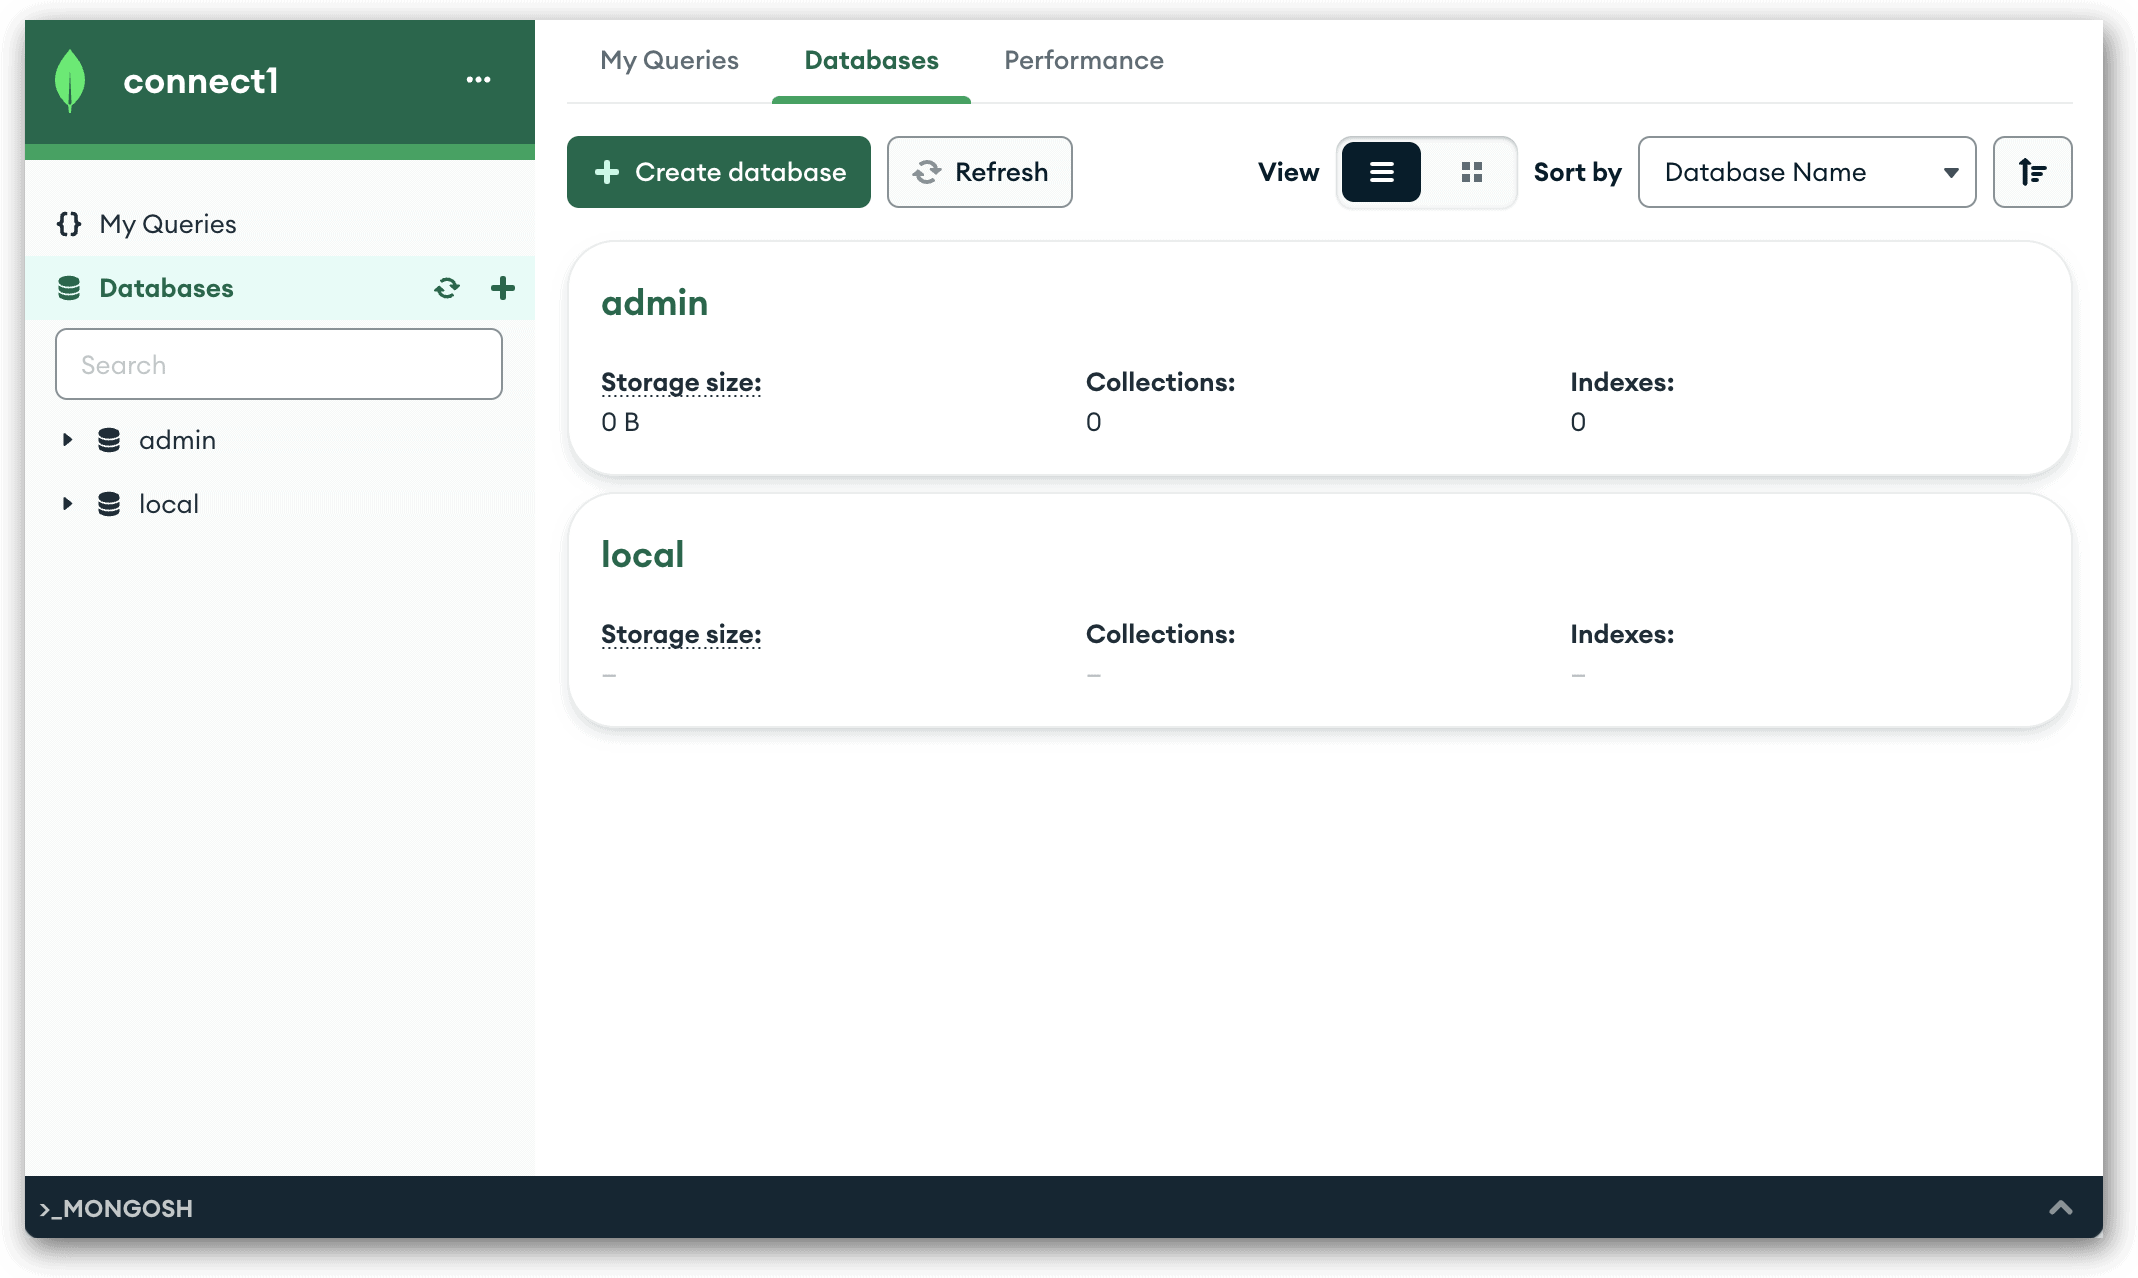
Currently, only the admin and local databases should exist, unless you already created other databases. Even if you have, we’re now going to add our own database and collection, which we’ll do in a single step. When you add a database in Compass, you must add a collection at the same time.

Start by clicking the Create database button (plus sign) to the right of the Databases node in the left panel. This launches the Create Database dialog box, shown in the following figure.
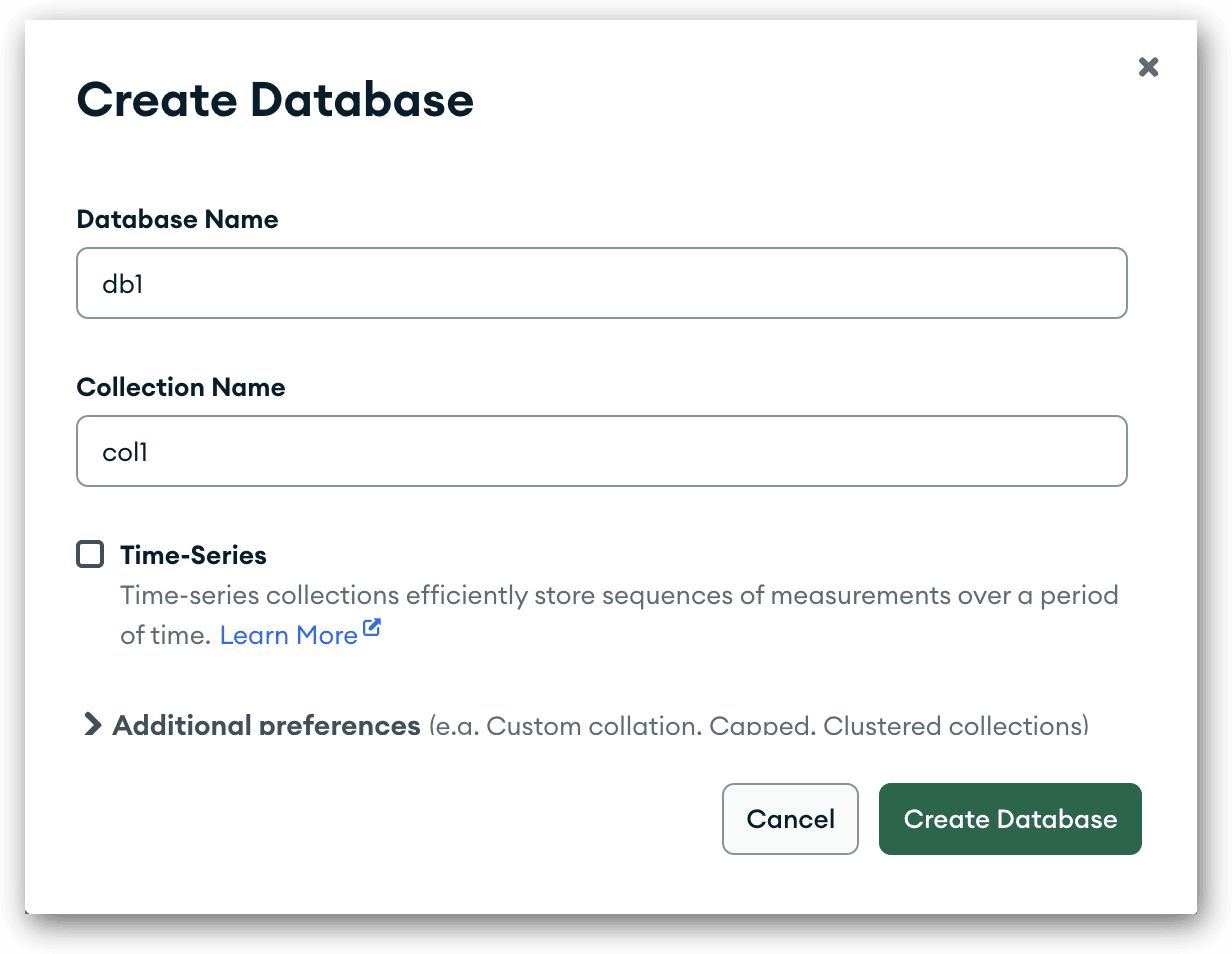
I’ve already filled in the database name (db1) and collection name (col1), but you can name them whatever you want. For now, we’re going to create a basic collection. Later in the series, we’ll discuss other collection types.

After you’ve provided the database and collection names, click Create Database. MongoDB will create both the database and collection and return you to the main Compass window. The db1 database node is now be listed in the left panel, along with the col1 collection node, which should be selected, as shown in the following figure.
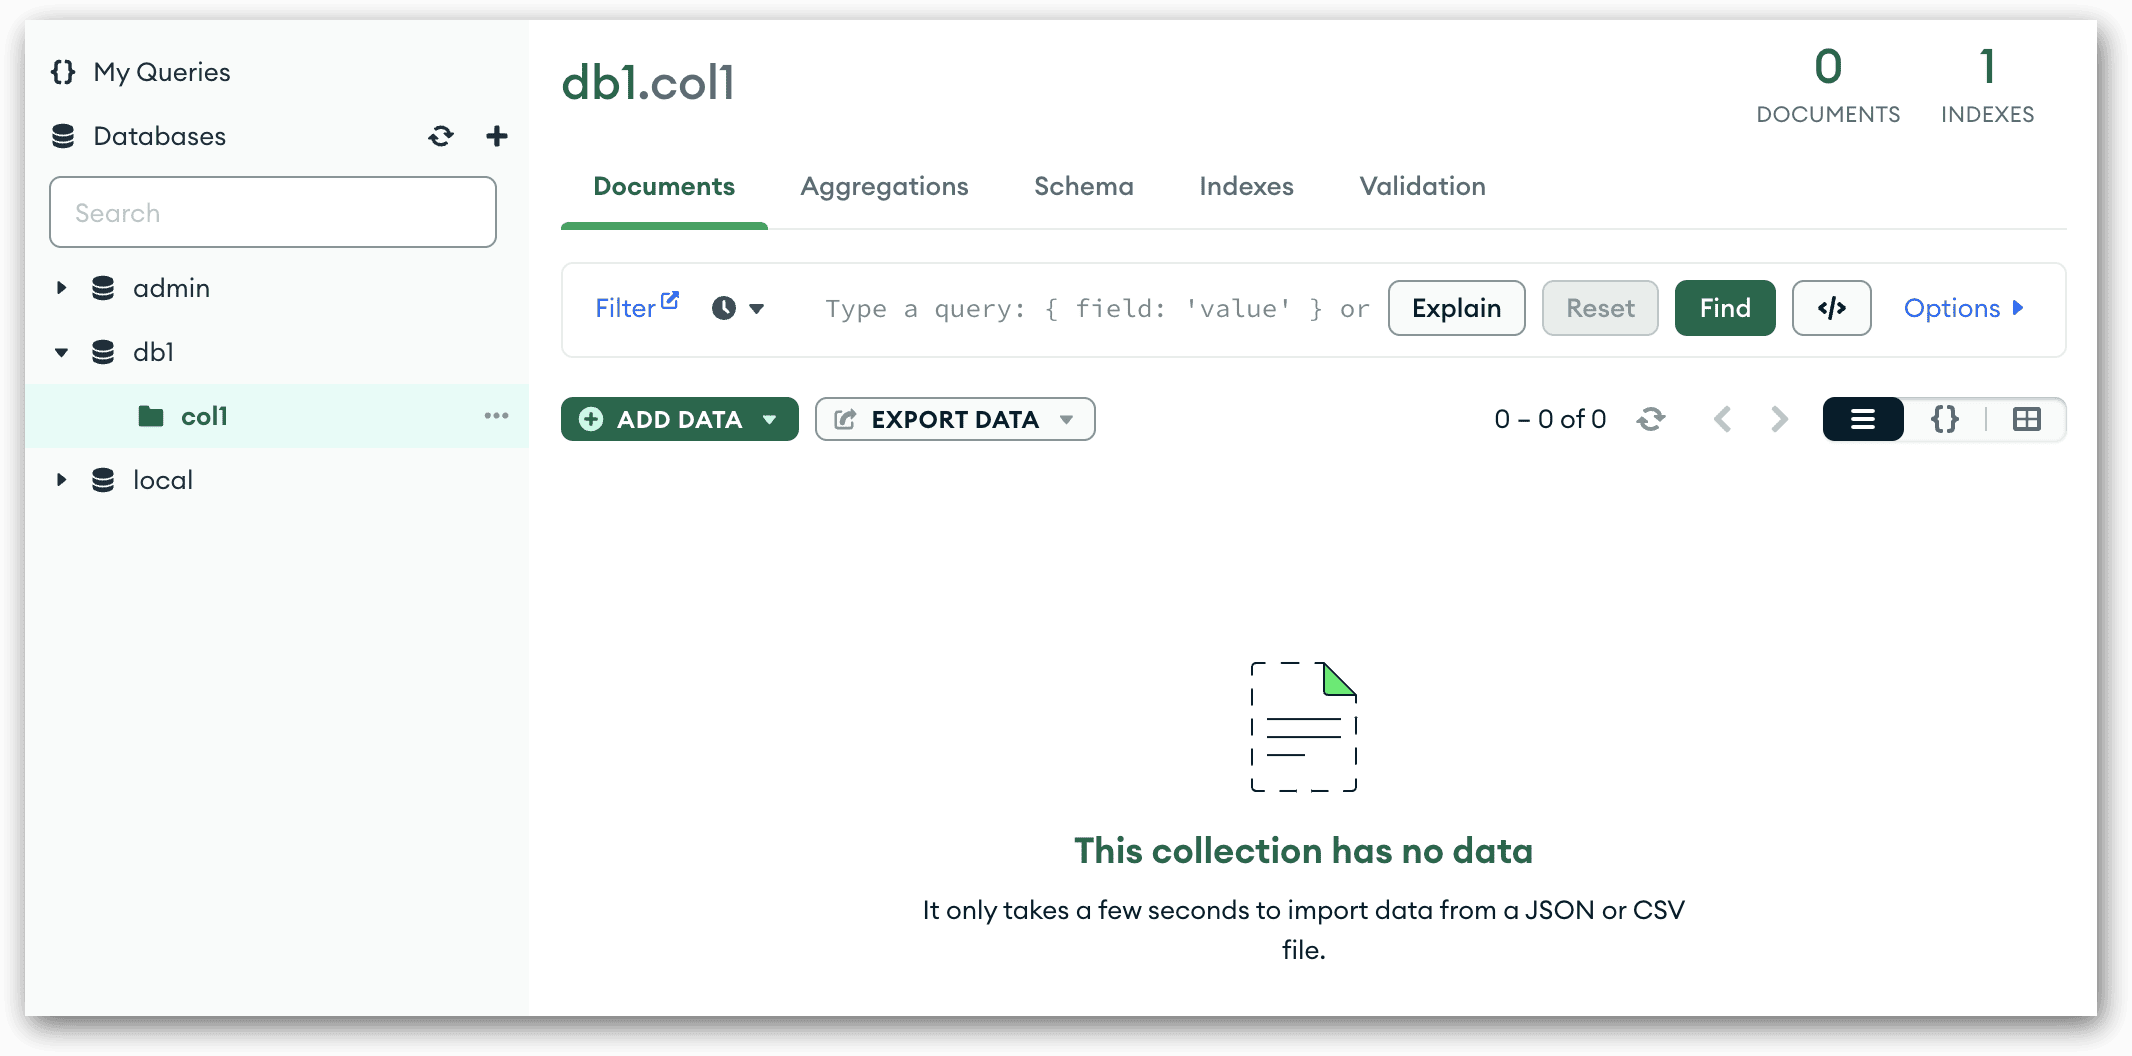
Not surprisingly, the main Compass window indicates that the collection contains no data, but now that you have the database and collection in place, you can start adding documents, which is our next step.

Adding documents to a MongoDB collection

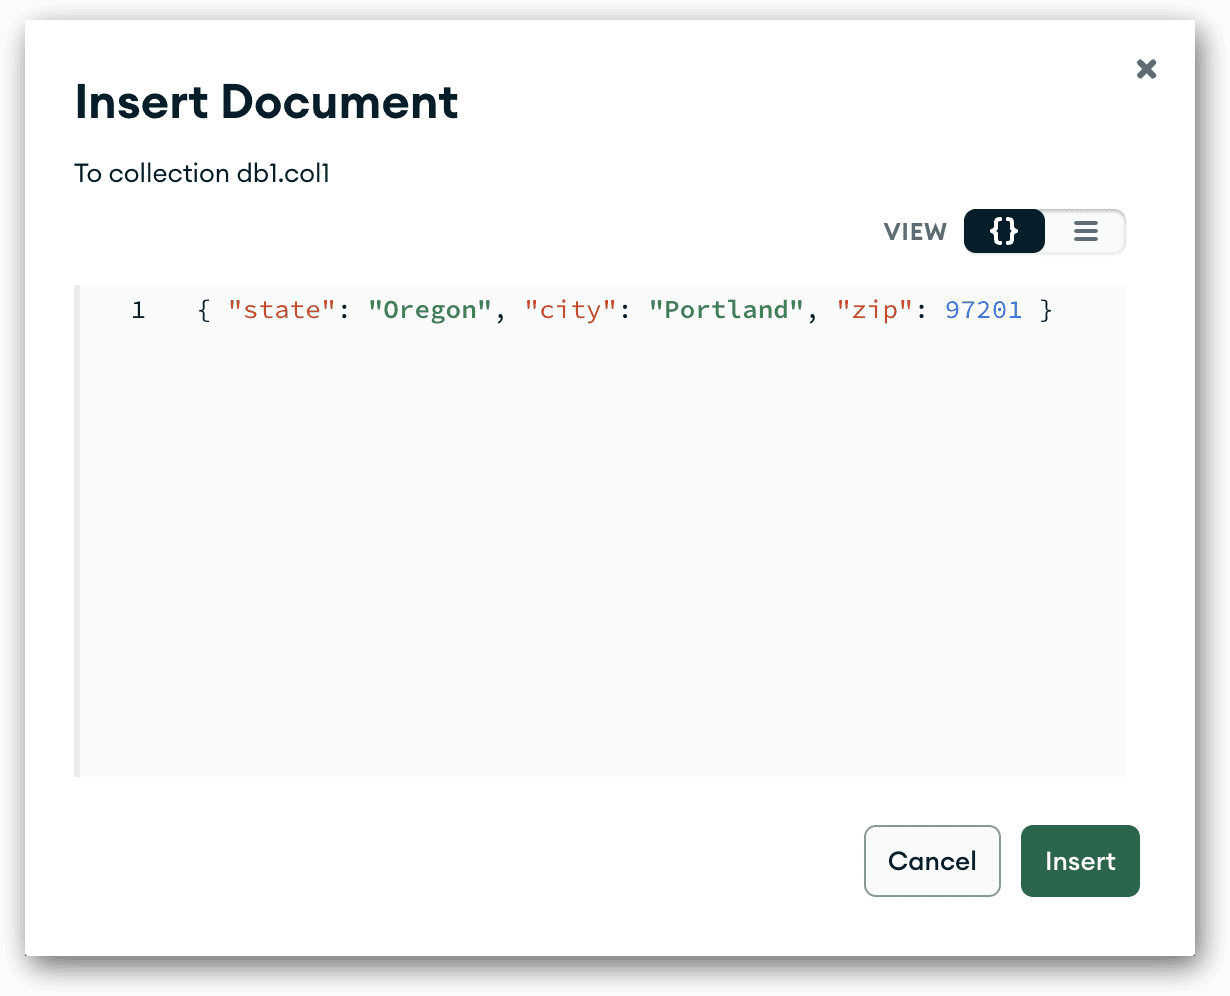
In MongoDB, a document is a data structure that contains one of more sets of field/value pairs. The pairs are separated by commas and enclosed in a set of curly brackets. For example, the following code represents a simple document that contains three field/value pairs:

{ "state": "Oregon", "city": "Portland", "zip": 97201 }

The first field/value pair is "state": "Oregon". The field’s name is state, and its value is Oregon. The other two field/value pairs work much the same way. The only difference is that the final value is not enclosed in quotation marks because it is being defined as an integer, not a string. MongoDB infers the data types based on the values you provide. For example, you might want to save the zip field as a string value, rather than integer, in which case, you would enclose it in quotes. In addition, MongoDB provides methods for overriding the default behavior so you can define a field with a specific data type.

Although this is a fairly basic document, it gives you an idea of how documents are structured. Later in the series, I’ll go into the document structure in much more detail. Until then, I suggest that you look around for examples of different types of MongoDB documents. You’ll find that even the more complex documents follow the same underlying structure of field/value pairs.

Now let’s add this document to the col1 collection. In MongoDB Compass, make sure that the collection is selected in the left panel. Then, in the main window, click the Add Data drop-down arrow and click Insert document. In the Insert Document dialog box, delete the existing text and type or paste the above code. The dialog box should now look like the following figure.
After you’ve typed in the document, click Insert. MongoDB will add the document to the col1 collection and return you to the main Compass window, with the col1 collection node still selected. The document should now be listed in the main window, as shown in the following figure.
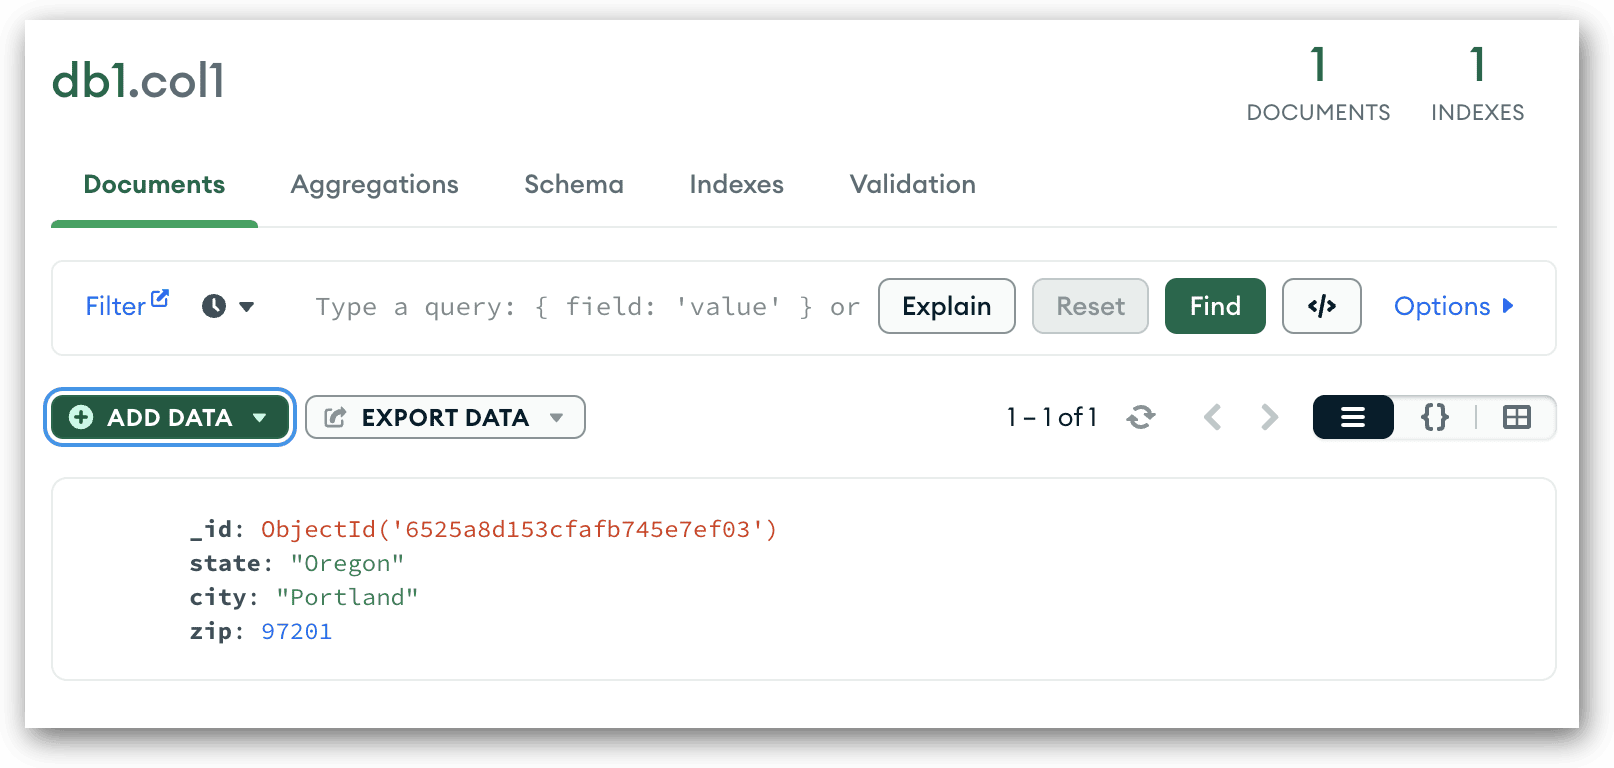
Notice that the document contains the _id field. All MongoDB documents must include this field. It acts like a primary key that uniquely identifies the document within the collection. If you don’t supply the _id field, MongoDB adds it automatically and assigns a unique identifier as its value, which is configured with the ObjectId data type.

In some cases, you might want to provide your own _id field, such as when importing the data from another data store. For example, the following document is the same as the previous one, except that it now includes the _id field:

{ "_id": 10001, "state": "Oregon", "city": "Portland", "zip": 97201 }

If you were to add this document to a collection, MongoDB would preserve the _id field that you defined and would not generate a unique identifier. However, if the collection already contains a document with the same _id value, MongoDB will return an error instead of adding the document. A document’s _id value must always be unique within a collection. Even if MongoDB is generating the _id values, it would never add a duplicate value.

In Compass, you can add multiple documents to a collection at one time, taking the same approach as with a single document. However, you must enclose the documents in square brackets (creating what is in effect an array) and separate the documents with commas. For example, the following code defines three documents:

[
  { "state": "California", "city": "San Francisco", "zip": 94102 },
  { "state": "Colorado", "city": "Denver", "zip": 80204, "nickname": "Mile High City" },
  { "state": "Washington", "city": "Seattle", "zip": 98101, "population": "733,919 (2021)" }
]

To add these documents, follow the same steps as before. Click the Add Data drop-down arrow and click Insert document. In the Insert Document dialog box, delete the existing content, type or paste the above code, and click Insert. MongoDB adds your documents to the collection.

You might have noticed that each document has a slightly different structure. For example, the second document includes a nickname field, and the third document includes a population field. MongoDB lets you create documents with different structures to meet you specific business needs.

Viewing documents in a MongoDB collection

After you add documents to a collection, you can view them in the main Compass window, as you saw in the previous section. For example, the following figure shows the main window with the additional three documents.
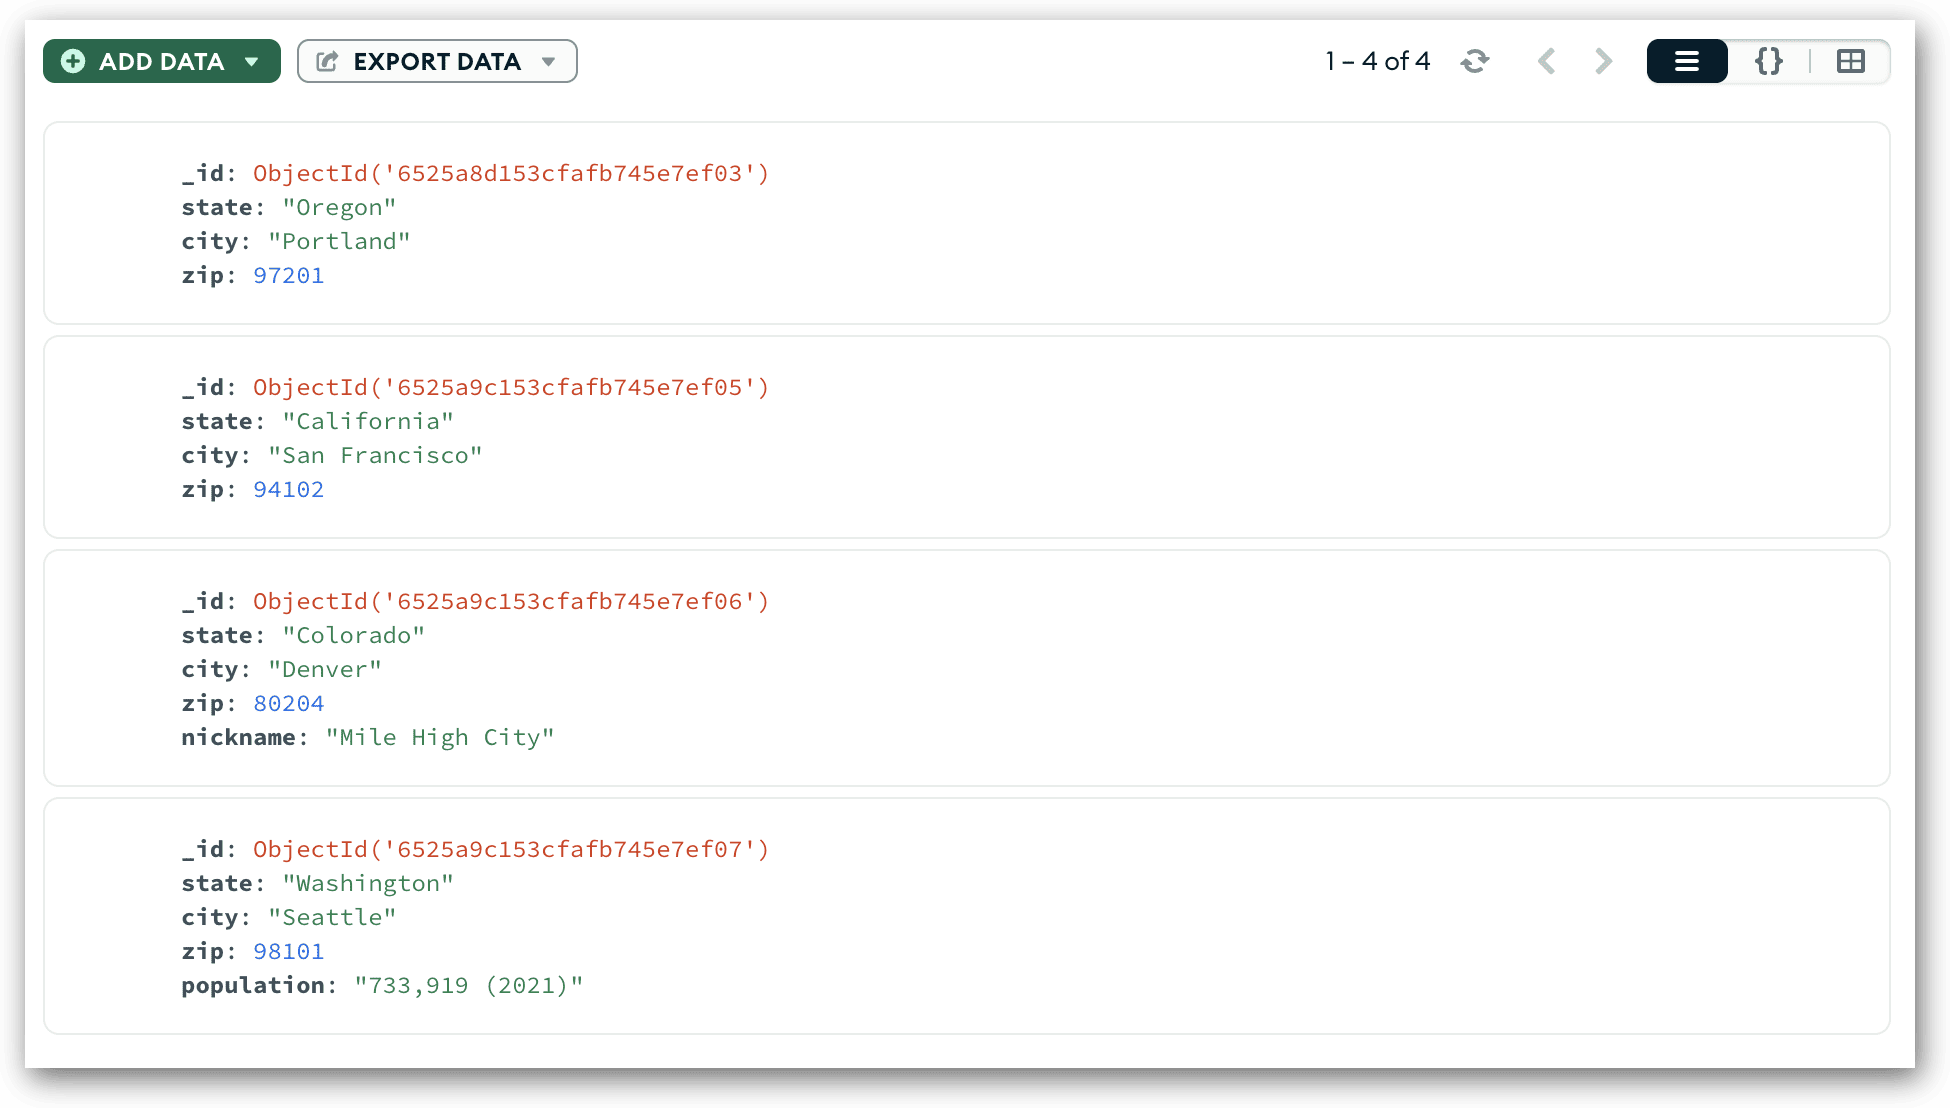
This view of the data—referred to as List View—is only one of three views that Compass offers. List View is the default view and provides a simple format for scrolling through the documents and viewing their content. In addition, you can expand embedded documents and arrays, when they exist.

You can also display the documents in JSON View or Table View. To select a different view, click the appropriate button near the upper-right corner of the data display area. The middle button switches to JSON View, which displays the documents as properly formatted JSON objects, as shown in the following figure.
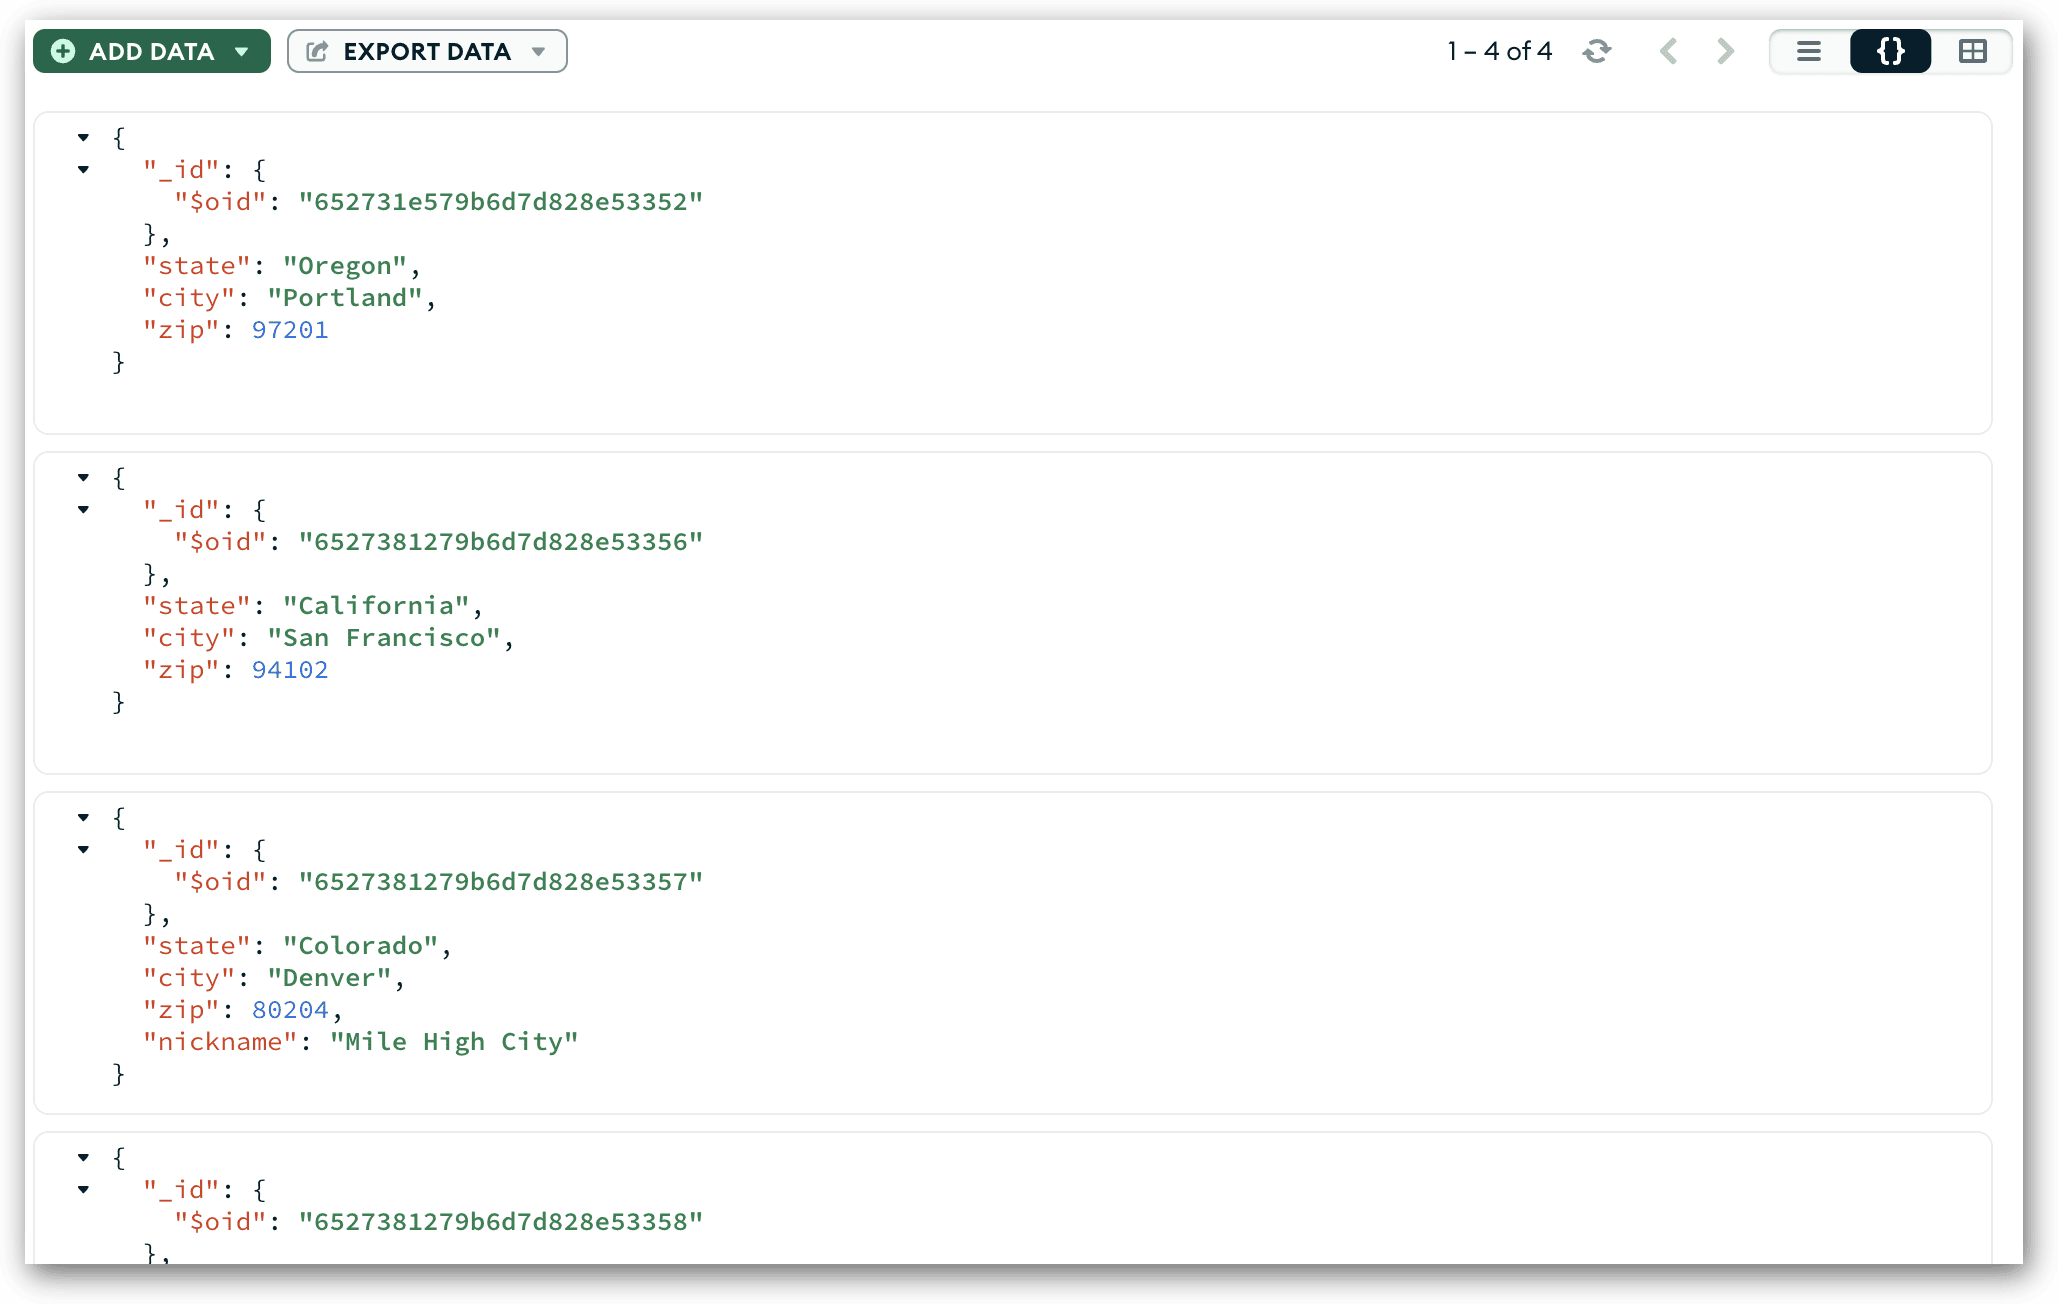
In JSON View, the value for the auto-generated _id field is treated an embedded document with a single $oid field. The $oid field is used in place of ObjectId when rendering the data as JSON.

The third view that Compass supports is Table View, which displays the data in a tabular format similar to a spreadsheet or table in a relational database. You can get to this view by clicking the right button in the upper-right corner of the data area. The following figure shows the four documents in Table View. If a document does not contain a field that exists in another document, Compass displays No field as the field value.
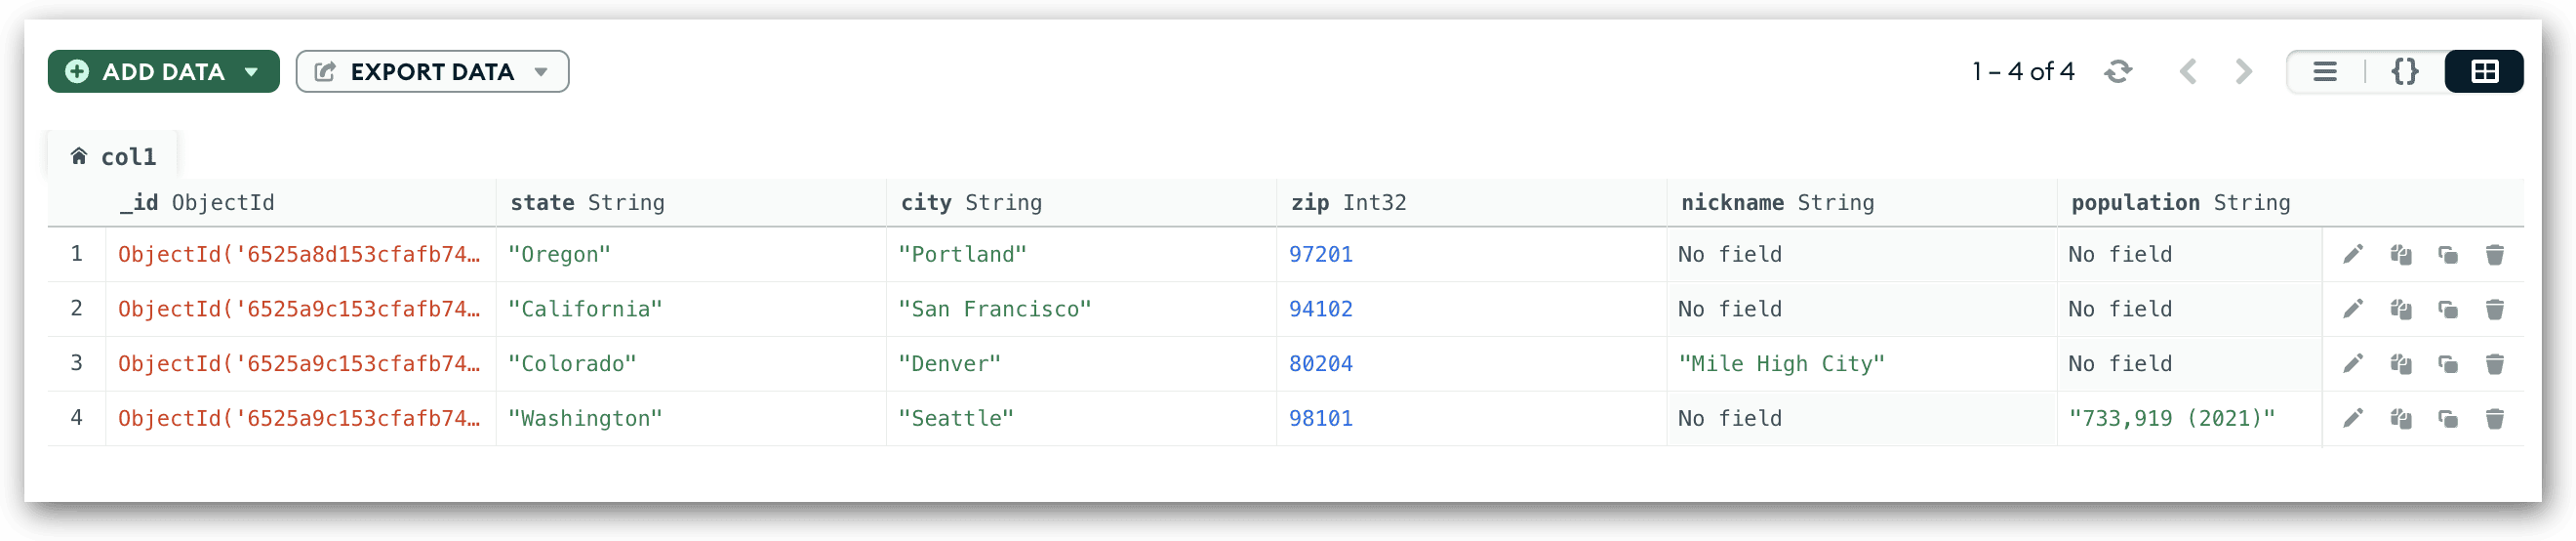
There is much more you can do in each view than what we’ve covered here. For example, you can edit, copy, clone, or remove a document. As we progress through this series, I’ll be covering a wide range of topics about the various ways you can work with MongoDB documents, using both the Compass GUI and the embedded MongoDB Shell.

In the meantime, feel free to delete the collection and database at any time, unless you want to play with them for a while. When you’re ready to delete them, click the options button (ellipsis) to the right of the col1 collection node in the left panel and then click Drop collection. In the Drop Collections dialog box, type the collection name in the text box and then click Drop Collection. When you drop a collection that is the only one in the database, MongoDB also drops the database.

Getting started with MongoDB

In this article, I introduced you to the MongoDB platform and provided an overview of how to connect to MongoDB Atlas from the Compass interface. You also learned how to create a database and collection and add a few documents to that collection. I’m hoping that what I’ve provided here will help you get started with MongoDB so you have a basic foundation on which to build as we progress through this series.

In the articles to follow, I will expand on many of the concepts I introduced here and dig into a number of other ones. As part of this process, we’ll be going a lot deeper into the document structures and the various ways you can query those documents. Queries are, in fact, where you’ll likely be spending most of you time with MongoDB, so the better you understand the basics, the better prepared you’ll be for moving on to more advanced topics.

The post Getting Started with MongoDB appeared first on Simple Talk.


from Simple Talk https://ift.tt/8b9Sl7F
via

Saturday, November 11, 2023

An editor’s biggest headache: Plagiarism

As an editor working with other people’s technical writing for many years, you might guess that either language skills or technical abilities would be the largest issue that you deal with. Both of these provide plenty of challenges, but the biggest issue is plagiarism in one shape or another. (Spelling the word plagiarism is kind of fun, too.)

Pretty much anyone that spent time in grade school knows a little bit about the concept of plagiarism because we were clearly instructed to never just copy someone else’s work, either schoolmate, or website, directly. (For those of you of a certain age, replace website with the Encyclopaedia Britannica or perhaps Compton’s and it may ring a few more bells.) Plagiarism, however, is more than just copying something word for word and putting it in a term paper. In this article, I want to discuss the depth and breadth of what it really means; and how I try to avoid it in my writing, and when reviewing other people’s work.

I want to state that none of this was taken directly from any specific case, but from works I have come across for years and years. I will also note that most egregious cases are extremely rare, but that is what makes this the biggest headache. It is the rare cases that are so hard to find and every article we work on/publish, it is essential to reduce the chances that the work is based on any sort of plagiarism.

Plagiarism: What is it?

The definition of plagiarism, from dictionary.com is:

an act or instance of using or closely imitating the language and thoughts of another author without authorization and the representation of that author’s work as one’s own, as by not crediting the original author

What a lot of people don’t realize is that copying other people’s unique thoughts and phrasing is plagiarism . This is where things get complicated, in fact, really complicated. Because there is a fine line between something that is general knowledge, common idiom, or even public domain; and something that you heard one person say and then repeated it like you said it. It is wrong even if what was said was not exactly special in and of itself.

I asked my wife, who has a doctorate in education, what academics say about plagiarism. She told me there was two trains of thought by academics. Those who say anything you use must be either your own or specifically attributed to the originator. Others say if you have permission to use something, that is enough.

In the trade press, which most blogs and articles fall into, we typically are closer to the latter. It is rare that you need to attribute every concept you share, because most trade writing is taking well known topics and putting it out with a new spin to help others understand. However, it is still good practice to attribute your sources when you are writing an article and get ideas from other sources. This goes for code samples, definitions, and even graphics that you reproduce.

Types of Plagiarism

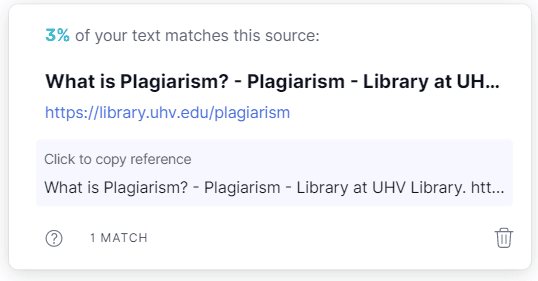
As I was researching this topic and doing a plagiarism check on my document, I found this website https://library.uhv.edu/plagiarisms had some definitions that were interesting. In fact, I discovered this website because my plagiarism check found that I overlapped text with this site as we both had used the same definition of plagiarism from dictionary.com. Perhaps ironically, these very same plagiarism concepts are repeated on many different websites as well, sometimes with slightly different names and organizations; and rarely with attribution of where they go it from.

Deliberate versus accidental plagiarism. Deliberate is obvious, but sometimes your text or formulas will be very close to others by accident. For example, if you are including a formula reference like E = mC ^ 2 (Einstein’s mass-energy equivalence formula that is well known), you are likely to exactly match the text of others.

Sometimes you just use the same words to express the same thing randomly. “It was a dark and stormy night” for example. This is more concerning when it involves specific facts and formulas, or when it happens suspiciously often in a document. It is rarer than you would expect when you write a document to overlap with a lot of other writes accidentally.

Note: I won’t be discussing AI in this blog, but I am becoming more and more convinced that AI plays a part in a kind of hybrid deliberate/accidental plagiarism that is going to continue to by more and more trouble for editors.

Beyond how plagiarism happens, you can break down plagiarism into different types:

Global plagiarism – Just flat slapping your name on someone else’s fully complete work. This is actually quite common in the trade publication area where the monetary value of people’s work is pretty low. In fact, don’t be surprised if you write blogs or books, just how often your work shows up elsewhere.

Verbatim plagiarism – Very similar to the global version , but typically stealing some text and just using it in your own work. For example, if you are describing the CREATE PROCEDURE statement from SQL Server, you could just go to their documentation and copy some of the text and just treat it as yours. This is still considered intolerable in trade writing without attribution. With attribution, it can be effective for a paragraph or a table of information that you don’t want to repeat (it is also a good practice because it lets readers know of more resources).

Paraphrased plagiarism – Taking someone else’s text and just rewording it. It is best that if you are doing this, you state where you got the source from, and ideally you are clarifying or adding to it. Just keep in mind it is always good practice to direct people to other sources that you have used when writing about a topic (even if that source is written better than your work, it elevates your work and gives the reader more information).

Self plagiarism-It is commonly understood that you can’t really plagiarize yourself as long as you own the rights. However, if you are supposed to be providing new material, and you use old material, this is not a good situation either. If you are referencing old material, that should be clear.

For more reading, the uhv.edu website sites referenced https://www.scribbr.com/plagiarism/types-of-plagiarism which had some additional excellent examples.

But really, what is Plagiarism in content that sites like Simple-Talk puts out?

I think we can all agree that if you take the ideas, thoughts, or words of an individual source directly with no other sources, that is a big issue. Copying a few sentences from online documentation, or from other blogs is typically okay, as long as you attribute.

The real difficulty lies in what is someone else’s work and what is general knowledge or simple, straightforward facts. For example, you are writing a blog about something very fast and want to include the speed of light. This value is 299,792,458 meters/second but I clearly don’t know this by heart. I looked this up on Google and this came up right in the interface from the following link: https://www.google.com/search?q=speed+of+light.

Graphical user interface, text, application Description automatically generated

Do I need to state that this is where I got this value from when that value is most definitely not one that google originated? Maybe, but not necessarily. Looking around, you can see that value repeated on many websites and I expect if I cracked one of my old physics textbooks, it would say the same thing (or perhaps it would quote it in miles/second, since I am an American and we don’t always go in for that metric stuff.)

The thing is, in trade-level writing, we are all generally aware that nothing we are saying is genuinely our thoughts. I did not come up with relational databases, I didn’t come up with B-tree indexes and their structures, I wasn’t the first to say that an index will make a query faster, and that too many indexes may have an overall negative effect. I didn’t come up with 99.99% of the algorithms I have used in my life and even more so, there are only a few of those algorithms that I even somewhat know where they came from originally!

My only truly unique thought was coming up with a way to implement relative positioning using a calendar table. If I ever see someone else doing the same thing, I would hope they said thank you to me. They may have come up with the same idea independently. Either way, I sort of think of things in terms that Elvis Costello once said about other musicians. Everyone copies each other somewhat. There are only so many ways to solve a problem, like there are only so many ways to put chords together to form music. But there are clearly lines that we don’t cross.

The general rules that I look to make sure people I edit follow are as follows.

  • Consider where you learned something. Make sure you know that what you are sharing is in your own words, representing your ideas, or generally known concepts. In this case you probably don’t need to attribute where it came from, but if you can it does not hurt. If you learned something in a class or read it in a book, make sure you are not sharing one person’s specific ideas in a way that makes it sound like your own.
  • If you find something interesting that a person says and you want to use it in your writing, give them credit and you are safe and done. This includes concepts, formulas, everything. If you don’t see it as a generally understood concept, give the first place you read the concept attribution. If you get permission to use the concept, that is okay, but put it in your own words. Said this before, but it is important… attributed does not make you look smart, but it makes you look terrible if you steal words and ideas.
  • If you copy someone’s text directly…attribute it. Always. Always. Even if it is acceptable to copy, and even if you have permission. Give credit unless you specifically are told not to under some penalty. And consider noting that you were asked not to attribute if so.
  • If in doubt, give credit. If in doubt and you don’t know who to attribute, consider not using that piece of information.

Discovering Plagiarism

As time passes, it is more and more difficult to plagiarize and get away with it. In this section, I want to cover some of the methods I use to find plagiarism in writing I have worked with.

Tone and quality

This is basically the method that teachers for centuries have used. Watching for change of tone. Let’s be honest here…most students have copied information from a source from time to time. And probably the first time you got a mild rebuke from the teacher warning you of how wrong that was. As an example, can you spot the issue in this next paragraph where a student is defining a database?

You know, it is like when you want to store information and stuff, you use an organized collection of data stored and accessed electronically. Small databases can be stored on a file system, while large databases are hosted on computer clusters or cloud storage. The design of databases spans formal techniques and practical considerations. It is like, so important to like keep it right, you know.

If it wasn’t already glaringly obvious, I took the words between “you use” and the last sentence directly from https://en.wikipedia.org/wiki/Database.

These changes in tone and quality have always been a flashing red flag that something is wrong. Luckily, using a search engine you can often enter a portion of the text and find where it came from, even if it turns out to be somewhat paraphrased.

Tools

Thanks to the miracle of modern technology, we have tools that we can now paste a document in and check for copied work. For example, I took the text that preceded this section into Grammarly’s checker, and it found 13% of it was plagiarized (because of the text that is attributed. Grammarly doesn’t know you attributed it!) It isn’t perfect, because it can’t check all the books and publications that are not freely available on the internet, but it does a decent job of catching common cases.

Some things are interesting. For example, the definition of plagiarism that I got from dictionary.com was found on a different location than dictionary.com (image pulled from Grammarly’s plagiarism check):

Graphical user interface, application, Teams Description automatically generated

That site also references dictionary.com, (it is https://library.uhv.edu/plagiarism and it has some more details that I did not cover on plagiarism that is interesting) so we are basically on the same link.

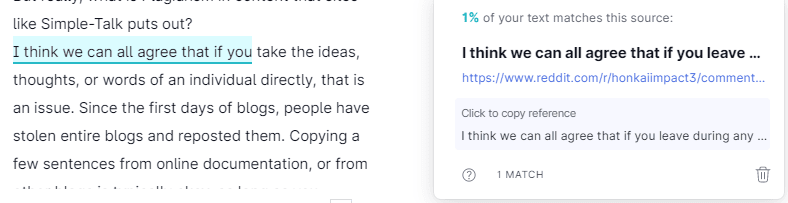
Some things the tool finds is not always deliberate plagiarism. For example, it found the following duplication:

Graphical user interface, text, application, chat or text message Description automatically generated

There are frequently phrases that you will find in writing that are the same that just can’t be helped. If the phrase is really specific, it might be classifiable as accidental plagiarism and would be something to rephrase.

However, if you find too many of these phrases from the same source, it is absolutely time to look deeper and see if any additional tools were used to cobble together your documents.

Mistakes

Finally, this is kind of the worst-case scenario. You are writing a article again about the speed of light. You go to a source and find that the speed of light is 199,792,458 m/s, and you use that value happily continuing your writing. Now your fact checker checks that value and when they do a search on that value, it turns out that the exact incorrect statement is used by another website. This not only shows you used their information directly without checking around, but that you didn’t know it was wrong.

In Conclusion, Just Make Sure Your Work Is Yours

That says it all. So, I will stop right there.


The post An editor’s biggest headache: Plagiarism appeared first on Simple Talk.


from Simple Talk https://ift.tt/rXihIwB
via

Thursday, November 9, 2023

Past PASS Data Community Summit Photographic Memories

I wanted to write a post about going to the Pass Data Community Summit this year, and everything I started to write sounded cheesy. So I started thinking (finally), how could I share my love for the event? 

One of my hobbies is photography. My goal in taking pictures is to remind me of a time and place, ideally in its perfect state. For example, my primary subject is theme parks. I want to present a memory that is a little better than reality. A lot of this is keeping the number of people in a picture just right. Either no people, or lots of people, depending on the situation. Like if I am photographing a show. I either want to make it look like there is a large crowd, or I want it to look like I am basically there alone. Then I let my imagination fill in the rest in the best way possible. (Hopefully forgetting the person behind me singing different music, and the person in front of me holding a phone above their head with video lighting on.)

I will be honest and say that in previous years, I didn’t take pictures of the Summit to put out there to showcase my photography skills. So most of these picture are not super high quality (I definitely intend that my post-2023 PASS Data Community Summit picture will be). But, every picture gives me feels in a way that I think, assuming you too have been at these events, they will for you too.

A Few Pictures To Get Your Brain Started

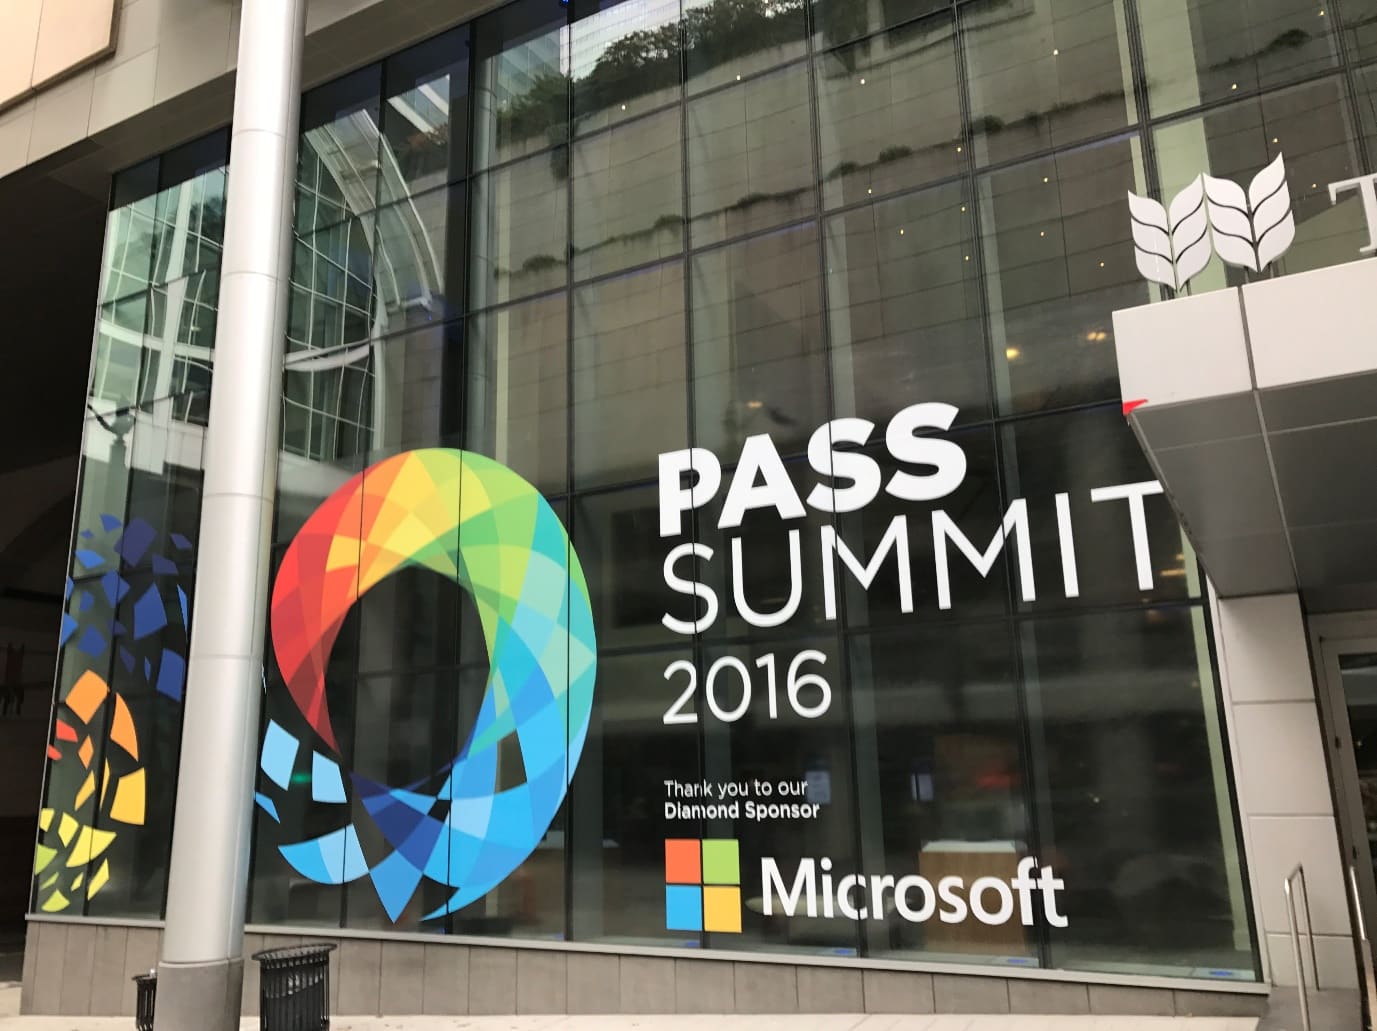
For PASS, I like to get a picture of the entrance to the show. Like this was from the last one I went to before they changed the name of the convention center:

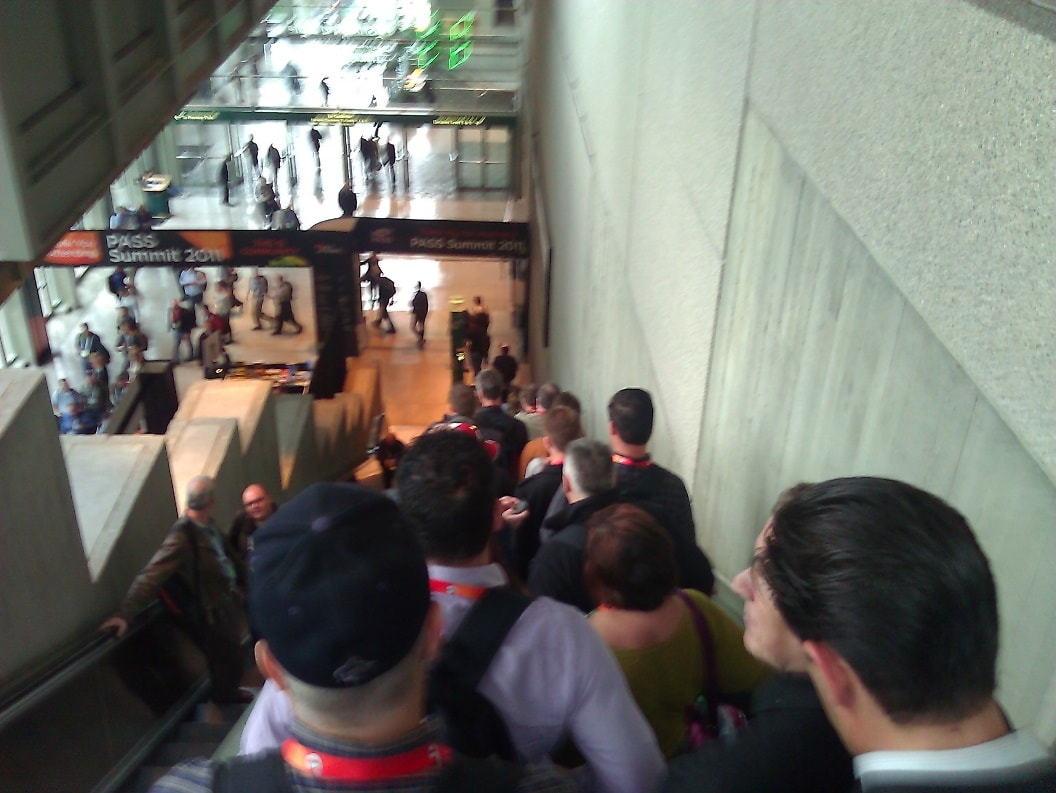
Escalator pictures are good ones to bring back memories too. When you are there early and you are riding up to the 4th floor to fetch your badge to get things started (Note: I am not saying registration is on the 4th floor this year!)

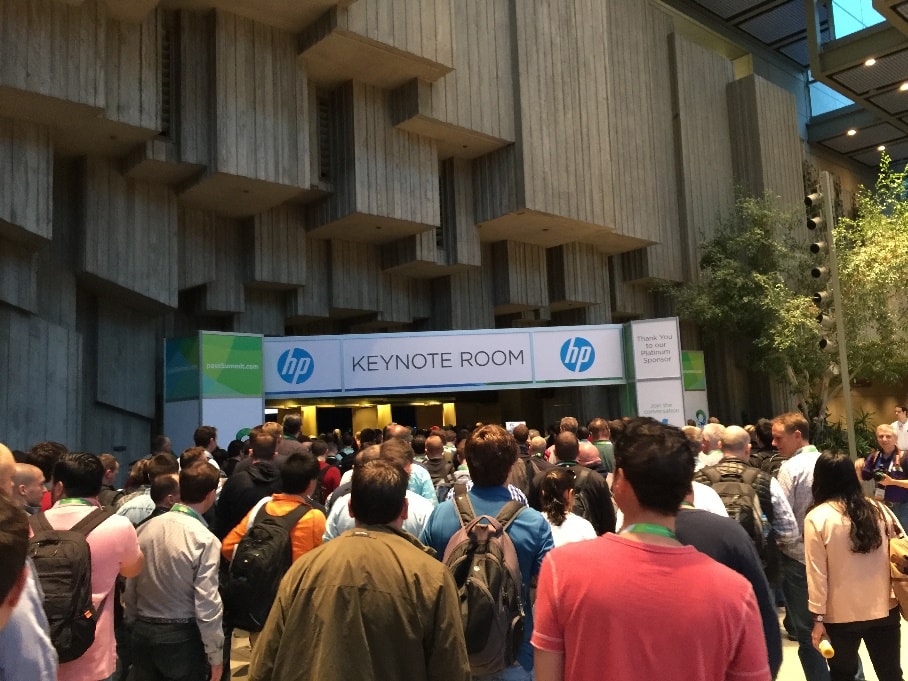
The other type of picture I like is an action picture that will often have a LOT of people in it. For theme parks, this usually occurs when there are fireworks, or a parade. If there aren’t people packed in to watch the spectacle, it feels wrong. Throngs of people are needed. This is true for things like keynotes, or one of the attendee parties (this is a fairly fuzzy picture, but it is quite a memory of Grant as Darth Vader.):

If just a few people were in that picture, it would feel weird.

Same with moving around the conference. Going back to the escalators, heading down them after session is a big memory (and one I don’t have enough pictures of), This was from 12 years ago, probably heading to lunch since there are more of us heading to the 4th floor than up to the 6th.

Some memories are never to be recreated again. Like this one from the Quiz Bowl:

It was incredible how many smart people passed through that competition. I was always running the game, with Tim Ford the emcee, so I don’t have a lot of pictures, but just this one brings them all back (especially the year that Gail Shaw was one of the contestants!).

And because of working on Quiz Bowl, I often got to see some of the rooms as they were being set up or practiced in:

The one thing I don’t do nearly enough of is sightseeing. I have a few pictures from the Seattle area (of course Pike’s Market!):

But there are plenty things to look at right around the conference center:


With that, I think it is time to head over to the keynote:

And a few more

I searched through all of my pictures over the year and picked out some favorites for the post. So I am not wasting them! 


If you read this far, and you won’t be there this year (but have been to several of the one’s in the pictures), I apologize for any sad feelings you may be having.

The post Past PASS Data Community Summit Photographic Memories appeared first on Simple Talk.


from Simple Talk https://ift.tt/cDPlLy7
via

The NTILE Function

The SQL NTILE() is a window function that allows you to break a table into a specified number of approximately equal groups, or <bucket count>. For each row in a grouping, the NTILE() function assigns a bucket number representing the group to which the row belong starting at one.

The syntax of the NTILE() function is:

NTILE(<bucket count>)
OVER (PARTITION BY <expression list>
        ORDER BY <sort parameter list>)

The <bucket count> is a literal positive integer or an expression that evaluates to a positive integer. Most of the time is an integer constant but using the option of an expression can be a handy trick.

PARTITION BY

The PARTITION BY clause divides the result set returned from the FROM clause into partitions to which the NTILE() function is applied. This is the way this subclause is used inside the OVER () clause in other windowed functions.

ORDER BY

The ORDER BY clause specifies the order of rows in each partition to which the NTILE() is applied. Each parameter in the list can have an optional sort order attached to it with the optional [ASC | DESC] postfix. This is the way this subclause is used inside the OVER () In other windowed functions. This ordering is how The rows of the table are scanned to pick up groups.

If the number of rows in the results at is divisible by <bucket count>, the rows are divided evenly among groups. But if the number of rows is not divisible by <bucket count>, the NTILE() function results in groups of two sizes. The larger group always come before the smaller groups in the order specified by the ORDER BY clause.

Easier to See With an Example

Let’s create some sample data And see how this works. For example, we’re going to do a pretty small table, but it’s worth mentioning that when you’re doing an NTILE problem in the real world, you generally want a large population. Small sample sizes lead to badly sized groups.

The following statement creates a new table named population that stores 10 integers from one to ten:

BEGIN
  CREATE TABLE Population
    (pop_id INTEGER NOT NULL PRIMARY KEY);
        
  INSERT INTO Population(pop_id)
  VALUES(1),(2),(3),(4),(5),(6),(7),(8),(9),(10);
END;

As a simple example, let’s use two for the bucket count:

SELECT pop_id,
        (NTILE (2) OVER (ORDER BY pop_id)) AS grouped_pop
FROM Population;

This returns two groups of data as you can see in the grouped_pop column.

pop_id      grouped_pop
----------- --------------------
1           1
2           1
3           1
4           1
5           1
6           2
7           2
8           2
9           2
10          2

What NTILE is NOT

The first thing we need to get out of the way, is to discuss what this function is not. Too often programmers who use it for the first-time attribute properties to which it doesn’t have.

Not a Histogram

The NTILE() function attempts to make all the buckets exactly the same size, but that’s not always possible with a given population. People often mistake this function for histogram, in which we might want buckets of different sizes. We know we have only a few billionaires in our population, and we know we have a big middle class and a relatively small number of truly poor people.

Another problem is that the attribute upon which you’re basing these buckets might not be very distinct. At the extreme, imagine that every employee has exactly the same salary amount. None of the NTILE() groups based on salary can be expected to be better than any other group.

Not a Median

SQL does not have a built-in median aggregate function. Decades ago there were articles in trade magazines, Database Programming And Design and DBMS on how to write them in standard SQL (and back in 2009, I wrote this article on the subject here on Simple-Talk). We had various clever solutions, and it was a fun problem that bounced back and forth between the two magazines.

It’s very tempting to use the NTILE() function to compute the median by finding the highest value in the first partition, the lowest value in the second partition, adding them and dividing by two. With the first 10 row example, we get (5 +6) / 2.0 = 5.5 for the median. Using this method. I’ll leave it to the reader to write this algorithm in one SQL statement.

Unfortunately, this does just does not work. There is no guarantee the first and second partitions will be the same size as extra values will be thrown into the first partition. If population wasn’t evenly divisible by two. It gets even worse. if you try dividing the population into three groups, the tops and bottoms are not the same size. The first group has four rows while the other groups have three rows. Ten does not divide evenly by three without a remainder, so NTILE(3) would return the following in our previous query.

pop_id      grouped_pop
----------- --------------------
1           1
2           1
3           1
4           1
5           2
6           2
7           2
8           3
9           3
10          3

Not Exactly a Partition

A set is partitioned when all of the subsets in the partitioning union back into the original set, and the intersection of all of those subsets is empty. The first thing we need to do is to guarantee the value were putting into these groups is unique. That’s easy enough to do with a SELECT DISTINCT operation. Then add a group number to those unique rows. Finally, find the minimum and maximum value within each group. This will give you a partitioning of the original data but remember that you’ve taken the samples based on the bucket size. There are a lot of assumptions being made here.

SELECT salary_grp,
    MIN(salary_amt) AS range_start,
    MAX(salary_amt) AS range_finish
    FROM (SELECT X.salary_amt, NTILE(5)
      OVER (ORDER BY X.salary_amt) AS salary_grp
FROM (SELECT DISTINCT salary_amt 
      FROM Personnel)) AS X(salary_amt)
GROUP BY X. grp_nbr;

PARTITION BY Clause

The Windowing functions in SQL pick a particular column or expression to reset their calculations. In effect, they repeat the actions of the rest of the function of the subsets formed by the partition expression. This is one of those things that, again, Is easier to show than to say.

Let’s imagine you got a table of candidates for Mensa, the high IQ society. To get membership, you have to have an IQ in the top 2% of the population. There is a list of acceptable IQ test that you can submit. The most common IQ tests are:

  • Stanford-Binet Intelligence Scale.
  • Universal Nonverbal Intelligence.
  • Differential Ability Scales.
  • Peabody Individual Achievement Test.
  • Wechsler Individual Achievement Test.
  • Wechsler Adult Intelligence Scale.
  • Woodcock Johnson III Tests of Cognitive Disabilities.

Candidates just must score high on one test to get membership But to play safe, candidates will submit more than one test score. Let’s say that our table looks like this (it references a table named IQ_Tests that we will not create):

CREATE TABLE Mensa_Candidates (
  candidate_name CHAR(25) NOT NULL,
  test_name CHAR(25) NOT NULL
  -- not including related tables in this example
  -- REFERENCES IQ_Tests (test_name),
  PRIMARY KEY (candidate_name, test_name),
  test_score INTEGER NOT NULL CHECK (test_score >= 0)
);

Then I will create a bit of data to demo with:

INSERT INTO dbo.Mensa_Candidates 
   ( candidate_name, test_name,test_score)
VALUES
 ('Person 1','Test A', 100),('Person 9','Test A', 300),
 ('Person 1','Test B', 100),('Person 9','Test B', 130),
 ('Person 2','Test A', 130),('Person 10','Test A', 600),
 ('Person 2','Test B', 200),('Person 10','Test B', 200),
 ('Person 3','Test A', 300),('Person 11','Test A', 300),
 ('Person 3','Test B', 120),('Person 12','Test A', 440),
 ('Person 4','Test B', 133),('Person 13','Test B', 150),
 ('Person 5','Test A', 400),('Person 14','Test A', 320),
 ('Person 5','Test B', 100),('Person 14','Test B', 400),
 ('Person 6','Test A', 300),('Person 15','Test A', 300),
 ('Person 7','Test A', 130),('Person 15','Test B', 500),
 ('Person 8','Test B', 104),('Person 16','Test A', 600)

You could analyze candidates test scores by using NTILE() in the following manner:

SELECT candidate_name, test_name, test_score,
 NTILE(10) 
     OVER (PARTITION BY test_name
           ORDER BY test_score) AS test_ranking
 FROM Mensa_Candidates
WHERE test_ranking = 10;

You can see from the output that

candidate_name  test_name   test_score  test_ranking
--------------- ----------- ----------- --------------
Person 16       Test A      600         10
Person 2        Test B      800         10

This says were going to partition our data by the test names, in increasing order by test score, so we will get the best 10 percent of candidates for each test.

If a candidate was in more than one upper decile, then their name will appear more than once in the result set, once with each of the tests they took. We could then group the stable and find out how many people are qualified on more than one test. You can see this in the test data for Person 1 who falls in the lower 10 percent for each test:

Change the test_ranking criteria to 1, and you will see the bottom 10 percent.

candidate_name test_name   test_score   test_ranking
--------------- ----------- ----------- --------------
Person 1        Test A      100 1
Person 2        Test A      130 1
Person 5        Test B      100 1
Person 8        Test B      104 1

Conclusions

While the NTILE() function is not a complete statistical package in itself, you can quickly use it to explore your data without leaving SQL. The other window functions can also be quite useful. And it’s definitely worth taking a few days with some simple sample data to play with them and learn how to use them.

The post The NTILE Function appeared first on Simple Talk.


from Simple Talk https://ift.tt/Em35Ubs
via

Fabric Data Warehouse News you need to know

Microsoft Fabric, including the Data Warehouse, evolves faster than we can analyze and write about it. Here I’m summarizing the most recent news I looked at.

Clone Table

We have a specific statement to clone a table. But what exactly does it mean?

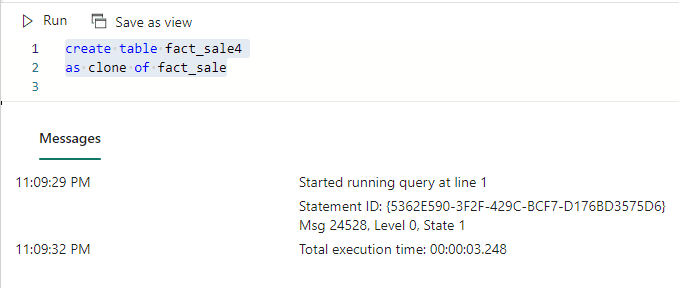
The Clone Table feature promises to create an image of the table on a specific point in time or with the current information. The documentation is not precise, because at some points it says it’s only a clone of the structure, but we can see the data on the table.

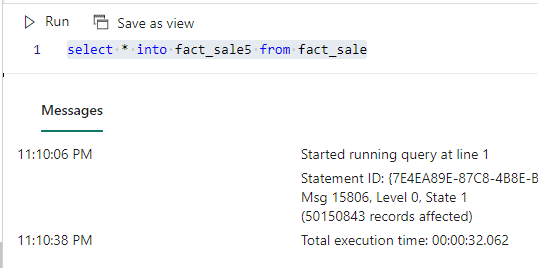
What’s the advantage of this over a simple SELECT INTO statement?

I tested both to discover. The images below illustrate how the clone table executes in only 3 seconds and the SELECT INTO takes 32 seconds for the same task.

A screenshot of a computer Description automatically generated

A screenshot of a computer Description automatically generated

However, this feature is in a very early stage. As a result, it shows some strange behaviours:

  • The cloned table doesn’t appear in the one lake explorer
  • A UI feature is promised and documented but not available yet
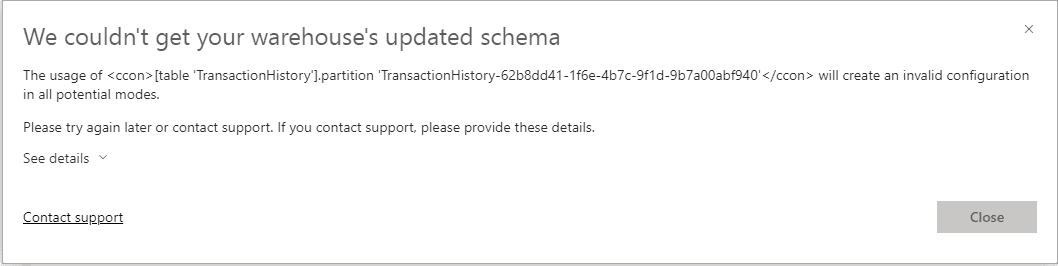
  • The cloned table doesn’t appear in the list of tables. A refresh results in an error. We can only access it from a query.

A screenshot of a computer program Description automatically generated

How does the clone happen in only 3 seconds?

Without the access to the files in the onelake, it’s difficult to say. My bet would be something related to the difference between copy files or copy records.

References:

https://learn.microsoft.com/en-us/fabric/data-warehouse/tutorial-clone-table-portal

https://learn.microsoft.com/en-us/sql/t-sql/statements/create-table-as-clone-of-transact-sql?view=fabric&preserve-view=true

sp_rename for tables

This is an inheritance from Azure Synapse, which never supported sp_rename. Problem solved. A small step for the technology, a big step for the data engineer.

Reference:

https://blog.fabric.microsoft.com/en-GB/blog/announcing-fabric-warehouse-support-for-sp_rename/

Data Warehouse Dynamic Data Mask

Another important addition is starting to appear on Synapse Data Warehouse, but it’s still missing some details.

Dynamic Data Mask is a very interesting feature to help protect sensitive data. However, in Synapse there are still some features missing:

Dynamic Data Mask with Alter Table is not working very well

We need to provide the Unmask permission to users and roles. I wrote an article when this feature was finally made available in SQL Server and Azure SQL. However, it’s not available in Synapse yet.

Reference:

https://learn.microsoft.com/en-us/fabric/data-warehouse/dynamic-data-masking

New CSV Parser for the Data Warehouse

I wrote before about the differences between the CSV Parser 1.0 and 2.0 in Synapse Analytics.

Checking the information from the old article, you may notice this is not a small advance, it’s a big deal.

Reference:

https://blog.fabric.microsoft.com/en-GB/blog/announcing-improvements-to-csv-data-ingestion-in-fabric-warehouse/

Save As View/Table available for Visual Queries

The queries feature, either SQL or Visual, are a great data exploration tool. It allows our users to explore the data before building any report, to discover exactly what’s hidden in the data before building reports.

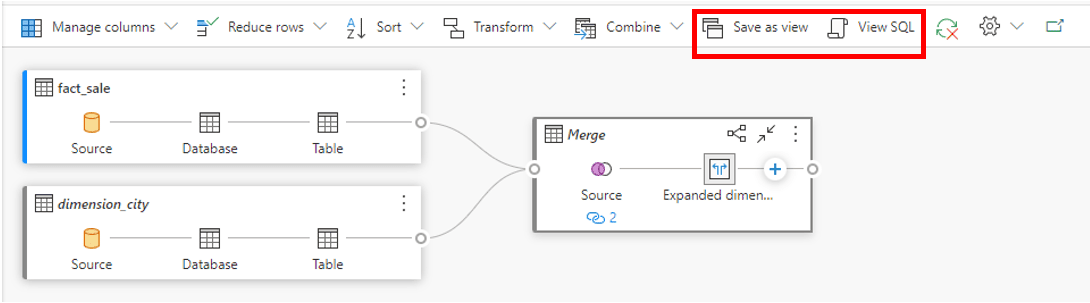
The possibility to create tables and views also on the Visual Queries, as we already had on SQL ones, completes the data exploration scenario.

A screenshot of a computer Description automatically generated

The bad news:

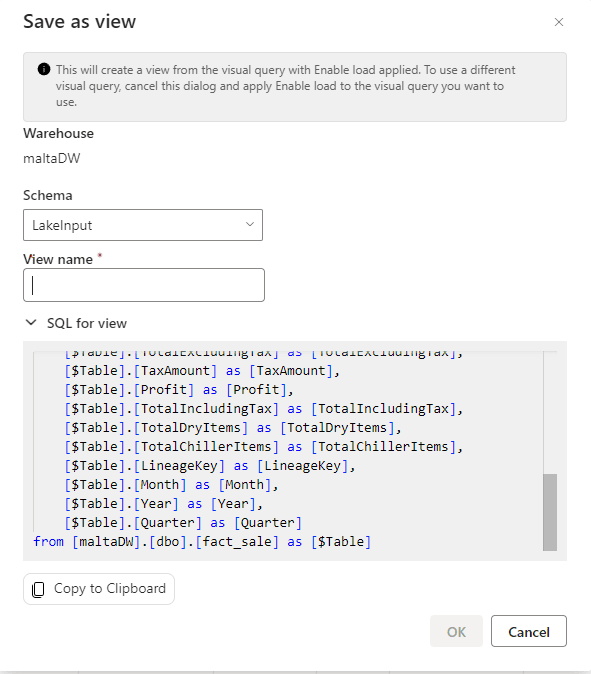
An old bug on Visual Query continues to be alive and kicking, making this feature not so useful. On the image above, there is a join between fact_sale table and dimension_city table. However, either the View SQL button or the Save as view button only show the SQL from fact_table, not the entire query with the join.

The image below shows the Save as view option, unfortunately without the JOIN it should have.

A screenshot of a computer Description automatically generated

Reference:

https://learn.microsoft.com/en-us/fabric/data-warehouse/visual-query-editor#save-as-view

Row Level Security

Row Level Security is one of the biggest differences between Data Warehouse and Lakehouse. Only a Data Warehouse has this feature, making the Data Warehouse a great candidate to be the gold layer in a medallion architecture, for example.

This feature has the same working method as in SQL Server: We create a function to filter the security by user and create a security policy to link the function to a table.

The example on the first reference below uses the USER_NAME() function. However, when an application connects to a database, we may be using an application identity, instead of a user identity. This could break the row level security.

The application has the capability to set a session context value with the name of the real user accessing the data. The security function would check the session context and ensure the row level security.

This architecture comes from SQL Server and it’s completely available in Microsoft Fabric Data Warehouse. It’s explained on the 2nd reference below.

Reference:

https://learn.microsoft.com/en-us/fabric/data-warehouse/row-level-security

https://learn.microsoft.com/en-us/azure/data-api-builder/azure-sql-session-context-rls

Summary

Microsoft Fabric has not been released yet. Documentations and announcements appear before all the feature details are available. However, this information shows us the direction things are evolving and what we should be looking for.


The post Fabric Data Warehouse News you need to know appeared first on Simple Talk.


from Simple Talk https://ift.tt/5J0YrTP
via