Monday, January 21, 2019

Implementing DevOps Doesn’t Get Rid of Database Administrators

I hear from a lot of database administrators who are worried about being automated out of a job. These kinds of worries are not new.

Over the course of my career, I’ve seen CTOs outsource large groups of IT jobs to different regions around the world to save money. IT has long been regarded as a cost center from which the organization needs to get “good enough” service for the lowest amount of money.

With this history, many database administrators are wary of any change that might trigger layoffs. Improvements in database-as-a-service offerings from cloud providers now automate and outsource traditional DBA tasks such as backups and high availability, so this concern is back with a vengeance.

It is natural that DBAs are therefore somewhat wary of DevOps. The following assumptions are easily made:

  • If DevOps means “developers doing operations,” no jobs remain for the IT staff who did operations before
  • Further, DevOps emphasizes automation so that IT jobs are no longer needed

These two points, however, are mistaken.

IT jobs are changing, but they are not going away

CTOs around the world are changing their focus, based on pressure from their CEOs and Boards of Directors. Companies who continue to follow the model of improving their products and services slowly, while minimizing IT costs, are now at risk of going out of business. We live in a time when a clever organization can quickly enter a market and offer products and services which solve problems in a new way, rapidly attracting new customers via the internet and stealing market share away from established companies.

The leaders of older companies, burdened by legacy applications and staff working long days to maintain existing processes, are becoming rightfully worried about their survival. This is occurring across all industries, from food service to banking to lawnmower manufacturers.

To rapidly discover which new products and features attract and retain customers in markets full of “disruptors,” existing companies don’t want to make developers take over all of operations work. Even with automation, developers already have a large amount of skills to maintain and tasks to perform without becoming network administrators, database administrators, and security specialists.

Instead, the goal is to make the people in each of these roles more productive, and to change the way we work so that each of these roles can leverage the expertise of the other roles more efficiently.

As Andrew Hatch writes in his excellent article, “Why We Don’t Need a DevOps team,” DevOps brings Operations into Development and it brings Development Into Operations.

This doesn’t mean that IT staff need to learn six programming languages overnight – or even one. But it does mean that collaborating with developers, focusing on customer input, exploring scripting languages, and seeking to reduce manual work is a big part of the future of IT.

How will roles change over the next ten years?

Let’s look at the role of the DBA in the Microsoft Data Platform space. Microsoft is working hard to make services available that dramatically reduce the amount of work it takes to implement high availability and prevent data loss. They are also working on automatic tuning features which make it easier to identify root causes for poor performance and implement solutions.

With cloud adoption increasing in the Data Platform area, but competition between cloud providers remaining strong, it is likely that efforts in these areas will continue, and further improvements will be made.

Let’s think back to our CTO, who needs to change his or her organization to innovate more rapidly, with the ability to get feedback from users and quickly test out changes to products and services inexpensively.

What does that CTO really want from a DBA?

They want a specialist who can:

  • Tailor source control strategies for database code to work best for the organization
  • Automate testing and release of database code with the right review and approval gates to produce stable, safe deployments
  • Efficiently identify risky database changes which require careful code review
  • Quickly provision databases which mask or remove sensitive data for new projects
  • Optimize practices to reduce bugs and outages caused by database code releases

Will this be the only role of DBAs?

This is not the role of a developer, but rather the role of a Senior DBA who integrates well with development teams and specializes in the architecture, management, deployment, and tuning of database code.

We will continue to have a variety of specializations for database administrators – this will not be the only route to a ‘Senior’ level IT job with databases. However, standardization of database code into version control and automation of release processes will only grow in importance, so it’s a smart bet for all DBAs to become familiar with developer concepts and practices as they grow in their careers.

NOTE: I’ll be talking about “How DevOps keeps DBAs safe from being automated out of a job” with Redgate’s James King and my fellow Microsoft MVPs Hamish Watson and William Durkin on Thursday, March 28th. I’d love for you to join us for this free panel to discuss the future of DBA careers, and why DBAs are essential to DevOps. Register here.

Commentary Competition

Enjoyed the topic? Have a relevant anecdote? Disagree with the author? Leave your two cents on this post in the comments below, and our favourite response will win a $50 Amazon gift card. The competition closes two weeks from the date of publication, and the winner will be announced in the next Simple Talk newsletter.

The post Implementing DevOps Doesn’t Get Rid of Database Administrators appeared first on Simple Talk.


from Simple Talk http://bit.ly/2FSGZMm
via

Thursday, January 17, 2019

Introduction to Mobile Development with Unity

Two things were introduced in 2008 almost at the same time. The iOS and Google Play Store opened up the world of mobile gaming. This new world introduced a new way to play games, all on your smartphone. Since then, it has only gotten easier to create your own apps and release them on a store for all to download and play instantly. It should come as no surprise then that Unity can be used to easily create your own mobile projects. Whether you intend to make a game for yourself or for the world, for iOS or Android, you can make that vision come to life with Unity.

But where do you get started? The same place any creator should begin—with the basics. Follow along and you’ll create a basic app using Unity that does three simple tasks. The first objective is to tap on an object to make it change color. Next, a button will be created that the user may tap whenever they wish to lock the game camera in place. Why would you lock the camera? Well, for the final objective you will be rotating the in-game camera using your phone’s gyroscope. That’s right, by moving your phone in real life the camera will move in your game. All these tasks combine to create a simple app that introduces you to the basics of creating a mobile game in Unity.

Setup

Creating the project is like any other Unity project. Being a mobile project does not change this part of the process. After opening Unity, create a new project as shown in Figure 1.

Figure 1: Creating a new project

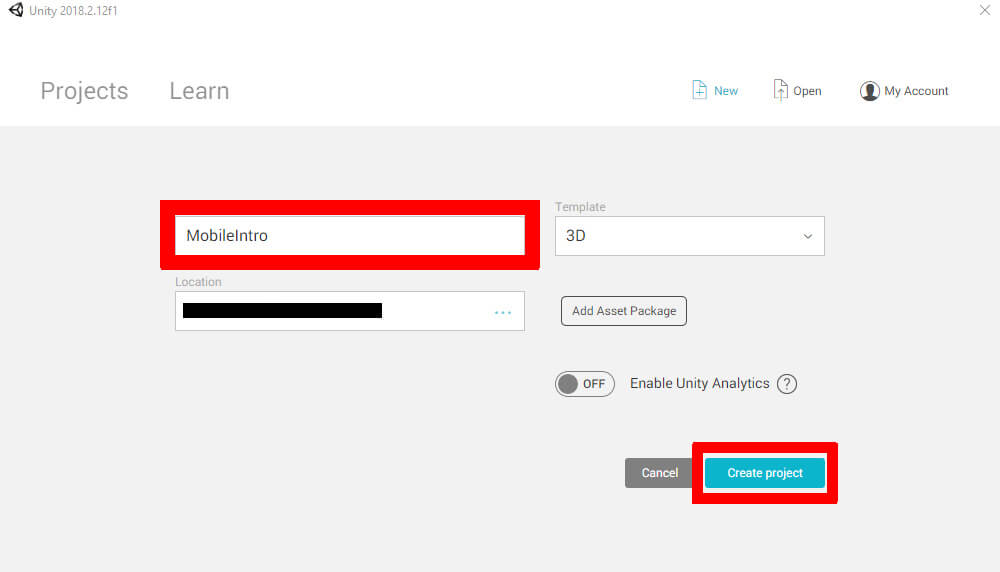
Next, name this MobileIntro. Make sure the project is a 3D project then choose the Location for the project. Once you’ve done all this, you’re ready to create the project. It should look similar to Figure 2.

Figure 2: Naming and creating the project.

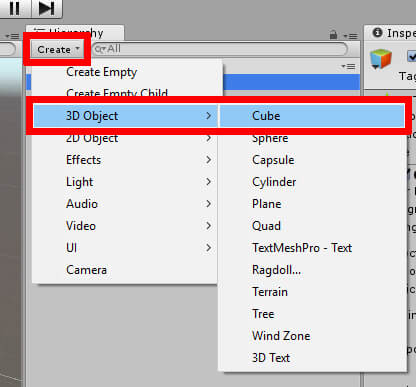
You may wish to start by creating the objects that will be important to this project. Start by creating a cube. This will be the object the user can tap to change its color to a random color. To create this object, click the Create button in the Hierarchy window. Then navigate to 3D Object->Cube to create the cube object as shown in Figure 3.

Figure 3: Creating a cube.

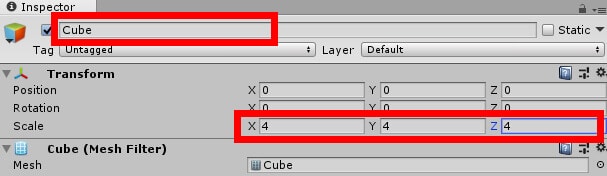
The cube is rather small at the moment, and anyone that’s done virtually anything with a mobile app knows how difficult it is to tap small objects. You’ll want to increase the cube’s size. Click on the Cube object in the Hierarchy. After this, navigate to the Inspector window and find the Transform component. This should be the first component you see at the very top of the Inspector window. Once found, change all variables in the Scale fields to four as shown in Figure 4.

Figure 4: Naming the object and setting the scale.

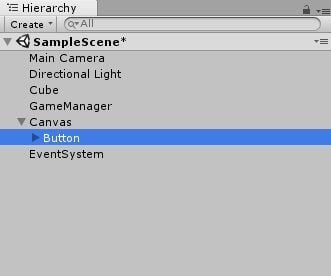
Next, you’ll create two more objects. The first is simply a manager that will hold the script that makes the project run. The second will be the user interface (UI) that the user can interact with to lock the game’s camera to its current position. Using the same Create menu in the Hierarchy window, create an empty game object and call it GameManager. Then, once again using the Create menu, navigate to UI->Button to create the button that the user will tap to perform the camera locking function. When finished, the Hierarchy should look similar to Figure 5 below.

Figure 5: The current hierarchy.

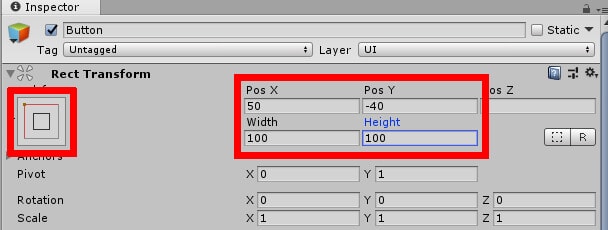
You may need to adjust the position of the button you just created to get it in exactly the position you want. Select the Button object in the Hierarchy window and go to the Transform component in the Inspector. Set the anchor to the top left part of the screen. Then set Pos X to 50 and Pos Y to -40. Finally, change the Width and Height of the button to 100 as shown in Figure 6.

Figure 6: Setting the anchor, position, width, and height.

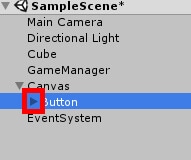
Next, you will want to change the text of the button to say LOCK. In the Hierarchy window, click the arrow next to the Button object as shown in Figure 7.

Figure 7: Opening the child objects.

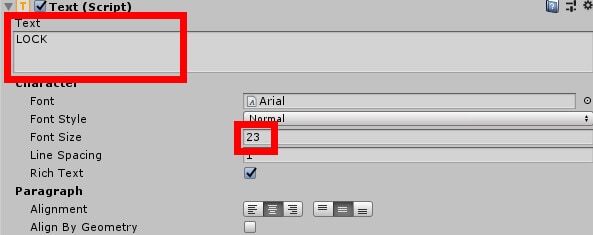
The button’s Text object will appear. Select it and navigate to the Text component in the Inspector window. You’ll then need to change the text to say LOCK, then adjust the size of the text using Font Size. When finished, the component should look like Figure 8 below.

Figure 8: Setting the text and font size.

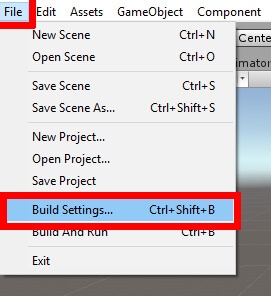
With this completed, all the objects needed for the project are in place, but it’s not quite time to write code yet. As this is intended to be a mobile project, you will need to perform a few actions to make the program run on your mobile device. From the top menu select File->Build Settings as shown in Figure 9.

Figure 9: Opening the build settings.

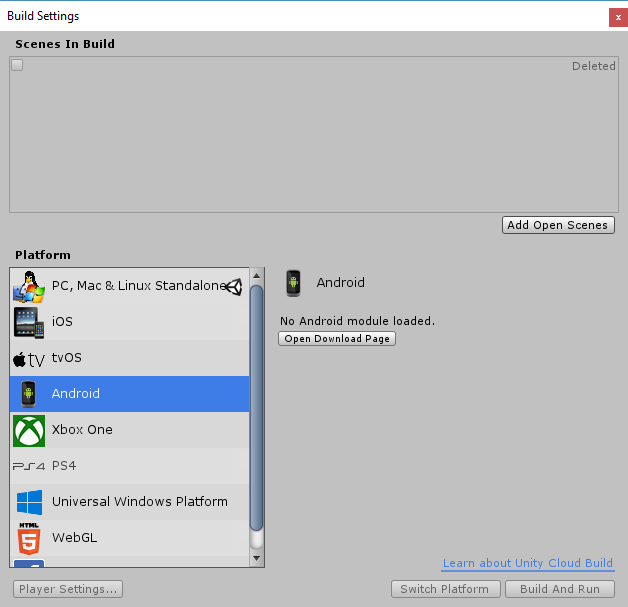
This opens up the Build Settings dialog which shows you the many platforms where you could run an app created in Unity. For each platform, however, different modules will need to be installed. Figure 10 shows the dialog and the message you’ll see about installing the module for Android development.

Figure 10: The Build Settings without having the necessary modules installed.

This is where you would go to build your project to be run on whichever device you choose. In addition, you can navigate to the player settings and change some properties of your build such as the image your application will use. Depending on how you installed Unity you may also need to install the Android or iOS modules for your copy of Unity. You can use the same Unity installer you used to install Unity onto your machine to do this. Just be sure to only select the Android and/or the iOS module for installation.

You may also need to download an SDK for your project to work. This example will be looking at how to install the Android SDK in particular. This can be accomplished either through command line tools or the Android Studio application. Instructions for both methods can be found in Unity’s documentation, found here.

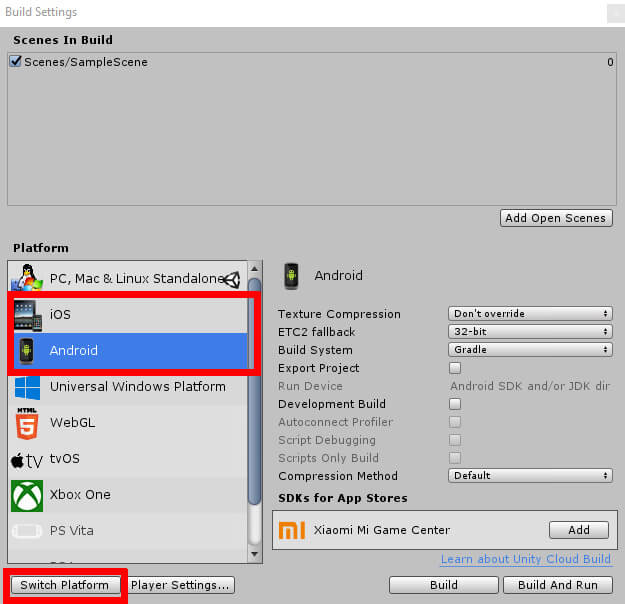
If you already have the above completed, then you’ll need to let Unity know that this is a mobile project. Once again, the example figures will show selecting Android devices as the platform of choice, but you should just as easily be able to use this project on an iOS device. Select the appropriate mobile device for you, then near the bottom of the Build Settings window you will need to click Switch Platform as shown in Figure 11.

Figure 11: Switching platforms.

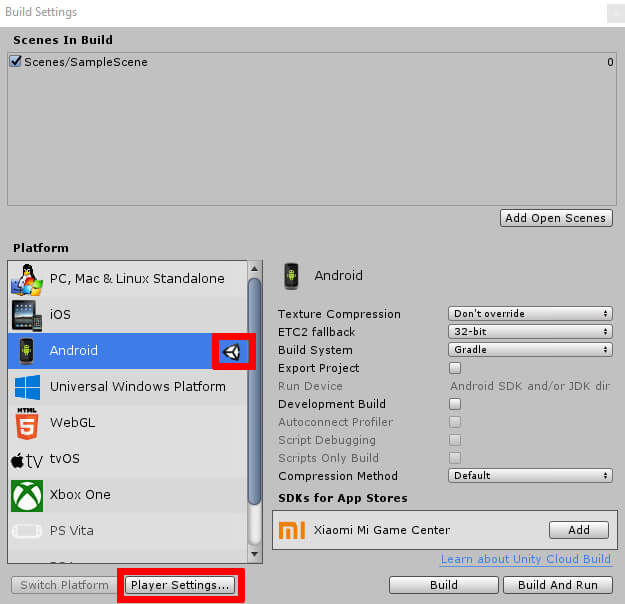
Once this is done, Unity will rebuild the project and set the target platform to your choice. You’ll see the Unity logo will be next to the platform you selected once the process is complete. Now you’ll need to change a few of the player settings for your project. To the immediate right of the Switch Platform button (now grayed out), click Player Settings shown in Figure 12.

Figure 12: Platform selected. Now on to player settings.

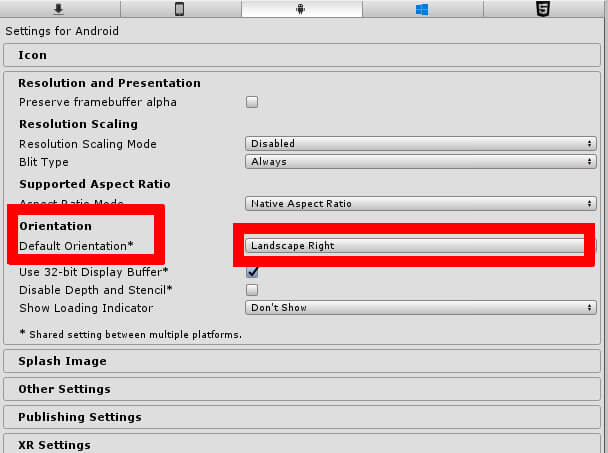
The Inspector window will change showing which player settings you can change for your project. You can do a lot here such as change the app icon or API settings. For this project you will start by changing the orientation of the app. Click Resolution and Presentation, then find the Orientation settings. This project will assume you set the orientation to Landscape Right. Figure 13 shows the settings.

Figure 13: Setting your app’s default orientation.

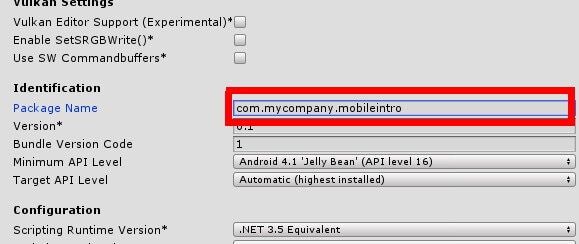
After this, search for Other Settings. In order to test your project on your phone later, you will need to set up a package name for the project. Under Other Settings you will need to locate the Package Name field. The required format for this package name is com.CompanyName.PackageName. Leave the com part of the name and change the CompanyName and PackageName. It can be set to whatever you wish, but the example below in Figure 14 will simply use com.mycompany.mobileintro as the package name for the project.

Figure 14: Creating a package name for apk file.

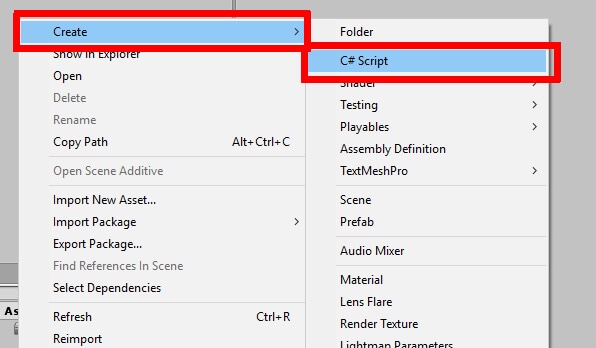
Your project’s mobile specific settings have now been configured, and it is time to write the project’s code. Right click in the Assets window and select Create->C# Script as shown in Figure 15.

Figure 15: Creating a C# script.

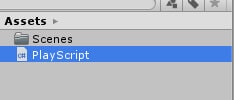
Name this script PlayScript. Once you’re done, the Assets window should look similar to Figure 16.

Figure 16: The Assets window with PlayScript

Double click the script to open it up in Visual Studio.

The Code

Thankfully, no additional using statements are needed to make this project. The line using UnityEngine should already be in the code upon creation. In addition, you’ll need to add using UnityEngine.UI in order to change the text of the UI button. Finally, you’ll need to declare some variables that will relate to three objects in the project. These objects are the in-game camera, the text in the button, and the cube you created.

public GameObject mainCamera;
public MeshRenderer cubeRender;
public Text buttonText;

After this, a few private variables will be declared. One of them is of the type Gyroscope. As you may have guessed, this has to do with your phone’s internal gyroscope that will be used to move the in-game camera. The next variable, called rotMultiplier, is used to increase how much the camera moves when you rotate your phone. By default, it’s not going to move very far. With this variable you can increase the amount the camera moves whenever the gyroscope detects rotation. In this example the value of rotMultiplier is fifty, but you may need to adjust this number in your own project. Finally, a boolean is created that will tell the project whether to lock the camera or not.

private Gyroscope gyro;
private float rotMultiplier = 50;
private bool lockCam = false;

Now, you move on to the Start function. Whenever the game starts, there will be a quick check to see if the phone you’re using has a gyroscope. Most mobile devices these days have gyroscopes, so why even have the check? This is primarily done to enable the gyroscope functionality for Unity. If for some reason, a mobile device lacks a gyroscope, this could prevent the project from crashing. In that event, you would most likely desire to add an else statement after the if statement and perform anything you wish the project to do in the event that the gyroscope is unavailable. However, this example will assume that your device has a gyroscope, and that no further code is needed. In the interest of good coding habits, the if statement will be used in this example.

if (SystemInfo.supportsGyroscope)
{
        gyro = Input.gyro;
        gyro.enabled = true;
}

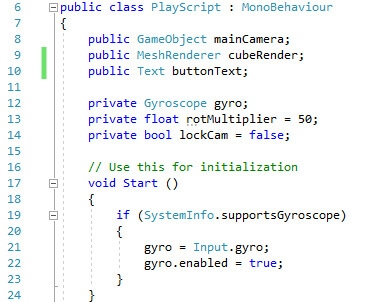
The Start function is complete and the code should look similar to Figure 17.

Figure 17: Variable declarations and Start function.

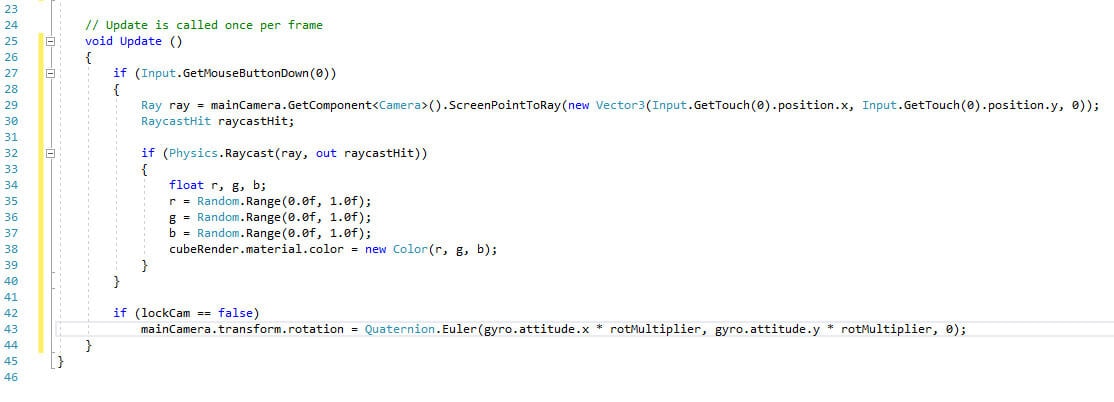
Next, you’ll need to move on to the Update function. Here you will code in the functionality to detect when the cube has been tapped on as well as the camera rotation. The code that catches when the cube has been tapped is as follows:

if (Input.GetMouseButtonDown(0))
{
        Ray ray = mainCamera.GetComponent<Camera>().ScreenPointToRay(
                 new Vector3(Input.GetTouch(0).position.x, 
                 Input.GetTouch(0).position.y, 0));
        RaycastHit raycastHit;
        if (Physics.Raycast(ray, out raycastHit))
        {
                float r, g, b;
                r = Random.Range(0.0f, 1.0f);
                g = Random.Range(0.0f, 1.0f);
                b = Random.Range(0.0f, 1.0f);
                cubeRender.material.color = new Color(r, g, b);
        }
}

That’s curious. Why are you looking for mouse input? Here’s a handy little tip about Unity. You can use some of the same code that you would use for both games that run on a desktop computer as well as games that run on mobile devices. While you could specifically search for a tap of the screen, you may find it easier to simply look for a mouse click. Plus, if you aim to make a project that can work on both PC and mobile, that’s less code to change for each version. This can also be helpful when testing the program on a desktop computer before performing further testing on mobile.

You check to see if a mouse click has occurred. Once you do that, a raycast is created at the point where the mouse cursor was located at the time. A raycast can be thought of as an arrow being shot forward. If it hits something, the program can then gain information on what was hit and even change the object in question upon impact. A good example of this lies in nearly every first-person shooter game. Whenever you fire a gun, you’re not really shooting a bullet out of a gun. Rather, the game is firing a raycast from the gun. Depending on what it hits, a certain action will occur whether that be damaging an enemy or leaving a hole in the wall.

In this case, whenever a raycast hits your cube, the cube will get a new random color applied to it. After getting three random numbers representing red, green, and blue, you get the color variable from cubeRender and assign the new color. After these, you create the code that controls the camera movement. These next two lines of code are fairly simple. If the lockCam variable is false, then rotate the camera based on the inputs from the gyroscope.

if (lockCam == false)
   mainCamera.transform.rotation = 
       Quaternion.Euler(
            gyro.attitude.x * rotMultiplier, 
            gyro.attitude.y * rotMultiplier, 0);

With this code entered into the Update function, you can now move on. The code should look like Figure 18.

Figure 18: The Update function.

Before exiting Visual Studio, there’s one last function to be created. This function, called LockCamera, will be put to use in the UI button you made earlier. Whenever you tap that button, this function will be called. All it does is set lockCam to true or false and changes the text in your button. Placed underneath the Update function, the code looks like this:

public void LockButton()
{
        if (lockCam == false)
        {
                lockCam = true;
                buttonText.text = "UNLOCK";
        }
        else
        {
                lockCam = false;
                buttonText.text = "LOCK";
        } 
}

And with that out of the way, the code for this project is complete. Save your work and head back to the Unity editor to finish the project.

Completing the Project

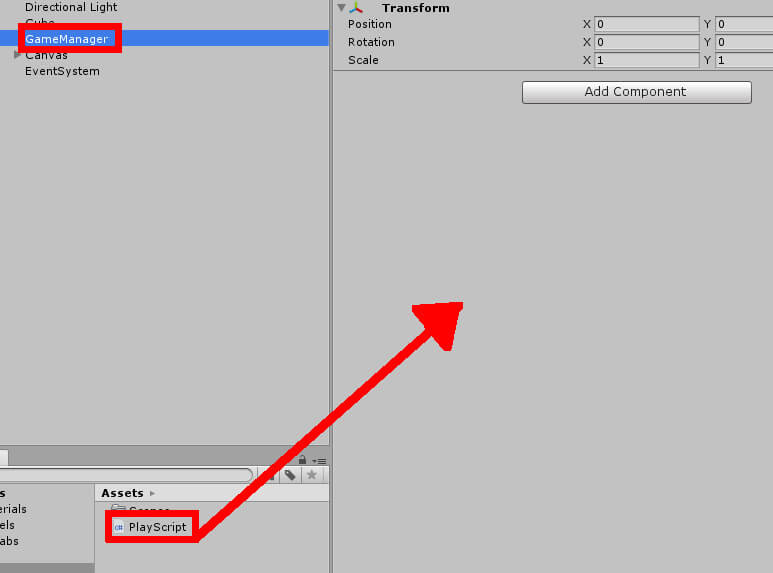
Remember the GameManager object from before? You’ll attach your freshly made script to this object. With GameManager selected in the Hierarchy, click and drag PlayScript from the assets window into the Inspector as shown in Figure 19.

Figure 19: Attaching PlayScript to the GameManager

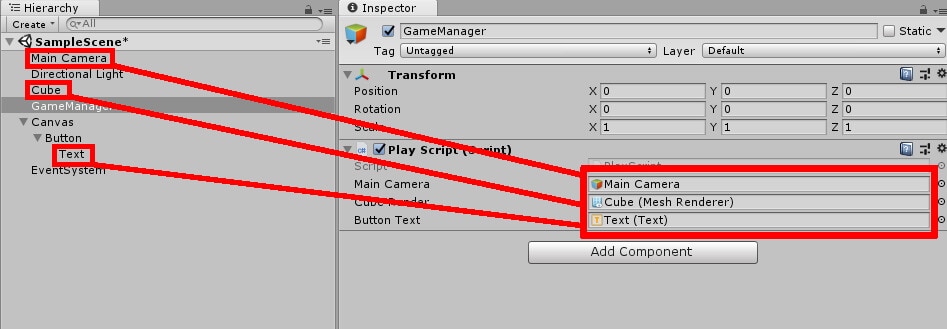
Next, you’ll need to fill in the Main Camera and Cube Render fields. In the Hierarchy, select the Main Camera object and drag it into the Main Camera field. Likewise, drag Cube into Cube Render. Figure 20 shows how this looks.

Figure 20: Setting the Main Camera, Button Text, and Cube Render variables.

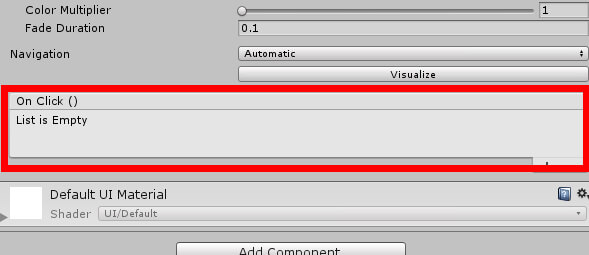
Next, locate the Button object in the Hierarchy. After selecting it, find the On Click event list in the Inspector as shown in Figure 21.

Figure 21: List of On Click events, currently empty.

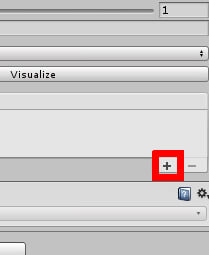
Click the + icon to add a new On Click event to your button shown in Figure 22.

Figure 22: Adding an On Click event.

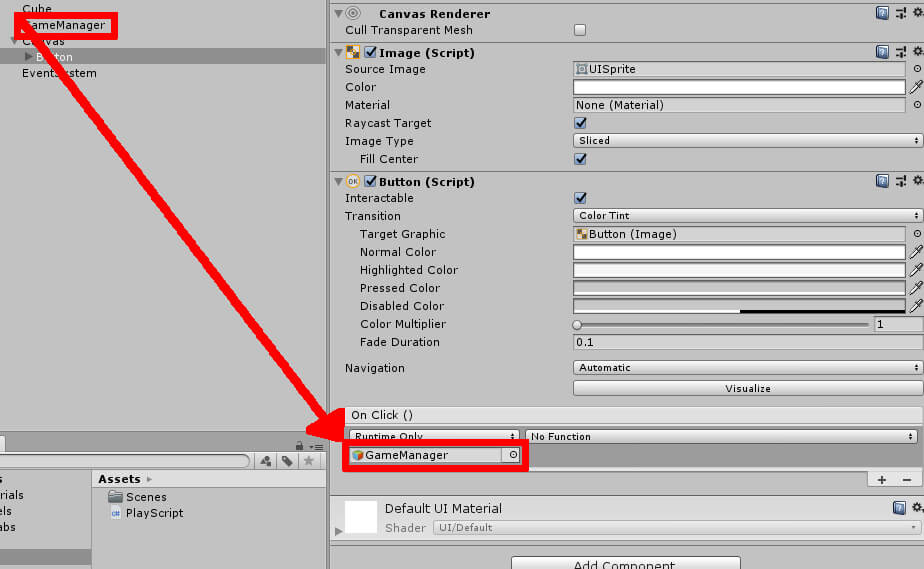
After this you will need to click and drag GameManager from the Hierarchy into the Object field. Figure 23 shows you what to do.

Figure 23: Setting GameManager as the object to pull code from.

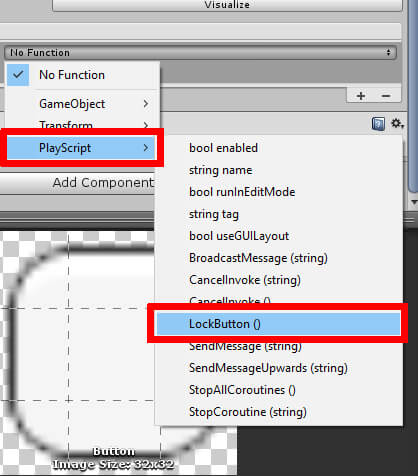
Once this is complete, click the drop down menu that current says No Function. Navigate to PlayScript->LockButton to set the LockButton function to this button’s On Click event as shown in Figure 24.

Figure 24: Setting LockButton as the function to call when your button is tapped.

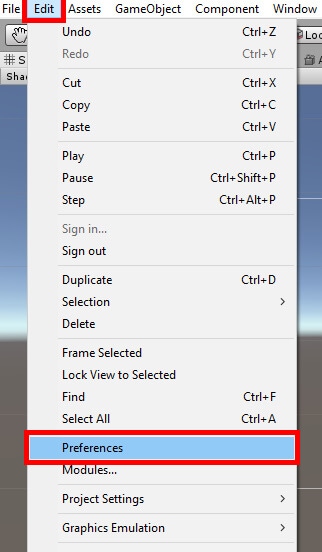
Two steps remain before you can test your project out properly. The necessary modules and SDK you need for the project have been installed. Unfortunately, the SDK doesn’t do much good if Unity doesn’t know where it is. Go to Edit->Preferences to take care of that as shown in Figure 25.

Figure 25: Accessing Unity Preferences.

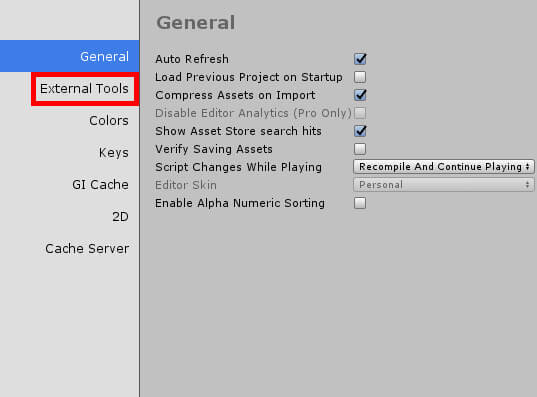
This opens the Unity Preferences dialog where you adjust settings such as the colors Unity uses. For this project, you’ll want to navigate to External Tools shown in Figure 26.

Figure 26: Navigating to External Tools.

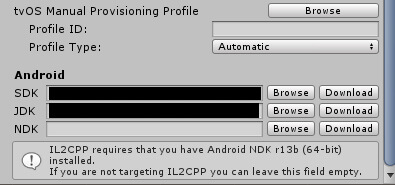
Scroll down until you find settings for Android. This is where you specify the file path for your SDK as well as the JDK (Java Development Kit) and Android NDK. You can also download the things you need using the convenient Download button. For mobile projects, you’ll at least want the SDK and JDK filled in. After installing everything you need, use the Browse button and find the path to your SDK and JDK as shown in Figure 27.

Figure 27: Specifying a path for the Android SDK and JDK.

There’s another step involved to make this project run on your phone, but it takes place outside of Unity. You’ll need to enable developer mode on your mobile device in order to build the project to your phone. On Android, you simply need to navigate to Settings->About phone->Software Information and then find the Build Number. Tap Build Number multiple times to enable developer mode on your phone. For iOS, the process is a little different. You’ll need Xcode running on your desktop, followed by plugging a USB cable from your phone into the computer. From there, navigate your settings until you find Developer. Finding this means you have developer mode enabled on your phone.

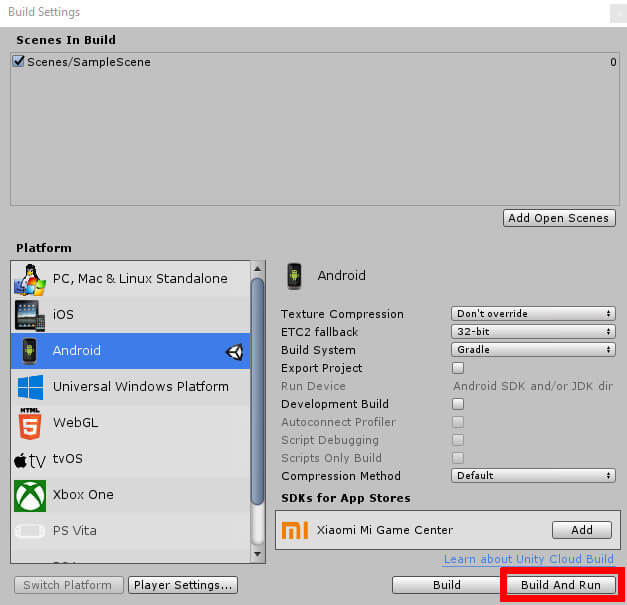
After all the above steps have been completed, your project is now ready, but how do you test this out on your phone? After all, it’s hard to test gyroscope functionality on a desktop computer. You can get around this by navigating to File->Build Settings. Once there, you’ll need to click the Build and Run button near the bottom of the window shown in Figure 28.

Figure 28: Building your project and running it on your mobile device.

This will build your game and then upload it to your phone. From there the program should begin running on your phone. Of course, you will need a USB cable connected from your computer to your mobile device for this method to work. Another window will pop up before the build begins saying you need to save the apk file somewhere on your computer. You may save this file wherever you wish, as it will not affect building the apk to your phone. In addition, it’s possible that a dialogue box with a message about JDK will pop up saying it found an up to date version. Go ahead and click Yes on this dialogue.

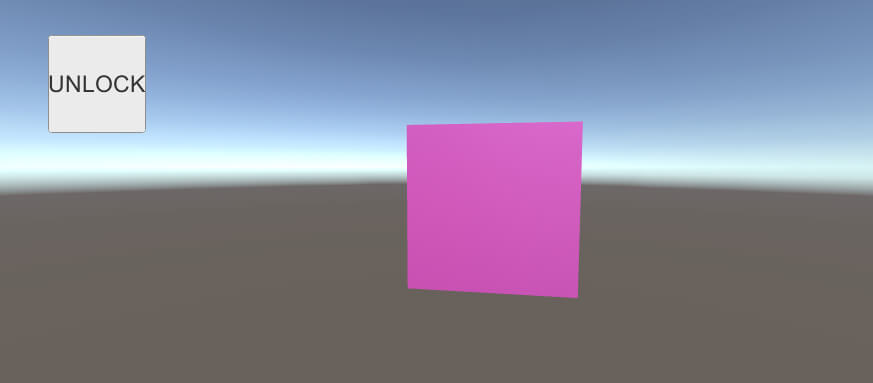
Once the build is complete, you should see your project begin to play on your phone. If for some reason it doesn’t play automatically, try searching around your apps and see if MobileIntro is anywhere to be found. Once the game begins, go ahead and rotate the device and notice the in-game camera move with your phone’s movements. If there’s a certain angle you like, you can tap the UI button near the top right to lock the camera in place. Finally, try tapping the cube and watch it change to a random color. Remember when I said that you can look for mouse input when looking for taps on your phone screen? You can see that in action both by tapping the cube and tapping the UI button. The app will look something like Figure 29.

Figure 29: Mobile project in action.

Conclusion

As you can see, creating a mobile project is easier than you might think. If you ever wanted to create another mobile game in the future, some settings you edited here in Unity would carry over into other projects, namely the path to the SDK. In some cases, there isn’t much difference between code for a mobile project and code for a PC project, so controlling different versions of the same app becomes easier too. However, it would have been a little underwhelming if all you did was make code that works on both PC and mobile, so you took advantage of your mobile device’s gyroscope to move the camera in time with your own movements. From here you can build off this example project to create your own mobile experience, whatever that may be.


The post Introduction to Mobile Development with Unity appeared first on Simple Talk.


from Simple Talk http://bit.ly/2swfrod
via

Monday, January 14, 2019

Using the DAX Calculate and Values Functions

If you should ever start reading a book on DAX, you will quickly reach a chapter on the CALCULATE function. The book will tell you that the CALCULATE function is at the heart of everything that you do in DAX and is the key to understanding the language. A delegate on one of my courses adopted the policy of starting every formula with =CALCULATE, and it’s not such a bad approach! This article explains how to use the CALCULATE function and also how to use the (almost) equally important VALUES function.

The Example Database for this Article

This article uses the same simple database as its two predecessors. This database shows sales of three toys for different cities around the world:
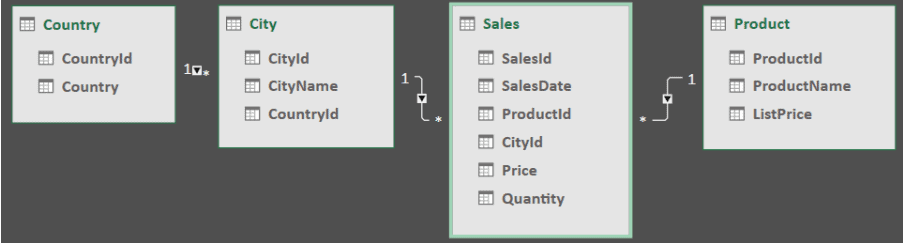
You can import this data into your own Power BI data model by first downloading this Excel workbook, or by running this SQL script in SQL Server Management Studio.

As for the previous articles in this series, everything I describe below will work just as well in Power BI, PowerPivot or Analysis Services (Tabular Model), each of which Wise Owl train.

The CALCULATE Function

To understand the CALCULATE function, you must understand filter context, so that’s where I’ll begin for this article.

Filter Context Explained Using an Excel Pivot Table

Suppose you have the following pivot table in Excel, showing the number of sales for each country, city, and product in the database. The figure selected shows that there were three sales of Timmy Tortoise products in London (UK):
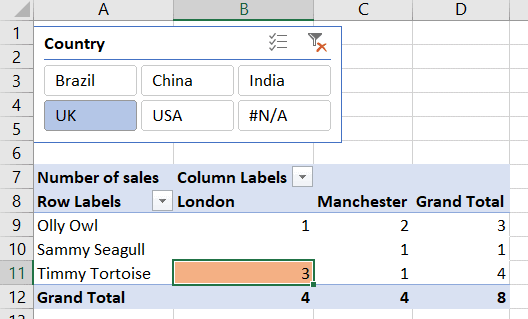
The filter context for the shaded cell containing the number 3 is therefore as follows:

Country dimension: UK

City dimension: London

Product dimension: Timmy Tortoise

If you were to double-click on this cell in Excel, you would see the underlying rows:

These are the three sales which took place for this product in this country and city.

Now suppose that you change your pivot table to show the number of sales as a percentage of the total for each column. This would give:
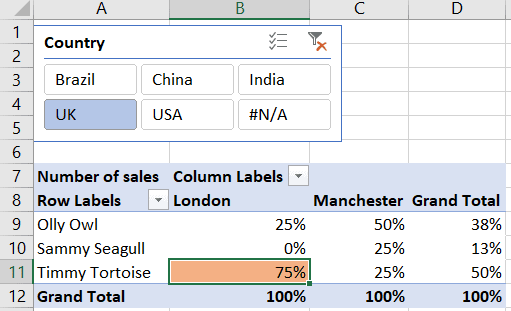
The figure for Timmy Tortoise for London is 75%, which is:

Total sales for London for Timmy Tortoise / 
Total sales for London for all products

This gives 75% because this is the result you get when you divide 3 (the number of sales in London for Timmy Tortoise) by 4 (the number of sales in London for all products).

Note that I’ll often refer in this article to the numerator and denominator. In any fraction A / B, the numerator is A and the denominator is B (but you knew that from school maths, didn’t you?).

Removing One Constraint Using CALCULATE and ALL

Now suppose that you want to recreate this pivot table using a matrix and slicer in Power BI:
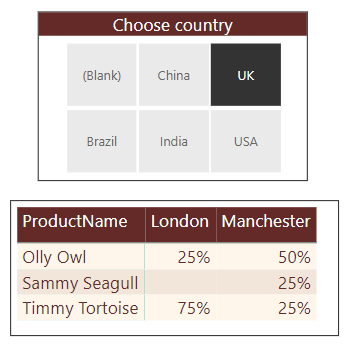
The figures are exactly the same, and for Timmy Tortoise for London you’ll see 75% because this is the ratio between the number of sales for this product and city (3) against the number of sales for all products and this city (4).

To solve this problem, you’ll use the CALCULATE function which is the answer to most questions in DAX. The syntax of the function is as follows:

The measure you should create (and show) is this:

% of all products = DIVIDE(
    // the numerator: number of sales for the current filter context
    COUNT(Sales[SalesId]),
    // the denominator: number of sales for the current filter
    // context, but for ALL products
    CALCULATE(
        COUNT(Sales[SalesId]),
        ALL('Product'[ProductName])
    )
)

I’ve put my measure in a separate table – if you’re not sure how to create this table or how to create measures, see the previous article in this series. What the measure does is to calculate the numerator (the number of sales for the current product and city) and divide this by the denominator (the number of sales for the current city only, with any product constraint removed). Here’s what this calculates:

Total sales for the current filter context / 
Total sales for the current filter context, 
but removing any product constraint

If you display row and column totals for this measure, you get this:
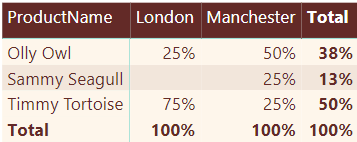
The figures in the bottom row make sense: total sales for London for all products divided by total sales for London for all products will always give 100%!

Removing Multiple Constraints Using ALL

Suppose that you now want to display the number of sales as a percentage of the total for all cities and for all products, to get this:
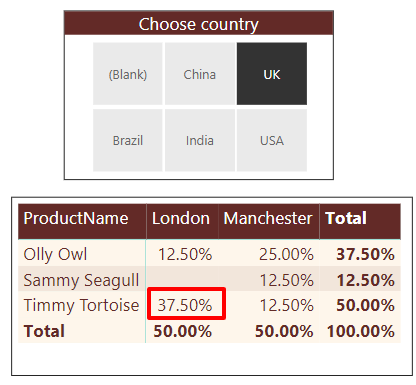
In this case, the numerator is the total number of sales in the UK in London for Timmy Tortoise, and the denominator is the total number of sales in the UK; the other two constraints have been removed from the denominator. Here is a DAX measure to calculate these figures:

% of all products and cities = DIVIDE(
    // divide the number of sales ...
    COUNT(Sales[SalesId]),
    // ... by the number of sales for all products and
    // cities
    CALCULATE(
        COUNT(Sales[SalesId]),
        ALL('Product'[ProductName]),
        ALL(City[CityName])
    )
)

You can use the ALL function as many times as you like – each time it will remove one dimension from the filter context.

Using ALLEXCEPT to Remove All but One Constraint

An alternative solution to the above problem would be to calculate this ratio:

Total sales for the current filter context / 
Total sales for the current filter context, 
but removing every constraint apart from the country one

Here’s a quick comparison of the two approaches:
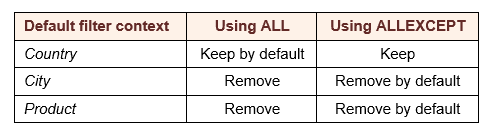
Here’s a measure which would show each product/city’s contribution to the grand total for each country:

% relaxing everything but country = DIVIDE(
    // divide the number of sales ...
    COUNT(Sales[SalesId]),
    // ... by the number of sales, keeping only the 
    // country constraint
    CALCULATE(
        COUNT(Sales[SalesId]),
        ALLEXCEPT(
            Sales,
            Country[CountryName]
        )
    )
)

It’s up to you whether you think it’s more elegant to remove constraints from the filter context individually using ALL, or to remove all constraints apart from one using ALLEXCEPT.

Replacing Filter Context Using CALCULATE

The previous examples have all involved removing the filter context in whole or in part. What if you wanted to change it to show the ratio for each matrix cell between the number of sales for that cell and the number of sales for the same filter context, but for the product Timmy Tortoise? That is, you want to calculate:

Total sales for the current filter context / 
Total sales for the current filter context, but ignoring 
any product constraint and using the Timmy Tortoise product instead
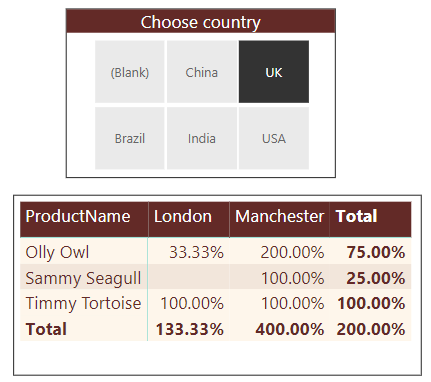
For this example, it’s inevitable that the figures for Timmy Tortoise should be 100%, because for each cell in this row you’re dividing a figure by itself. The matrix above shows that sales of Olly Owl were only a third of those for Timmy Tortoise in London but were twice those for Timmy Tortoise in Manchester.

A formula that you could use might be:

% of Timmy = DIVIDE(
    // divide the number of sales for the filter context by ...
    COUNT(Sales[SalesId]),
    // ... the number of sales for the filter context, but
    // removing any product constraint and replacing this 
    // with a constraint that the product should equal Timmy Tortoise
    CALCULATE(
        COUNT(Sales[SalesId]),
        'Product'[ProductName] = "Timmy tortoise"
    )
)

What this does is to calculate the number of sales for a particular country, city and product, and divide this by the number of sales for the same country and city, but for Timmy Tortoise. The extra filter you add in the CALCULATE formula doesn’t build on the filter context for the product, but instead replaces it.

Using the ALLSELECTED Function as Opposed to ALL

Sometimes you’ll want to reference just the selected items in a dimension, in a slicer, for example, rather than include all of the items in your formula. Here’s an example of a matrix where you might want to do this:
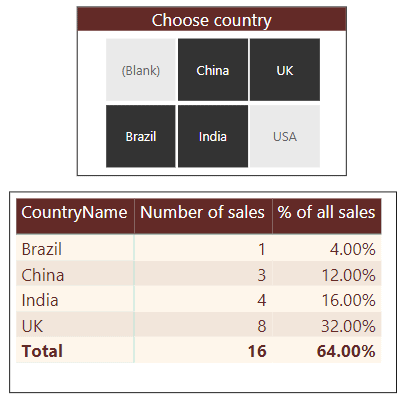
The measure shown initially is as follows:

% of all sales = DIVIDE(
    // divide number of sales for filter context ...
    COUNT(Sales[SalesId]),
    // ... number of sales for all countries
    CALCULATE(
        COUNT(Sales[SalesId]),
        ALL(Country[CountryName])
    )
)

The figures don’t add up to 100% because for each country the statistic shown equals:

the number of sales for that country / 
the number of sales for all countries

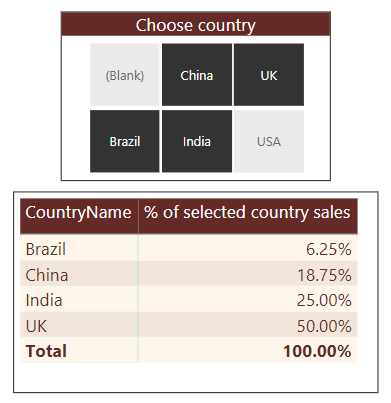
In this example the USA is included in the denominator but not in the numerator. To get the statistic to work, you need to reference only the selected countries in the denominator:

% of selected country sales = DIVIDE(
    // take the number of sales for each country
    COUNT(Sales[SalesId]),
    // divide this by the number of sales for all 
    // currently selected countries
    CALCULATE(
        COUNT(Sales[SalesId]),
        ALLSELECTED(Country[CountryName])
    )
)

This gives the required 100% total, regardless of the combination of countries you select in the slicer:
Context Transition Using the CALCULATE Function

Before moving on from the CALCULATE function, it has one more string to its bow. Consider the following two formulae:

Total sales A = SUMX(Sales,[Price]*[Quantity])
Total sales B = CALCULATE(SUMX(Sales,[Price]*[Quantity]))

If you’ve been following up to now, you’ll realise that these two formulae must give the same result under all circumstances:

The first formula gives the total sales value for the current filter context;

The second formula gives the total sales value for the current filter context, with no extra modifications to it.

However … what happens if there isn’t a filter context to begin with? In this case the second formula will create a filter context, and hence return a different answer than the first. How can you not have a filter context? By creating a calculated column in a table:
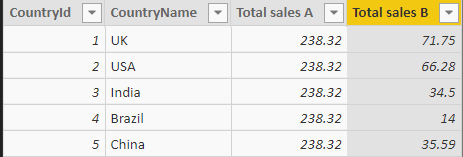
The first formula gives the same result for each row. Because calculated columns don’t have a filter context by default, the formula sums sales over all of the rows in the sales table, giving the same answer (238.32) for each.

Remember that the second formula is as follows:

Total sales B = CALCULATE(SUMX(Sales,[Price]*[Quantity]))

The CALCULATE function doesn’t just allow you to change the filter context, it can create it, too. For each country, this creates a filter context, limiting the rows in the sales table to those for the country in question, and hence giving a different answer for each row of the above table. The process of changing row context into filter context in this way is called context transition.

The VALUES Function

Learning the CALCULATE function is key to understanding how to create measures in DAX, but the VALUES function runs it a close second. The rest of this article shows what this function does, and how to use it to create a range of effects in your Power BI reports.

What the VALUES function returns

The VALUES function returns the table of data for the current filter context. To explain what this sentence means, here’s an example. Suppose you create this table in a Power BI report:
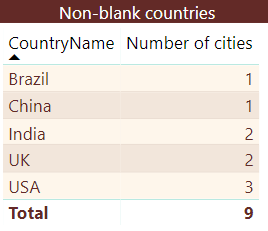
Note for this example that I’ve used a filter (not shown here) on the report to avoid showing any blank countries). The Number of cities column shows the number of cities for each country, using the following measure:

Number of cities = COUNTROWS(VALUES(City[CityName]))

If you could look at the filter context, this is what you would see:
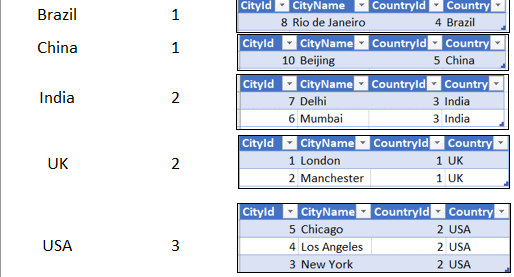
The VALUES function allows you to return a table containing one or more of the columns in the current filter context’s underlying table. For example, you could create this measure:

Cities = VALUES(City[CityName])

If you display this measure in your Power BI report, you’ll get this error message:
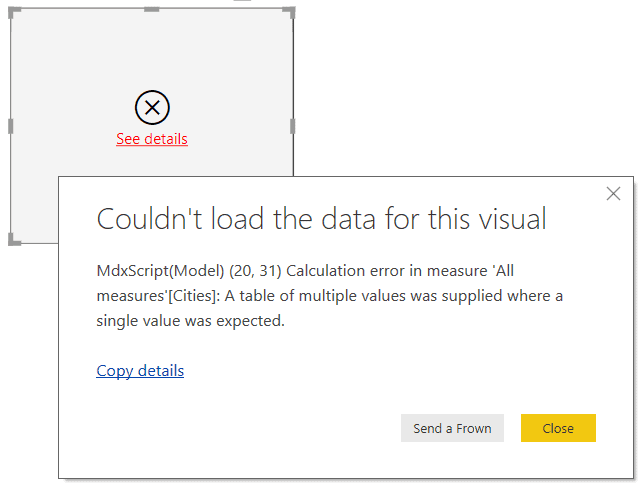
The problem is that you’re trying to display a column of values in a single cell. This would work for Brazil and China, each of which only has one city, but wouldn’t work for the other three countries.

What you could do, however, is to test whether there is only one city for a country, and in this event show its name; otherwise, you could show a message saying that there are multiple cities. Here’s a measure to do this:

Cities = IF(
    // if there is  one city for the current 
    // filter context ...
    COUNTROWS(VALUES(City[CityName])) = 1,
    // ... shows the city's name
    VALUES(City[CityName]),
    // Otherwise, show a message
    "More than one city"
)

Displaying this measure in our report would give:
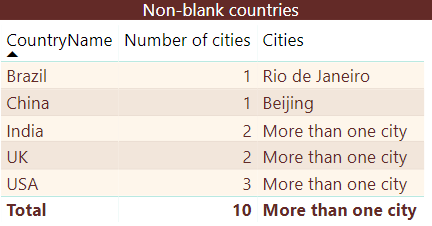
For the total row there are lots of cities in the current filter context, so naturally you get the More than one city message.

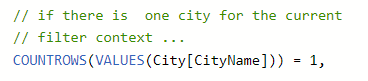
The above example shows two important features of the VALUES function. The first is that it returns a table of data. In the measure above, the COUNTROWS function expects to receive a table:
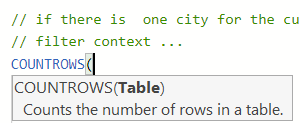
Fortunately, that’s what’s supplied:
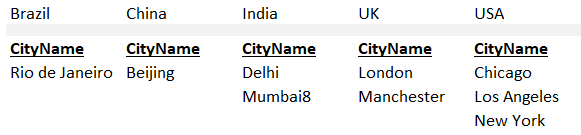
The VALUES function in this case returns a single-column table which looks like this for each of the 5 countries:
The second important point to understand about the VALUES function is that you can’t put a table into a cell without performing some sort of aggregation on it first, since a table can potentially contain multiple values. What this means is that the selected part of the measure below shouldn’t work:
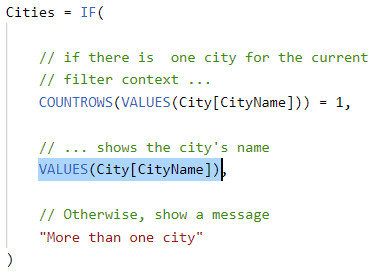
This is because the VALUES function returns a column of data, and even though you know that there is only one row in this column, and hence only one value, you would normally still need to apply some aggregation function (e.g., MAX, MIN, SUM) to the data.

Happily, there is one exception to this rule. If a call to the VALUES function returns a table with one column and one row, you can automatically treat this as a single scalar value without any additional work. This is why this measure works!

The HASONEVALUE Function and Other Alternatives

Checking whether the filter context only contains one value for a particular column is a common thing to do. It’s so common, in fact, that DAX has a dedicated function called HASONEVALUE to do this.

You could rewrite the measure like this:

Cities = IF(
    // if there is  one city for the current 
    // filter context ...
    HASONEVALUE(City[CityName]),
    // ... shows the city's name
    VALUES(City[CityName]),
    // Otherwise, show a message
    "More than one city"
)

Another solution would be to count how many distinct city names there are in the current filter context:

Cities = IF(
    // if there is  one city for the current 
    // filter context ...
    DISTINCTCOUNT(City[CityName]) = 1,
    // ... shows the city's name
    VALUES(City[CityName]),
    // Otherwise, show a message
    "More than one city"
)

These three methods, using VALUES, HASONEVALUE or DISTINCTCOUNT, are interchangeable, and I don’t think there’s any clear reason to favour one over another.

Using CONCATENATEX to List Out Multiple Values

For this example, you might want to list out the names of the cities for each country. You can do this using the CONCATENATEX function, which has this syntax:
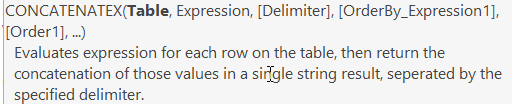
The arguments to this function are thus:

  • The table containing the values you want to concatenate
  • The column in this table containing the values to concatenate. You have to specify this even if the table only has one column, even though in this case it is blindingly obvious that this is the one you should choose!
  • The text you want to use as glue to join the column values together
  • Which column you want to order by. Again you need to specify this, even if you know you’re working with a single-column table.
  • The order-by direction, ascending or descending

For this example, you could modify the measure to read like this:

Cities = IF(
    // if there is one city for the current 
    // filter context ...
    DISTINCTCOUNT(City[CityName]) = 1,
    // ... shows the city's name
    VALUES(City[CityName]),
    // Otherwise, list all city names    
    CONCATENATEX(
        VALUES(City[CityName]),
        City[CityName],
        ",",
        City[CityName],
        ASC
    )
)

This more or less works, since it gives this table:
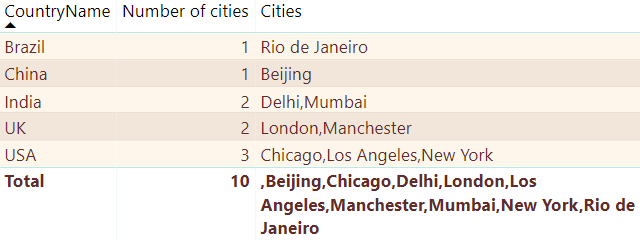
The only remaining problem is that the total row now looks odd. Technically it is correct, because, for this row, the filter context contains all of the cities for all countries. A better solution would be to check whether there is more than one country in the filter context:

Cities = IF(
    // if there's only one country in the filter context ... 
    HASONEVALUE(Country[CountryName]),
    // ... show the city name or names ...
    IF(
        // if there is  one city for the current 
        // filter context ...
        DISTINCTCOUNT(City[CityName]) = 1,
        // ... shows the city's name
        VALUES(City[CityName]),
        // Otherwise, list all city names    
        CONCATENATEX(
            VALUES(City[CityName]),
            City[CityName],
            ",",
            City[CityName],
            ASC
        )
    ),
    // ... or otherwise show nothing
    BLANK()
)

This is what you should now see when using this measure in the table:

All of this illustrates an important point about DAX measures. You can create a measure which gives sensible results for one particular visual, but can you be sure that it will give sensible results in another? Or in a totals row? Or a totals column, or grand total? You’ll often be faced with a trade-off in DAX between checking that a measure works under all possible circumstances and keeping things simple.

Modifying the Filter Context Using VALUES

Suppose that you now want to display the total sales for each country apart from the UK. The obvious way to do this is to sum total sales, but using the CALCULATE function to amend the filter context to omit the UK:

Value of sales = CALCULATE(
    // calculate total sales value
    SUMX(
        Sales,
        [Price] * [Quantity]
    ),
    // country not UK
    Country[CountryName] <> "UK"
)

This suffers from one major problem – it doesn’t work! Displaying this measure in a table would show the same value for every country:
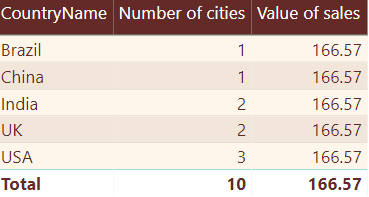
To understand why this measure is showing 166.57 for every country, remember what I said earlier in this article: when you apply a filter, it replaces the current filter context for a dimension. For this example you’re adding this filter to the CALCULATE function:
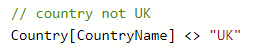
What this does is to lose any existing filter by the country dimension and replace it with one where the country is UK. Here’s what’s going on for each country:
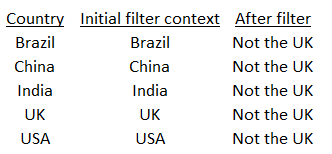
The total sales value for all of the countries apart from the UK is 166.57, so that’s what gets displayed in every row. What you want to do is to keep the existing filter context constraints for the country dimension, but then add to them. One way to do this is to use the VALUES function, making the new measure read like this:

Value of sales = CALCULATE(
    // calculate total sales value
    SUMX(
        Sales,
        [Price] * [Quantity]
    ),
    // keep the country filter as it is
    VALUES(Country[CountryName]),
    // and add that the country should not be the UK
    Country[CountryName] <> "UK"
)

This would give the following results:
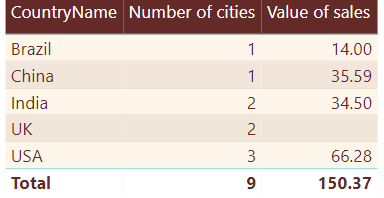
If you’re wondering why there is a discrepancy between the 166.57 shown in the first table and the 150.37 shown in the second, it’s explained by the fact that I had filtered the table to remove any sales taking place with no assigned country. If you remove this filter you get:
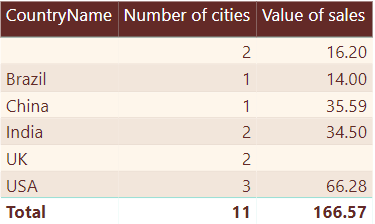
Add these 16.20 of sales in as above and you would get the required figure.

Using Disconnected Slicers to Make Reports Dynamic

This is a clever idea, which allows you to make reports dynamic. The idea is to create a slicer which allows you to choose which measure you want to show. In the example below, someone has chosen to show the average price of sales:
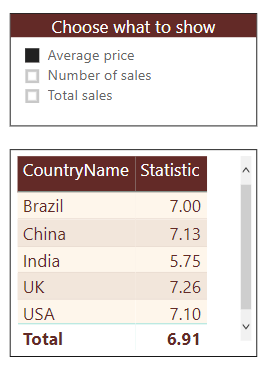
To make this work, first create a table to hold the statistics that you might want to report:
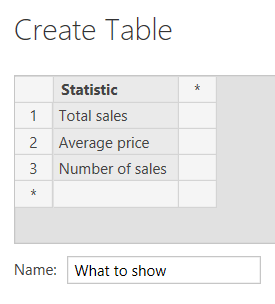
However, don’t link this table to any other. That’s why this technique is often called a “disconnected slicer”. Now create a slicer based upon this table:
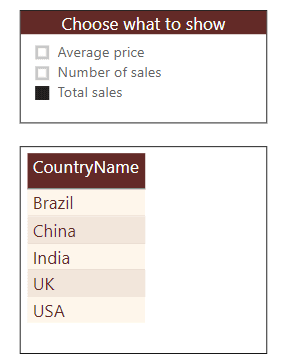
The idea is that when you select a statistic in the slicer, the bottom table will show its value. All that you now need to do is to create and show a measure which will yield:

  • The average price of sales if someone selects the first measure;
  • The number of sales records if someone selects the second measure;
  • The total value of sales if someone selects the third measure; or
  • A blank if someone selects more than one statistic at a time or doesn’t select one at all.

Here’s what this measure might look like!

Statistic = 
    // first find out what user wants to see (assume one thing chosen)
    VAR Choice = SELECTEDVALUE('What to show'[Statistic])
    // return different measure according to choice
    RETURN
        IF(
            HASONEVALUE('What to show'[Statistic]),
            SWITCH (
                Choice,
                "Average price", AVERAGE(Sales[Price]),
                "Number of sales", COUNTROWS(Sales),
                "Total sales",SUMX(Sales,[Price]*[Quantity])
            ),
            BLANK()
        )

One final question: is it possible to display different statistics using different number formatting? I can’t think of any way to do this except to use the FORMAT function:

Statistic = 
    // first find out what user wants to see (assume one thing chosen)
    VAR Choice = SELECTEDVALUE('What to show'[Statistic])
    // return different measure according to choice
    RETURN
        IF(
            HASONEVALUE('What to show'[Statistic]),
            SWITCH (
                Choice,
                "Average price", FORMAT(AVERAGE(Sales[Price]),"0.00"),
                "Number of sales", FORMAT(COUNTROWS(Sales),"#,##0"),
                "Total sales",FORMAT(SUMX(Sales,[Price]*
                                        [Quantity]),"#,##0.00")
            ),
            BLANK()
        )

The problem with this is that the FORMAT function turns numbers into text, although because it does so only after the calculation is complete for each filter context, this shouldn’t cause too much of a problem. Here’s what you’d see for the number of sales for the above measure, for example:
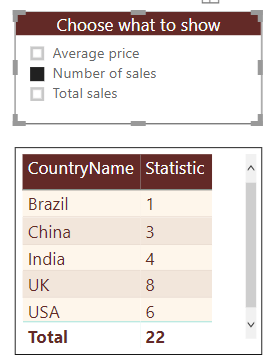
And just in case you’re wondering, I can’t think of any way to change the column title dynamically!

Dynamic Titles

There’s one more thing to demonstrate with the creative use of the VALUES function: how to show the choices made in a slicer. For the report page below, you’d like a card visual (shown selected) to display a measure listing the countries chosen:
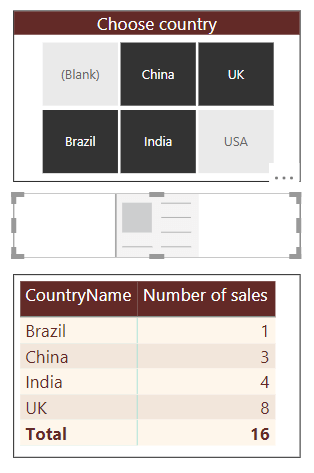
Here are some examples of what the card should display:

  • For the choices shown above, it should read “Brazil, China, India, UK”
  • If a user doesn’t select a country, it should read “All countries”
  • If a user picks a single country, it should give the country’s name

If you’ve been following the article so far, there’s nothing new with this – it just combines lots of the ideas you’ve already seen. Here’s a measure which would fit the bill:

Title = IF(
    // if there are countries selected ...
    ISFILTERED(Country[CountryName]),
    // test to see if one, or more than one
    IF(
        HASONEVALUE(Country[CountryName]),
        // there's one country selected; show it (but must use
        // the VALUES function to convert the single column, 
        // single row table into a scalar
        VALUES(Country[CountryName]),
        // otherwise, join the country names together
        CONCATENATEX(
            Country,
            Country[CountryName],
            ",",
            Country[CountryName],
            ASC
        )
    ),
    // if we get here, then user didn't select
    // any countries
    "All countries"
)

Here’s what this would show if you have one country selected assuming that you attach the measure to your card:
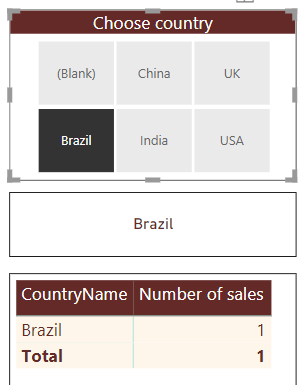
If you have multiple countries selected, you’ll see this:
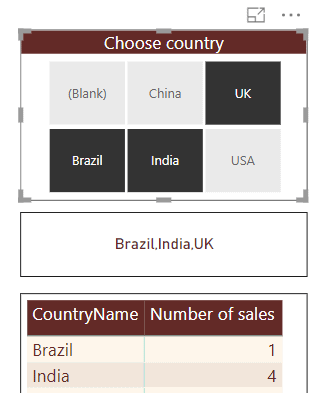
And finally, if you have no countries selected, you’ll see this:
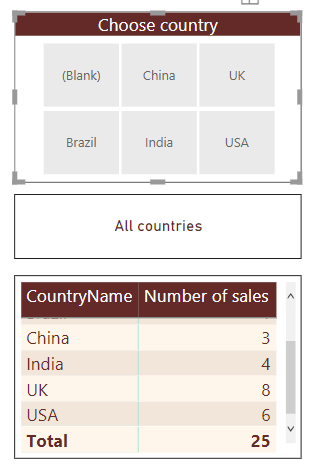
If you want to be even fancier you could use a quick measure to display only the first 3 countries in any list which I covered in the previous article in this series.

Conclusion

This article has shown how you can use two of the most important DAX functions: CALCULATE and VALUES. The article began by showing how you can use the CALCULATE function to amend the default filter context, mainly in order to create ratios. I then showed how you can use functions like VALUES, HASONEVALUE and ISFILTERED to produce a variety of clever effects in DAX. The next article in this series will look at the FILTER and EARLIER functions. You should make sure that you understand clearly how you can use the CALCULATE function to change filter context before progressing, since the DAX formulae won’t get any easier!


The post Using the DAX Calculate and Values Functions appeared first on Simple Talk.


from Simple Talk http://bit.ly/2RtgBjd
via