Tuesday, October 20, 2020

Building cross-platform apps with .NET and Uno

Back in 2016, Microsoft raised the company’s level of confidence in the mobile world with the acquisition of Xamarin. Xamarin is Microsoft’s open source platform for building Android and iOS apps with .NET and C#.

C# has proven its worth through all these years and brought with it tons of mature projects as well as having a solid community. When it comes to the in-house solutions for mobile development, no one has beaten Xamarin.Forms. It extends the .NET developer platform to Android, iOS, and, of course, Windows apps. This is all from a single and shared codebase.

However, it’s not the only option out there. Now there is the Uno Platform. It offers even more options like targeting all the major platforms (iOS, Android, Windows), as well as native mobiles and web browsers.

The official documentation states:

Familiarity and richness of C# and XAML combined with productivity boosts of hot reload, hot restart, edit, and continue and more.

In addition to those features, Uno also supports WebAssembly, dev loops, automatic responsive designs, and more. You will find a couple of showcases on their official website, which you can browse through to learn more about Uno capabilities. However, this article explores the framework via the installation and creation of a simple app that converts a given temperature from Celsius to Fahrenheit and vice-versa. This way, you might experience the platform a bit deeper. So, come with me!

Install and configure

First, you need Visual Studio installed. The Community edition is just fine for this example.

You can also develop for Uno with VS Code, but this article sticks with Visual Studio since it offers more flexibility and ready-to-use options.

If you have already installed Visual Studio, chances are that you didn’t install at least one of the following workloads:

  • Universal Windows Platform development
  • Mobile Development with .NET
  • ASP.NET and web

If that’s the case, no worries. I’ll help you to fix that.

Search for the Visual Studio Installer program and run it. Once it pops up, make sure that it has no available updates to install. If it has, just push the update button and wait until it gets finished.

Click the Modify button and select the needed workloads, then click the Install button.

Then, download the latest version of .NET Core for your OS, to make sure Uno will have the proper version to work with.

The Android Studio

You’ll also need to install the Android Studio on your computer. The reason I’m picking only Android to make the tests is that it is OS-agnostic, which means that anyone can run it regardless of if you have a Windows or macOS. However, feel free to go with iOS if you are comfortable enough to work with it.

Go ahead and install it according to the official installation instructions. Just remember that when you start the Android Studio for the first time, it’ll download several required libraries and dependencies, so make sure to start it right after the installation.

Finally, install the Uno extension for Visual Studio. To install it, open your Visual Studio IDE and go to Extensions > Manage Extensions, then search for the term uno. In the result list, select the option Uno Platform Solution Templates and download it.
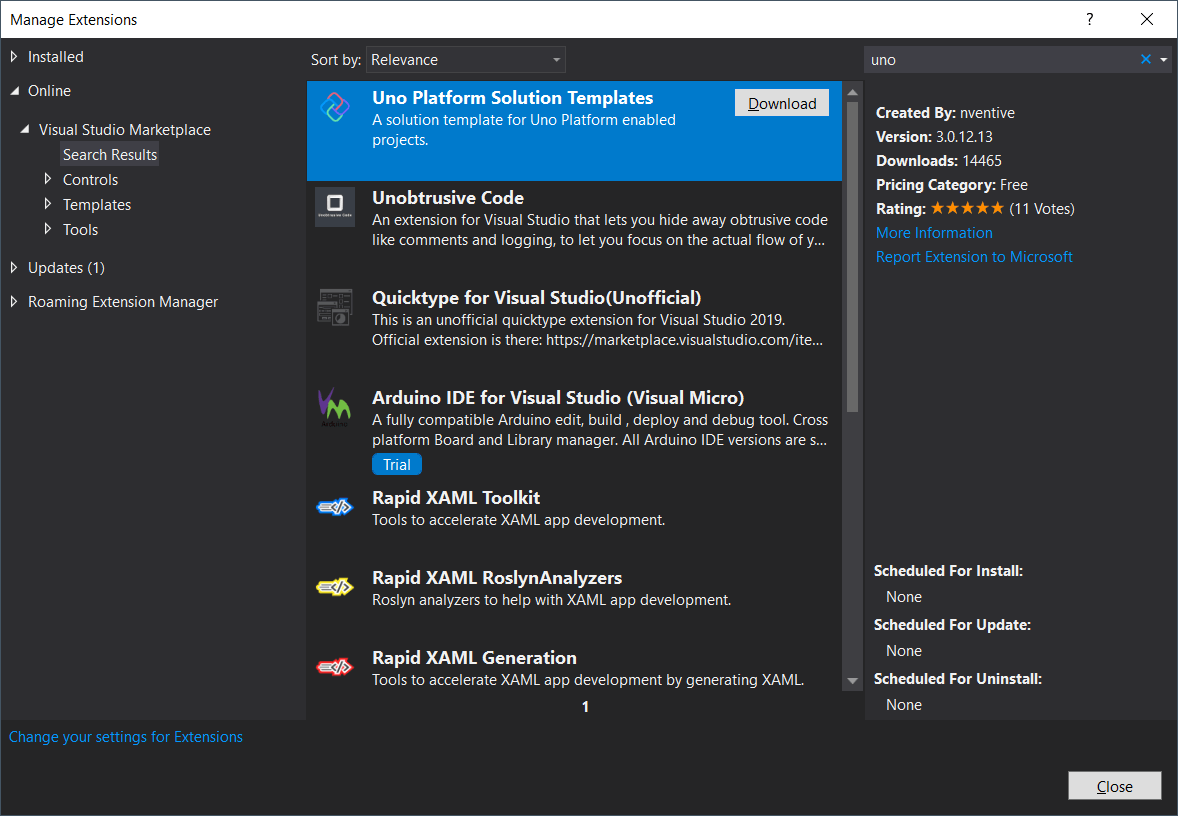
Figure 1. Installing Uno extension.

You’ll have to close Visual Studio to get it fully installed since the Uno extension only starts after such action. When the installation finishes, you’ll get a pop-up warning.

The project setup

When you start the IDE again, select the option Create a new project and, in the next window, once again, search for uno.

Select the option called Cross-Platform App (Uno Platform) and click Next. The window that follows will ask for a project and solution name, as well as the place to store the project (Figure 2).
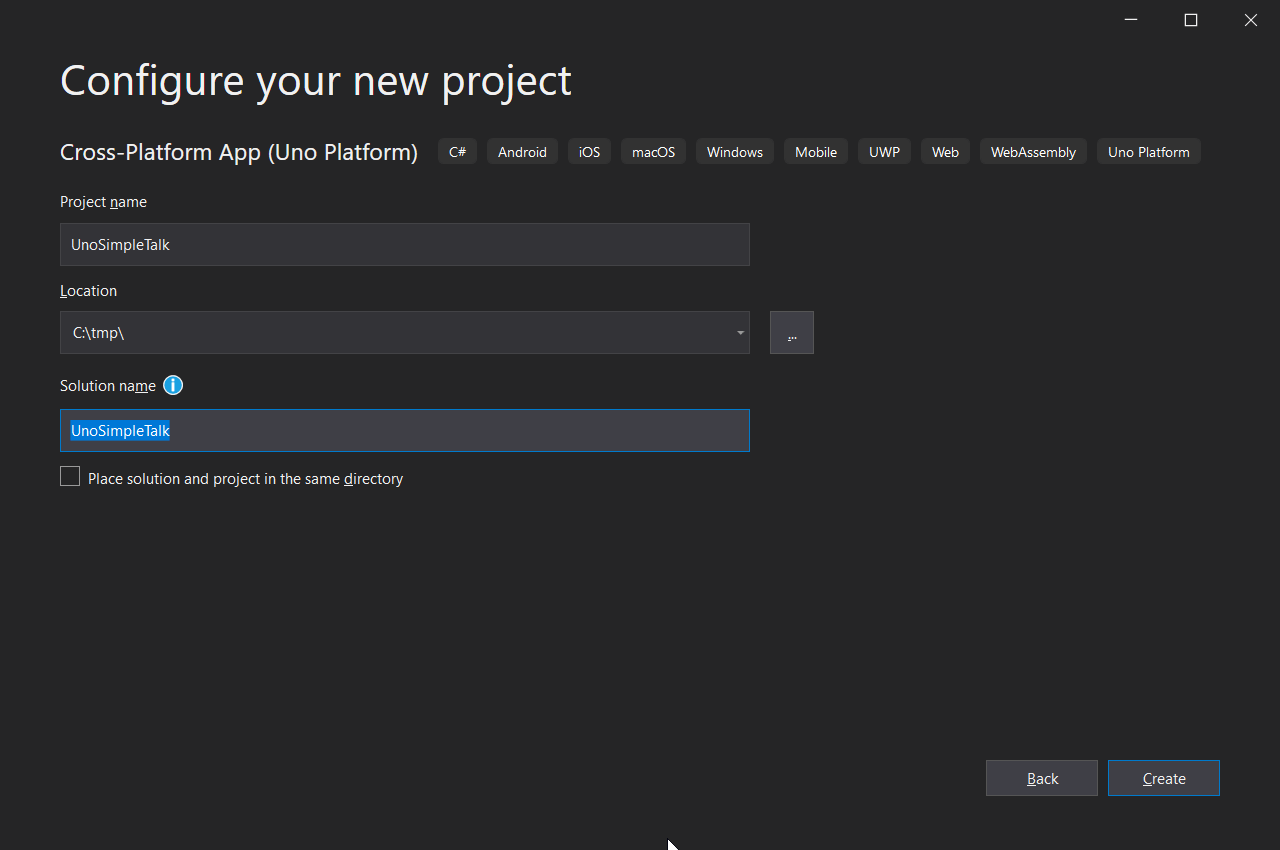
Figure 2. Setting up the new project.

When you do it, depending on the version of the Android you’ve installed, there are some chances that Uno will ask to update the Android SDK. If that happens, just click the Accept button as many times as it is prompted and then, click the OK button.

Also, Visual Studio may detect that the Windows SDK is not in the right version. In that case, a window like the one below may appear. Click the Install button and make sure to go through the steps until the end.
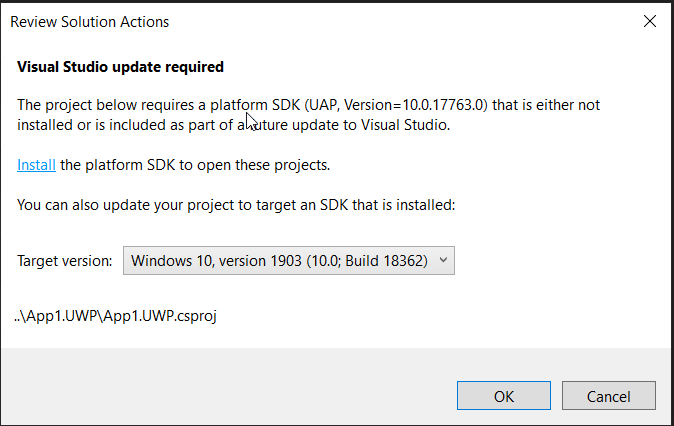
Figure 3. Updating the platform SDK

After this, Visual Studio will take some time to process the project creation.

One interesting thing to note is the number of auto-created projects on the solution. Take a look at Figure 4.
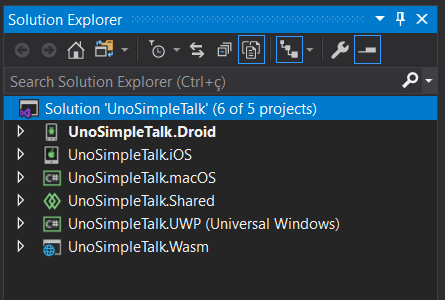
Figure 4. Auto-generated projects for the Uno solution.

Testing the project

To test it out, you just need to click the button Android Emulator at the top bar of the IDE:

Figure 5. Running project on Android Emulator

This will trigger the setup of a new emulator, considering that you have none yet. Just leave things as they are and keep moving on (Figure 6).
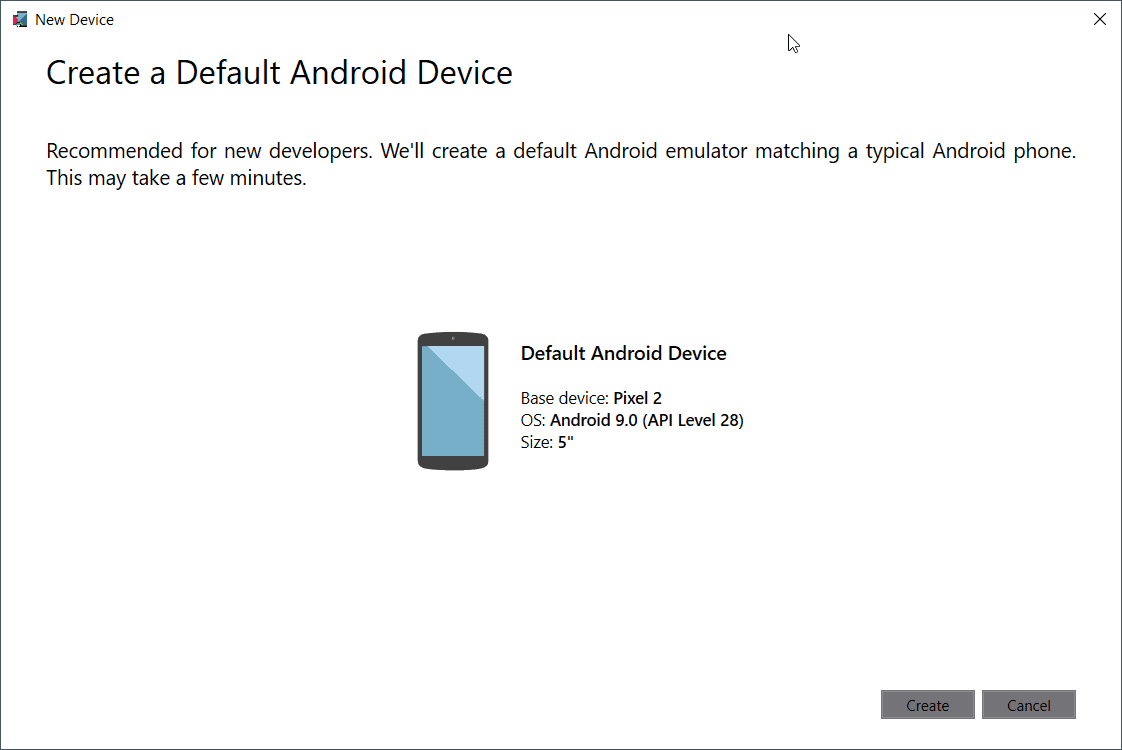
Figure 6. Creating a new Android device.

Accept the terms and wait until the device’s download finishes. When it’s done, click the Start button to start up the emulator.
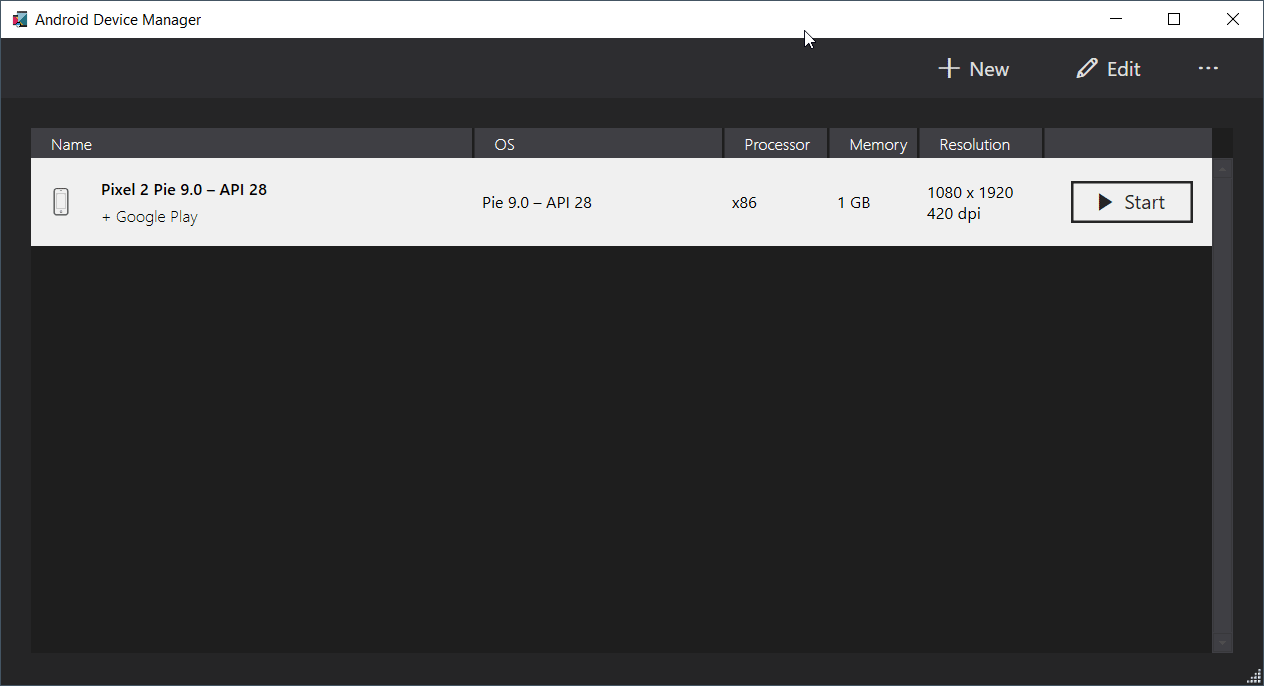
Figure 7. Downloaded Android device.

Normally, it takes a while to load since it is a bit heavy. Once it’s done, you should see the screen shown in Figure 8.

Figure 8. Hello World, Uno!

Fixing up the Uno packages

There are still some fixes to make. The first one is related to the Uno-related packages update. Right-click your solution and select the Manage NuGet Packages for Solution… option.

Then, go to the Updates tab, and you’ll probably see some pending updates to be made as shown in Figure 9.
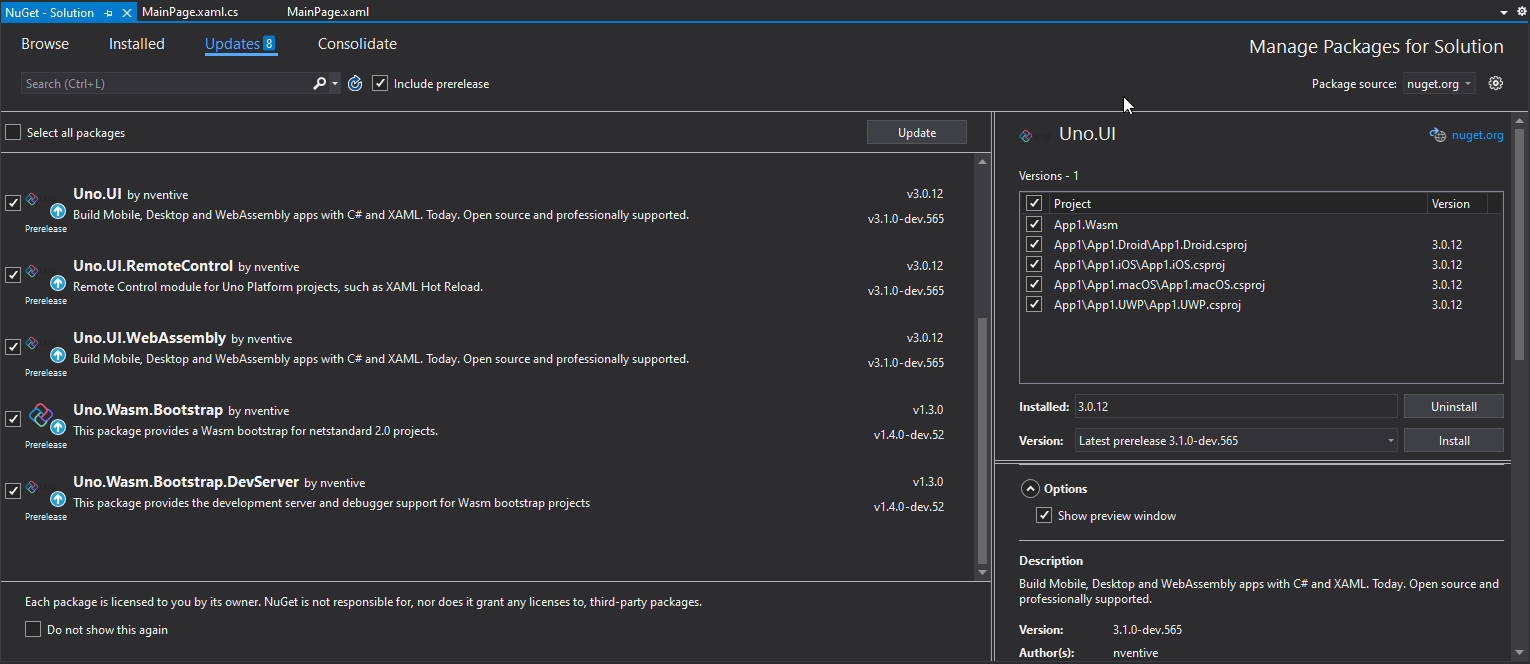
Figure 9. Pending update dependencies.

Select all the packages related to Uno and make sure to check the Include prerelease option too. Then, click Install making sure to mark all the projects of your solution.

Attention: be careful not to update all the listed dependencies, but just the ones related to Uno.

After that, go to the Browse tab and search for the Refractored.MvvmHelpers package, and install it (Figure 10). It will help with the two-way binding feature for the views and controllers.
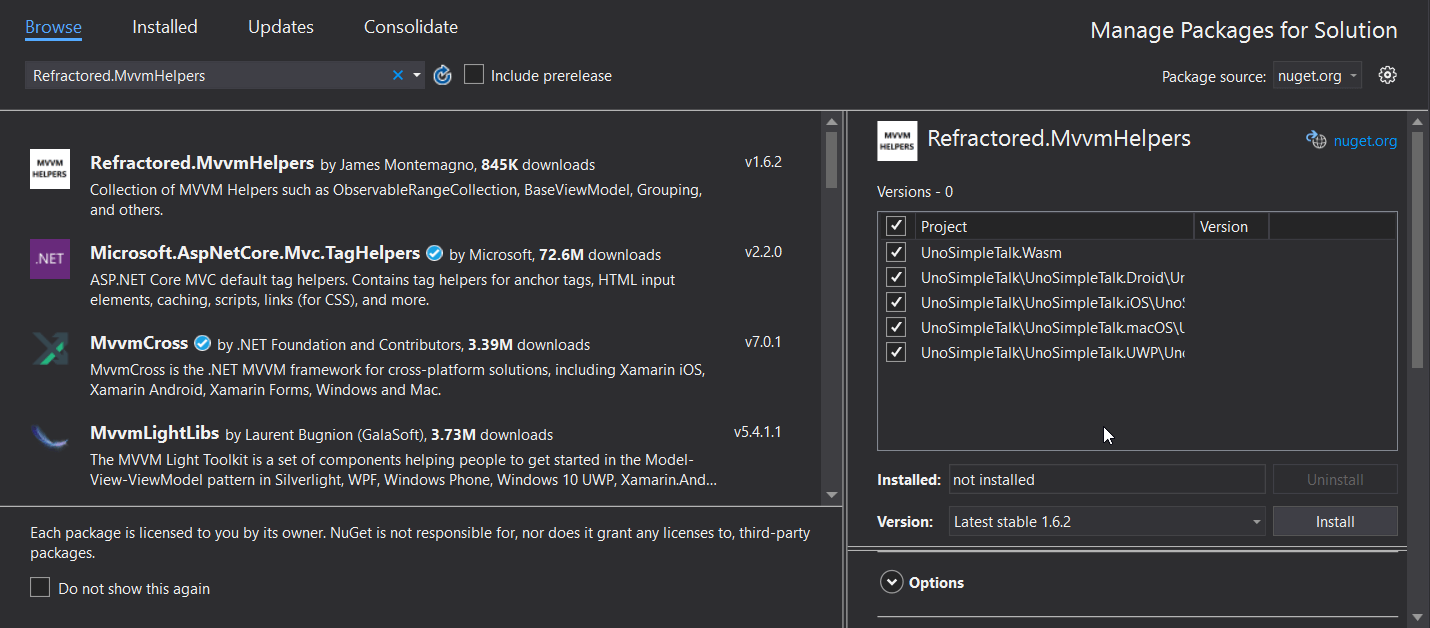
Figure 10. Installing MVVM Helpers package.

The model

Models are very important to Uno projects since the framework also adopts the MVVM pattern.

Within the UnoSimpleTalk.Shared project, create a new folder called Models as well as a new class called TempItem.cs in it. Place the code shown in Listing 1 into the file:

Listing 1. Temp Item model

using System;
using MvvmHelpers;
namespace UnoSimpleTalk.Models
{
    public class TempItem : ObservableObject
    {
        private int id;
        public int Id
        {
            get => id;
            set => SetProperty(ref id, value);
        }
        private TempType type;
        public TempType Type
        {
            get => type;
            set => SetProperty(ref type, value);
        }
        private double tempValue;
        public double TempValue
        {
            get => tempValue;
            set => SetProperty(ref tempValue, value);
        }
        private double convertedValue;
        public double ConvertedValue
        {
            get => convertedValue;
            set => SetProperty(ref convertedValue, value);
        }
        private DateTimeOffset createdAt = 
DateTimeOffset.Now.ToLocalTime();
        public DateTimeOffset CreatedAt
        {
            get => createdAt;
            set => SetProperty(ref createdAt, value);
        }
    }
    public enum TempType
    {
        Celsius, Fahrenheit
    }
}

Note that the ObservableObject class is imported to help with the auto-binding mentioned earlier. The rest of the model is very simple, with attributes that will bind to the view’s input fields.

The main page

The home page’s XAML code and the controller’s C# code is placed in MainPage.xaml.cs.

Start by opening the MainPage.xaml.cs file and substituting its contents by the following:

Listing 2. MainPage.xaml.cs code

using UnoSimpleTalk.Models;
using System;
using System.Collections.Generic;
using System.IO;
using System.Linq;
using System.Runtime.InteropServices.WindowsRuntime;
using Windows.Foundation;
using Windows.Foundation.Collections;
using Windows.UI;
using Windows.UI.Xaml;
using Windows.UI.Xaml.Controls;
using Windows.UI.Xaml.Controls.Primitives;
using Windows.UI.Xaml.Data;
using Windows.UI.Xaml.Input;
using Windows.UI.Xaml.Media;
using Windows.UI.Xaml.Navigation;
// The Blank Page item template is documented 
// at http://go.microsoft.com/fwlink/?LinkId=402352&clcid=0x409
namespace UnoSimpleTalk
{
    /// <summary>
    /// An empty page that can be used on its own or 
    /// navigated to within a Frame.
    /// </summary>
    public sealed partial class MainPage : Page
    {
        public static readonly DependencyProperty ItemProperty = 
            DependencyProperty.Register(nameof(Item), typeof(TempItem), 
            typeof(MainPage), new PropertyMetadata(default(TempItem)));
        public MainPage()
        {
            Item = new TempItem
            {
                Id = 1,
                Type = TempType.Celsius,
                TempValue = 23,
                CreatedAt = new DateTimeOffset(),
                ConvertedValue = (23 * 1.8) + 32
            };
            this.InitializeComponent();
        }
        public TempItem Item
        {
            get => (TempItem)GetValue(ItemProperty);
            set => SetValue(ItemProperty, value);
        }
        public TempType[] TempTypeList => new[]
        {
            TempType.Celsius,
            TempType.Fahrenheit
        };
        private void Calculate_Temp(object sender, RoutedEventArgs args)
        {
            switch (TempTypeBox.SelectedItem)
            {
                case TempType.Fahrenheit:
                    Item.ConvertedValue = (Item.TempValue * 1.8) + 32;
                    break;
                case TempType.Celsius:
                    Item.ConvertedValue = (Item.TempValue - 32) * 0.5556;
                    break;
            }
        }
        public string FormatTemperature(double temp) => 
                         $"{Math.Round(temp, 2)}ยบ";
    }
}

Chances are that your code shows some errors, like:

  • App does not contain a definition for InitializeComponent. If that happens, just ignore it for a while. Apparently, Uno has a bug to recognize this method before the first couple of builds. After some runs, and IDE restarts, you’ll see that the error disappears.
  • It can’t find TempTypeBox either. This also happens due to the lack of builds and runs, since VS needs to run the whole codebase first to generate the object links. Don’t worry; it won’t affect the execution on the device.

The first line of the class starts with a DependencyProperty object. In Uno, every time you want to make a controller object visible to the views, you need to expose it via this class. The first parameter refers to a name, the second is the property type, the third’s the owner of this object, and the last one relates to the metadata information to construct this object and make it injectable to the views.

Following it, you may find the constructor. It’s nothing special; it just initiates an item object to make sure the view will have something to show right after the startup.

The TempTypeList method is important because it provides the list of temperature scales for the combo that’ll be built in a few minutes. The Calculate_Temp method is the one which receives the click action to calculate the new temperature based on the form inputs. Finally, the FormatTemperature method helps with text formatting. It also rounds up the decimal places of the temperature value, since it is a double number.

Now, open the MainPage.xaml file and place the contents shown in Listing 3.

Listing 3. Mainpage.xaml code

<Page
    x:Class="     UnoSimpleTalk.MainPage"
    xmlns="http://schemas.microsoft.com/winfx/2006/xaml/presentation"
    xmlns:x="http://schemas.microsoft.com/winfx/2006/xaml"
    xmlns:local="using:App1"
    xmlns:d="http://schemas.microsoft.com/expression/blend/2008"
    xmlns:mc="http://schemas.openxmlformats.org/markup-compatibility/2006"
    mc:Ignorable="d">
    <Grid Background="{ThemeResource ApplicationPageBackgroundThemeBrush}" RowSpacing="8">
        <Grid.RowDefinitions>
            <RowDefinition Height="Auto" />
            <RowDefinition Height="Auto" />
            <RowDefinition Height="Auto" />
            <RowDefinition Height="Auto" />
            <RowDefinition Height="Auto" />
        </Grid.RowDefinitions>
        <TextBlock Text="Temperature Converter" 
            Grid.Row="0" 
            HorizontalTextAlignment="Center"
            HorizontalAlignment="Center"
            
            Margin="30"
            FontWeight="Bold" 
            FontSize="30"  />
        <TextBox Text="{x:Bind Item.TempValue,Mode=TwoWay}"
             AcceptsReturn="True"
             Grid.Row="1"
             Header="Temperature:"
             Margin="10,0"
             FontSize="20"
             PlaceholderText="Enter your temperature here" />
        <ComboBox x:Name="TempTypeBox"
            Header="Convert to:"
            Grid.Row="2"
            FontSize="20"
            Margin="10,0"
            ItemsSource="{x:Bind TempTypeList}"
            SelectedItem="{x:Bind Item.Type,Mode=TwoWay}"
            HorizontalAlignment="Stretch"
            />
        <Button Grid.Row="3" Click="Calculate_Temp" Margin="10,0" FontSize="20">Calculate</Button>
        <StackPanel Background="LightGray" Padding="20" Grid.Row="4" Margin="10,0">
            <TextBlock Text="Converted Temperature:" FontWeight="Bold" FontSize="26"  />
            <TextBlock Text="{x:Bind FormatTemperature(Item.ConvertedValue),Mode=OneWay}" FontWeight="Bold" FontSize="20" />
        </StackPanel>
    </Grid>
</Page>

You’re probably going to see a bunch of errors on this file. They happen because of Intellisense, the code-completion tool for XAML pages, is only supported when the UWP head is active. Make sure to select it as shown in Figure 11.
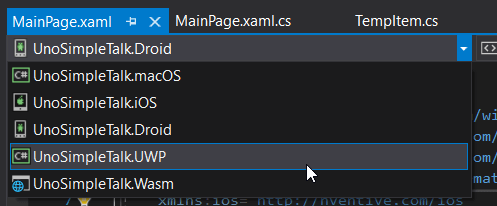
Figure 11. Selecting the UWP head.

If the error persists, try closing the XAML document as well as restarting VS.

Here, it’s being mounted a basic template for the view. Since every screen component must be stacked on top of each other within the Grid tag, you need first to define how this stacking must happen.

The Grid.RowDefinitions tag does exactly this. It sets the blank spaces in which the next components will be placed, one after another. The tags are very intuitive and self-explanatory. It also resembles the HTML tags, if you’re familiar with them.

Special attention goes to the x:Bind spread through the code. This represents the structure Uno uses to inform that there’s an injection going on there.

You also need to specify which binding mode you want:

  • TwoWay indicates that the binding happens back and fourthly
  • OneWay indicates that it only happens from views to classes

Testing the calculator

Well, this is it! Now, you can move on to the tests. Just hit the Android start button again, wait for the build to end, and check out the result on the emulator. Figure 12 shows how your app will look:
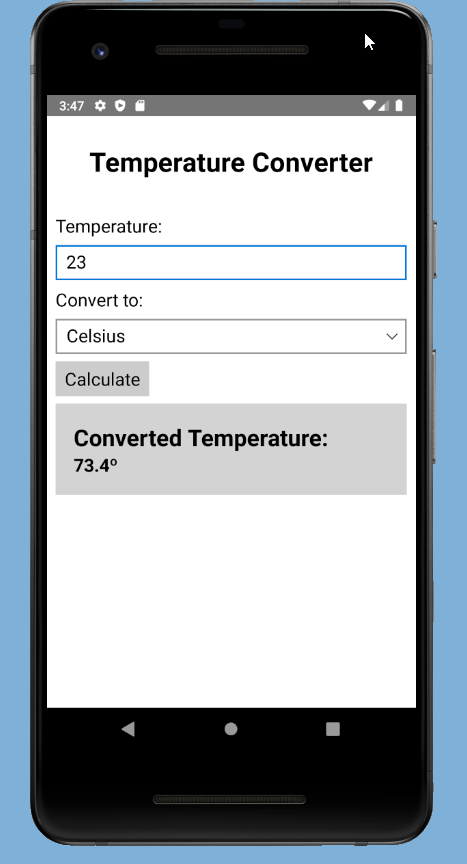
Figure 12. Temperature app on the Android device

You can also test it on other devices, like your own Windows (or in a built-in Windows simulator). Just remember that you’ll need to enable the developer mode of your Windows, as shown below.
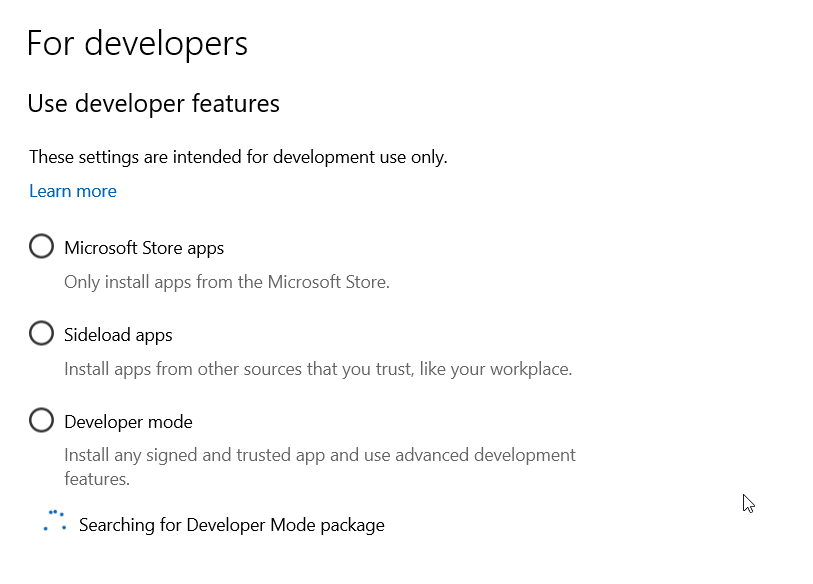
Figure 12. Enabling Developer Mode on Windows

Visual Studio will automatically open this configuration window for you when you try to run on this mode.

Conclusion

Even though the Uno platform is new compared to other, more mature players, it is very promising and powerful. Its community is growing and embracing more and more members all the time. Make sure to spend some time going over its GitHub repository and the official docs.

As homework, you can increment the sample to add more advanced features from the docs or even incorporate some of the available ones provided by the Uno Platform Code Samples page.


The post Building cross-platform apps with .NET and Uno appeared first on Simple Talk.


from Simple Talk https://ift.tt/37irawt
via

Monday, October 19, 2020

Exploring errors to reveal unauthorized information

Maintaining a secure environment is very hard. There are so many threats that can be exploited that it demands a specialized security team to continuously evaluate, monitor, and audit the many known and unknown threats. SQL Server is just another process that can be exploited and needs to be monitored. Still, since the database’s nature is to store information, including sensitive information, it is one of the main targets chosen by attackers.

In this article, I would like to show you a technique that can be used to reveal information that a user is not supposed to see and how to protect it. The technique is very simple, and it relies on SQL Server error messages to reveal information that could be stolen by adversaries. This technique has been used for several years in SQL Injection attacks, and many DBAs still overlook it.

The idea is simple; a non-privileged user can write a query referencing a SQL Server view that causes an exception, such as invalid conversion to be thrown during query processing if certain row values exist in the underlying tables. Depending on the query plan, these exceptions may bypass SQL Server permission validations and are thrown even if existing data cannot be retrieved through the view.

Before I move forward with recommendations, let’s understand the problem starting by looking at a simple example.

Note: I’m running all tests on Microsoft SQL Server 2017 (RTM-CU20) (KB4541283) – 14.0.3294.2 (X64) . Other versions may have different results.

A simple view-based row-level security

Before SQL Server 2016 and row-level-security, it was very difficult to implement restrictions on data at the row level. One of the most common solutions for this requirement is to use a view with a predicate filter used to reveal only the information a user has access.

For instance, consider the following scenario:

Create two user accounts that will demonstrate different access capabilities.

USE tempdb
GO
DROP USER IF EXISTS Manager
DROP USER IF EXISTS User1
CREATE USER Manager WITHOUT LOGIN  
CREATE USER User1 WITHOUT LOGIN  
GO

Create a table to hold test data.

DROP TABLE IF EXISTS TabSalary
CREATE TABLE TabSalary  
(  
    EmpID      INT,
    Employee   VARCHAR(10),  
    Salary     NUMERIC(8,2),
    HideSalary BIT
);
GO

Populate the table with four rows of data.

INSERT INTO TabSalary VALUES(1, 'Bob', 1000, 0), 
                            (2, 'Jonh', 5000, 0),
                            (3, 'Mark', 8000, 1),
                            (4, 'Robert', 9500, 1)
GO
-- 4 rows...
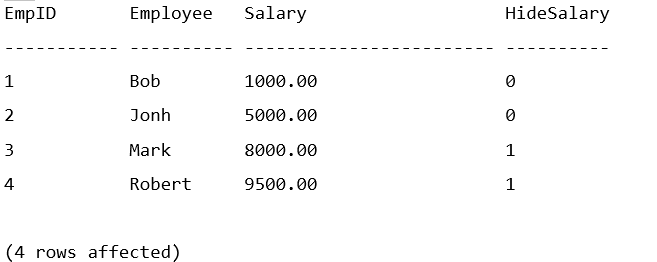
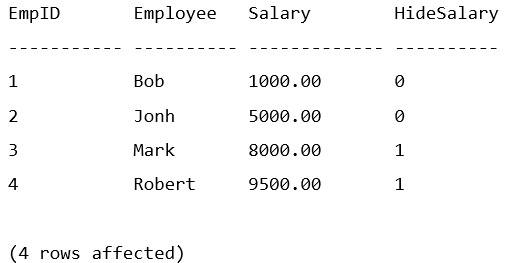
SELECT * FROM TabSalary
GO

A row-level security view controls which rows each user can see. For instance, the Manager user will be able to see all rows, while any other user will only see rows where HideSalary is equal to 0.

DROP VIEW IF EXISTS vw_LowSalary
GO
CREATE VIEW vw_LowSalary
AS
  SELECT EmpID, Employee, Salary FROM TabSalary
   WHERE (HideSalary = 0 OR USER_NAME() = 'Manager')
GO

Grant read access on the view to users.

GRANT SELECT ON vw_LowSalary TO Manager 
GRANT SELECT ON vw_LowSalary TO User1 
GO

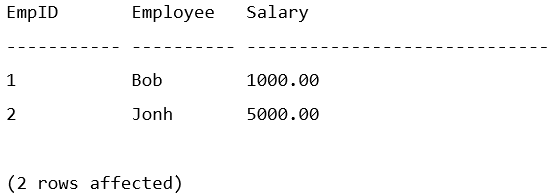
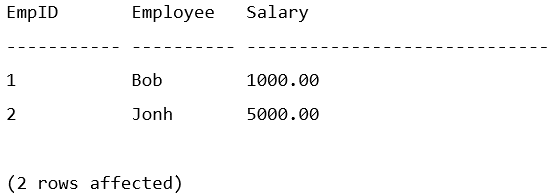
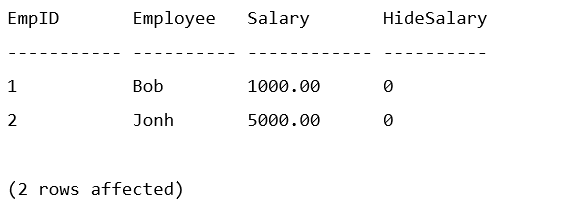
Now, if User1 tries to access the data, it will return the following:

EXECUTE AS USER = 'User1'
SELECT * FROM vw_LowSalary
GO
REVERT
GO

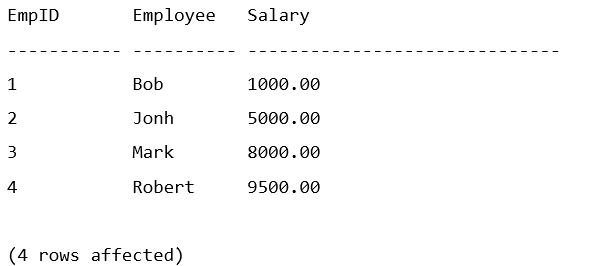
User Manager will have access to all rows:

EXECUTE AS USER = 'Manager'
SELECT * FROM vw_LowSalary
GO
REVERT
GO

The problem with this approach is that any user with read access to the view can write a carefully crafted query that uses an expression executed in a specific order by the query optimizer. This causes an information leak through the use of the exception error message.

For instance, if a query that attempts to convert the Employee column to an Integer, it returns the following message:

EXECUTE AS USER = 'User1'
SELECT * FROM vw_LowSalary
WHERE CONVERT(INT, Employee) = 1
GO
REVERT
GO

Bob is a name that User1 could already access, so there is no “leaked information” here. But what about a query that ignores employees Bob and Jonh that User1 can already access?

EXECUTE AS USER = 'User1'
SELECT * FROM vw_LowSalary
WHERE Employee NOT IN ('Bob', 'Jonh')
  AND CONVERT(INT, Employee) = 1
GO
REVERT
GO

User1 shouldn’t be able to see Mark’s row, right? How can User1 see Marks salary information? Easy, just change the query to convert the salary column.

EXECUTE AS USER = 'User1'
SELECT * FROM vw_LowSalary
WHERE Employee NOT IN ('Bob', 'Jonh')
  AND CONVERT(INT, CONVERT(VARCHAR, Salary)) = 0
GO
REVERT
GO

As you can see, even though there is a security predicate in place to prevent a malicious user from directly querying other people’s salary, User1 was able to determine the data by running a query that returns a SQL Server error message to leak the data.

Note: To leak the correct information, you need to make sure that the query processor is evaluating the expression in the correct order. Otherwise, it would first try to convert the data in the row the user already has access to and not leak the desired data. The query optimizer will have to create a plan that is pushing the predicate down to the table access. Look at the execution plan of the query to confirm the expression evaluation order. If necessary, you may need to force a short-circuit using a CASE expression.

Row-level security in SQL Server 2016 was introduced to address this problem. Well, kind of. Considering the same scenario, you would need to do the following:

The first step is to create a function with the predicate that will be used in a security policy.

DROP SECURITY POLICY IF EXISTS SalaryFilter
GO
DROP FUNCTION IF EXISTS dbo.fn_SecurityPredicate
GO
CREATE FUNCTION dbo.fn_SecurityPredicate(@HideSalary CHAR(1))  
RETURNS TABLE  
WITH SCHEMABINDING  
AS  
  RETURN SELECT 1 AS fn_securitypredicate_result
          WHERE (@HideSalary = 0 OR USER_NAME() = 'Manager');  
GO

Create a security policy on table TabSalary.

CREATE SECURITY POLICY SalaryFilter
ADD FILTER PREDICATE dbo.fn_SecurityPredicate(HideSalary)
ON dbo.TabSalary
WITH (STATE = ON); 
GO

Grant access to table TabSalary to users.

GRANT SELECT ON TabSalary TO Manager;  
GRANT SELECT ON TabSalary TO User1;  
GO

Just like when using the view, User1 only has access to employees “Bob” and “Jonh”.

EXECUTE AS USER = 'User1'
SELECT * FROM TabSalary
GO
REVERT
GO

The user Manager can see all rows.

EXECUTE AS USER = 'Manager'
SELECT * FROM TabSalary
GO
REVERT
GO

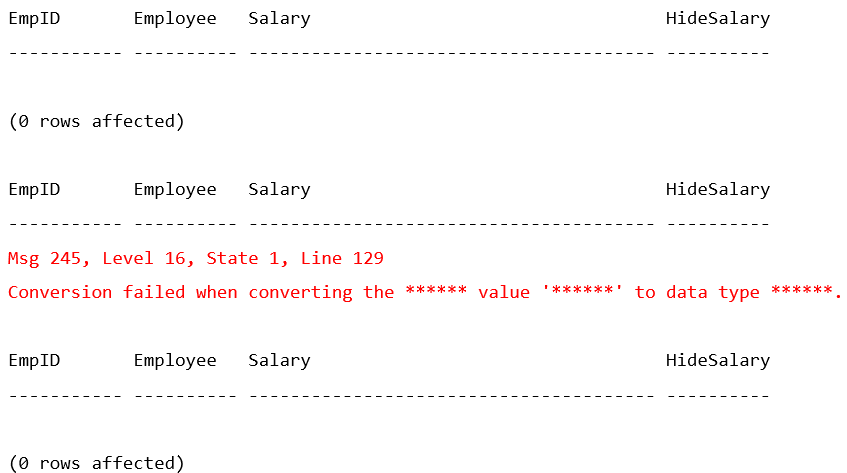
Here is the main difference between the view-based solution and the row-level security feature. If User1 tries to run the implicit conversion query, the query will return the following error message:

EXECUTE AS USER = 'User1'
SELECT * FROM TabSalary
WHERE Employee NOT IN ('Bob', 'Jonh')
  AND CONVERT(INT, CONVERT(VARCHAR, Employee)) = 0
GO
REVERT
GO

As you can see, the data is masked. Because the query failed, the attacker can still infer that there are more rows in the underlying data. They can even write a query to identify the salary value, but it will be more difficult, and the data will never be leaked to the user screen. A query to infer the salary would be something like:

EXECUTE AS USER = 'User1'
GO
SELECT * FROM TabSalary
WHERE Employee NOT IN ('Bob', 'Jonh')
  AND Salary = 7999
  AND CONVERT(INT, CONVERT(VARCHAR, Employee)) = 0
GO
SELECT * FROM TabSalary
WHERE Employee NOT IN ('Bob', 'Jonh')
  AND Salary = 8000
  AND CONVERT(INT, CONVERT(VARCHAR, Employee)) = 0
GO
SELECT * FROM TabSalary
WHERE Employee NOT IN ('Bob', 'Jonh')
  AND Salary = 8001
  AND CONVERT(INT, CONVERT(VARCHAR, Employee)) = 0
GO
REVERT
GO

As you can see, a user could write a query in a loop to test a range of values and infer that a value exists. It is limited information, but in some scenarios, this could be a security problem.

Some recommendations to minimize the risk:

  • Consider using the row-level security feature to minimize the information exposed to the attacker.
  • View-based level security should not be used as an isolated measure to fully secure sensitive data from users running ad-hoc queries on the database. It is appropriate for preventing sensitive data exposure but will not protect against malicious users trying to infer or reveal the underlying data.
  • Any SQL Server or associated application providing too much information in error messages on the screen or printout risks compromising the data and security of the system. The structure and content of error messages need to be carefully considered by the organization and development team.
    • Databases can inadvertently provide a wealth of information to an attacker through improperly handled error messages. In addition to sensitive business or personal information, database errors can provide hostnames, IP addresses, user names, and other system information not required for end-user troubleshooting but very useful to someone targeting the system.
  • Detailed error messages must be visible only to those who are authorized to view them. General users must receive only generalized acknowledgments that errors have occurred. These generalized messages must appear only when relevant to the user’s task.
  • Configure audit logging, tracing or custom code in the database or application to record detailed error messages generated by SQL Server for review by authorized personnel.
  • Consider enabling trace flag 3625 to mask certain system-level error information returned to non-administrative users.
  • Inspect application source code, which will require collaboration with the application developers. It is recognized that, in many cases, the database administrator (DBA) is organizationally separate from the application developers and may have limited, if any, access to source code. Nevertheless, protections of this type are so important to the secure operation of databases that they must not be ignored. At a minimum, the DBA must attempt to obtain assurances from the development organization that this issue has been addressed and must document what has been discovered.

Final thoughts

It is important to understand that this approach to secure data using row level views is not very safe. Any arbitrary T-SQL and access to all views (including system views) should be limited should be limited to only specific users.

One other thing I like to do in my environments is to get rid of the any permissions granted to “public” role. You know, by default, SQL Server system objects have permissions granted to public. That means any login will automatically have access to those tables. But do they really need it? I don’t think so. Of course, you’ll have to test it to confirm, but many applications never use system objects. You may want to remove public access to all system objects. Following is a link with a Microsoft article that will help you with that: https://techcommunity.microsoft.com/t5/sql-server/remove-public-and-guest-permissions/ba-p/383594

Sensitive environments require special attention to many things, including application users that may look harmless. Remember, most attacks come from inside; that means any user that already has access to the system should be limited to do only what is intended to do and nothing else. Deny everything and grant access as you go (developers will hate me for that ๐Ÿ˜Š).

It would be nice if there were an option on SQL Server to limit the information returned in an error message. In my opinion, this is the primary security issue here which has been exploited for many years with SQL Injection. Something like TF3625 “Limits the amount of information returned to users who are not members of the sysadmin fixed server role, by masking the parameters of some error messages using ‘******’. This can help prevent disclosure of sensitive information.”.

Am I too cautious? What do you think?


The post Exploring errors to reveal unauthorized information appeared first on Simple Talk.


from Simple Talk https://ift.tt/31nJZKS
via

US Insurance Industry Data Security Regulations

Over the past few years, several new regulations regarding the privacy of data have been enacted. Many of these, such as the GDPR (General Data Protection Regulation) and CCPA (California Consumer Privacy Act) cover private data based on citizenship. The GDPR, for example, protects the data of European citizens regardless of where the holder of the data is doing business. These regulations come with steep fines when violated, so it is critical for organisations to comply.

HIPAA (Health Insurance Portability and Accountability Act) protects the health information of patients in the US. This law was enacted in 1996, and most people are somewhat familiar with it due to the forms they sign when receiving care. For the insurance industry that falls outside HIPAA, the National Association of Insurance Commissioners (NAIC) adopted a model law that they recommend be implemented by all US states. At the time of this writing, eleven states have enacted a version of the law. Because the insurance industry collects so much information from its customers, these organizations are often victims of data breaches and this is one of the reasons for the model law.

If this law affects, or potentially affects, your organization, what do you need to think about? This article from The National Law Review states:

‘Under the Model Law, licensees must maintain a comprehensive, written “Information Security Program.” The Program should be commensurate with the size and complexity of the licensee, the nature and scope of the licensee’s activities, including its use of third-party service providers, and the sensitivity of the nonpublic information collected, processed, and maintained by the licensee. The Program also must be based on a risk assessment and contain administrative, technical, and physical safeguards. In short, the Program cannot be an “off-the-shelf” set of policies and procedures.’

This means that you must have written policies in place governing how sensitive data is stored and processed throughout the organization. One of the first steps is knowing just what information you hold that is impacted by the law. Classifying data can be an arduous task, so having a tool in place that can automate some of the work for you is essential.

It’s not just critical to protect live production data. You must protect data wherever it lands. For example, backup files can be as much of a risk as the live data if not protected with encryption and file security.

What about copies of production for development, quality assurance, testing, and all the downstream activities? Of course, test data could be generated for these non-production databases, but that doesn’t always help when you need data that matches production in volume and granularity. Data that is classified as sensitive must be sanitized before it reaches these non-production environments. It’s easy to forget that there is as much or more of a chance that data will be compromised outside of production than in it.

Redgate have solutions that can assist with classifying and masking data that can help you comply with this and other regulations. Redgate Data Catalog takes care of up to 70% of the work of classifying SQL Server database columns by making suggestions based on column names and bulk actions. It allows you to control the taxonomy to fit your organisation and the regulations that apply to it. Data Catalog can also be fully automated with a REST API and PowerShell cmdlets.

Redgate’s Data Masker masks sensitive data with realistic substitute data. It’s fully integrated with Data Catalog so that once the work of classifying data is done, it’s easy to mask that data for downstream environments. You can automate masking with PowerShell or take advantage of the easy to use interface.

Based on the current trends, your organization is likely to be affected by one or more regulations requiring that you protect your customers sensitive information. Redgate have the tools to help!


The post US Insurance Industry Data Security Regulations appeared first on Simple Talk.


from Simple Talk https://ift.tt/34bVhU9
via

Monday, October 12, 2020

Deploy Data Factory from GIT to Azure with ARM Template

You may have noticed the export feature on Azure resource groups don’t like too much the Data Factory. We can’t completely export a Data Factory as an ARM template, it fails.

Probably you know you don’t need to care about this too much. You can link the data factory with a github repo and get source code versioning control. The versioning control is, after all, even better than a simple export to an ARM template.

Even so, we will still need an ARM template to deploy this data factory to another azure environment when we would like so. The good news is this template is not only easy, but absolutely the same for any data factory we would like, because it just need to point to a github repo and all the data factory code will come from there.

The main part of the ARM template is the resource definition and the secret of the data factory resource definition is how to define a data factory already linked with github. Take a look:

{
   "resources": [
      {
         "type": "Microsoft.DataFactory/factories",
         "apiVersion": "[parameters('apiVersion')]",
         "name": "[parameters('name')]",
         "location": "[parameters('location')]",
         "identity": {
            "type": "SystemAssigned"
         },
         "properties": {
            "repoConfiguration": "[variables('repoConfiguration')]"
         }
      }
   ]
}

It’s a regular resource definition, except by the properties: That’s the secret. We set the property repoConfiguration to an array with all github configurations needed for the data factory.

As you may notice, this property is making reference to a variable. As a result, we need to set this variable before the resources element.

{
   "variables": {
      "repoConfiguration": {
         "type": "FactoryVSTSConfiguration",
         "accountName": "[parameters('gitAccountName')]",
         "repositoryName": "[parameters('gitRepositoryName')]",
         "collaborationBranch": "[parameters('gitBranchName')]",
         "rootFolder": "[parameters('gitRootFolder')]",
         "projectName": "[parameters('gitProjectName')]"
      }
   }
}

All the github configuration properties are parameterized. Therefore, when deploying a data factory we will only this same ARM template and fill the parameters values.

The final ARM template will be this:

{
   "$schema": "https://schema.management.azure.com/schemas/2015-01-01/deploymentTemplate.json#",
   "contentVersion": "1.0.0.0",
   "parameters": {
      "name": {
         "defaultValue": "myv2datafactory",
         "type": "String"
      },
      "location": {
         "defaultValue": "East US",
         "type": "String"
      },
      "apiVersion": {
         "defaultValue": "2018-06-01",
         "type": "String"
      },
      "gitAccountName": {
         "type": "String"
      },
      "gitRepositoryName": {
         "type": "String"
      },
      "gitBranchName": {
         "defaultValue": "master",
         "type": "String"
      },
      "gitRootFolder": {
         "defaultValue": "/",
         "type": "String"
      },
      "gitProjectName": {
         "type": "String"
      }
   },
   "variables": {
      "repoConfiguration": {
         "type": "FactoryVSTSConfiguration",
         "accountName": "[parameters('gitAccountName')]",
         "repositoryName": "[parameters('gitRepositoryName')]",
         "collaborationBranch": "[parameters('gitBranchName')]",
         "rootFolder": "[parameters('gitRootFolder')]",
         "projectName": "[parameters('gitProjectName')]"
      }
   },
   "resources": [
      {
         "type": "Microsoft.DataFactory/factories",
         "apiVersion": "[parameters('apiVersion')]",
         "name": "[parameters('name')]",
         "location": "[parameters('location')]",
         "identity": {
            "type": "SystemAssigned"
         },
         "properties": {
            "repoConfiguration": "[variables('repoConfiguration')]"
         }
      }
   ]
}


The post Deploy Data Factory from GIT to Azure with ARM Template appeared first on Simple Talk.


from Simple Talk https://ift.tt/2GWUVro
via

Wednesday, October 7, 2020

What is database continuous integration?

Continuous Integration (CI) is an essential step of application development for DevOps organisations. Whenever a developer commits code, a build is kicked off. The code must compile and pass automated testing before it is merged into the main branch. Developers have been working this way for years, but including the database in CI has lagged behind. Leaving the database out of CI has caused it to become the bottleneck that slows down the delivery of new features. Even though it’s more difficult to execute, many organizations have successfully implemented database CI with the right tools.

The purpose of Database CI is exactly the same as for application CI. The development team establish a working version of the database very early in the development cycle, and then continue to verify regularly that it remains in a working state as they expand and refactor the schema and database code objects. Developers integrate new and changed code into a shared version control repository several times a day. Development proceeds in small steps. Developers first write the tests that, if passed, will prove that a small new piece of functionality works. They then implement the code to make the tests pass. When the tests pass, they commit the code to “trunk” in the shared VCS, and their “commit tests” are added to the broader suite of tests for the application. Each commit, or check-in, is then verified by an automated database build or migration, and subsequent testing, allowing teams to detect problems early.

Where do you start with database CI? There are several requirements outlined here.

Maintain the database in version control

The first prerequisite for Database CI is that the source of “truth” for the database CI process and all subsequent database deployments must be the build and migration scripts in a version control system (VCS), such as Git or Subversion. In other words, the database CI process must always be triggered from the VCS. There must be no ad-hoc builds or database modifications that bypass this formal process.

There are several CI management software services available. Each one I’ve worked with has hooks into various version control systems. With these hooks you can set up mechanisms for automating your database CI processes.

Automate database builds

Before you attempt database CI, you should already to be able to automate a build of your database from the command line (i.e. separately from your CI system), using a set of DDL scripts stored in the VCS. A well-documented build script for every object makes it very easy for the team to see the exact state of an object at any given time, and to understand how changes to that object are likely to affect other objects. I recommend getting a complete build of an empty database set up as soon as you have your database moved into version control. There are a number of reasons for this:

  • It provides you with information on the effectiveness of your database version control implementation
  • You can immediately identify gaps, such as missing objects, in your version control management
  • You get feedback on your ability to build your database out of source control

Once you’ve established independently that you can successfully build a database from scratch, from its component scripts, then triggering an automated database build through your CI process, in response to database modifications, is a great first step on the road to database CI.

Commit early and frequently

The idea of database CI is to have a fast and continuous set of validations of your database changes, so my general advice is integrate like you’re voting in Chicago: early and often (an old joke; you’re only supposed to vote once per election). In other words, rather than hold onto functionality for days or even weeks while you’re working on it, segment the work into discrete sets of changes, such as just one stored procedure, or just the changes necessary to modify a single table, and commit those changes into version control as often as possible. Ideally, you’ll have a “commit-based database CI” process set up that builds a new database, and runs basic tests, on each commit of a database change. Even if this isn’t achievable, you’ll still want to perform as many successful integrations of your database changes as possible. You’ll then have the benefit of integrating each small change as you work on it, rather than have a single massive set of code to integrate, which is likely to result in multiple failures.

One proviso, of course, is that you should only ever commit a database change to version control after you’ve validated that it’s working on your development machine, via unit testing. If you don’t know if the code is working, don’t commit it into version control. You’re likely to cause the database CI process to fail, but even worse, you might be supplying broken code to other developers.

Isolate the CI server environment

The CI Server should be running the same version of your DBMS as production, on a machine with no other service on it, and with restricted logins. Don’t run your database CI processes on a server that also runs additional services, or where people are attempting to get other work done. Your CI processes are likely to eat server resources, as they drop and recreate databases, load data, run tests, and so on. If you then add in the need to have this process for more than one development team, for more than one database or set of databases, all this points to the requirement for an isolated environment.

An isolated environment helps ensure that CI testing doesn’t interfere with the work of others. Isolation also ensures that failures are related either to the CI process itself, or problems in the code you’ve modified within version control. Build or migration failures within the CI process should not be caused because someone was mistakenly reading data from the CI database or attempting to run code manually against the CI database. These types of false negatives will not help you improve your CI process or the quality of your code.

Choose a CI server

While it is possible to build your own CI server process, it’s a lot of work. Unless you have specialized requirements, it will likely be easier to take advantage of an established CI Server such as Jenkins, AWS DeveloperTools, TeamCity, or Azure DevOps.

Each of these CI servers offers specialist functionality that that may make one of them more attractive than another, within your environment. Plan for an evaluation period to test two or more of these servers in order to identify the one that works best for you.

At a minimum, your CI Server process should:

  • Integrate with your version control environment – including the ability to deal with labels, branching and versions
  • Allow granular control over the workflow that determines how the database is built – the order in which actions occur, and the ability to add additional functions such as calls to tests
  • Maintain a record of builds – in order to know the success or failure of any given run
  • Offer connectivity to email and other alerting mechanisms – so that when the process is fully automated, you can get reports on the successful or unsuccessful builds

Build a testing framework

Every time a developer commits a database change to the VCS, we will want to trigger a database CI process that performs a build and runs a small suite of tests to ensure the basic behavior of the database structure and code. For our nightly integration builds, we’ll run more extensive integration and acceptance tests with a realistic data load. These tests need to relay information back to the build server; probably via NUnit-style XML output, which any modern CI solution can understand.

Depending on the DBMS you’re using and the language in which you’re programming, you may have varying levels of testing frameworks available. Research your DBMS to track these down.

Employ a bug-tracking, workflow, and messaging system

Failed builds and integrations must be written to issue tracking system with as much detail as possible regarding the potential cause. The issue tracking system should be closely integrated with a VCS, and an associated workflow system, such as that available through Azure DevOps, to allow the team to manage and assign issues quickly and efficiently.

For example, we should never issue further commits on a broken build, for reasons we discussed earlier in this article, so a typical workflow might, in response to a failed build, put the VCS into a “locked” state that will prevent checking in any more work. The issue will be assigned to a developer, whose task is to check in a fix that resolves the issue as quickly as possible and returns the VCS to an “unlocked” state. The team will also need a developer messaging system such as Slack or Gitter, to receive instant notification of build issues.

Conclusion

The ability to automate testing early in your development process clearly applies as much to databases as it does any other code or architecture within your system. To make this happen, you will have to get your database into a source control system and create the automation necessary to leverage that system. However, as we’ve shown here, these various processes can be put together in support of your needs for your own Continuous Integration process, even on your databases.

NOTE:  If you like this, you may also be interested in Why is database continuous integration important?

The post What is database continuous integration? appeared first on Simple Talk.


from Simple Talk https://ift.tt/33Iv1Rn
via

Tuesday, October 6, 2020

Storage 101: Monitoring storage metrics

The series so far:

  1. Storage 101: Welcome to the Wonderful World of Storage
  2. Storage 101: The Language of Storage
  3. Storage 101: Understanding the Hard-Disk Drive 
  4. Storage 101: Understanding the NAND Flash Solid State Drive
  5. Storage 101: Data Center Storage Configurations
  6. Storage 101: Modern Storage Technologies
  7. Storage 101: Convergence and Composability 
  8. Storage 101: Cloud Storage
  9. Storage 101: Data Security and Privacy 
  10. Storage 101: The Future of Storage
  11. Storage 101: Monitoring storage metrics

High-performing applications such as advanced analytics or relational database systems require fast and reliable storage to accommodate their data needs. IT teams must ensure that the storage systems supporting the applications can maintain the required performance and availability thresholds to meet these demands. For this, engineers must continuously monitor their storage systems to identify issues before they become serious problems.

Monitoring offers an effective strategy for getting at an issue’s root cause as soon as it surfaces, providing both real-time and historical insights into storage activity. Engineers can use this information to identify potential problem areas and misallocated resources as well as proactively tune storage to deliver better performance.

IT teams often use tools such as ManageEngine OpManager to monitor their storage systems. DBA teams may also monitor storage with tools like Redgate’s SQL Monitor. Not only do these products enable IT to track performance statistics such as latency and throughput, but they also offer more advanced features for managing storage infrastructure. For example, OpManager provides extensive built-in reporting capabilities, including storage growth trend graphs, and SQL Monitor can correlate utilization spikes to SQL Server queries and waits.

Despite these features, engineers must still be able to get at the basic storage metrics to understand how their systems are performing. Without this information, most other features provide little value. Metrics are at the heart of what makes storage monitoring work and what it takes to provide storage systems that deliver optimal performance.

Tracking Storage Metrics

When monitoring storage systems, engineers should track a variety of metrics to ensure the systems continue to meet application requirements. Three of the most important and commonly cited metrics are latency, I/O operations per second (IOPS), and throughput. In addition to these three, queue length and I/O splitting can also provide valuable insights into storage performance.

In this article, I discuss all five of these metrics and demonstrate them in action. Despite my focus on these five, they’re not the only important metrics to monitor. For example, engineers should also track storage capacity, device cache usage, controller operations, and storage networks. Even seemingly unrelated components can be a factor, such as low CPU utilization, which can indicate that the processor is waiting on storage to complete requests from the application.

For this article, I’ve limited my discussion to latency, IOPS, throughput, queue length, and I/O splitting just to maintain a reasonable scope. To demonstrate these metrics, I used Microsoft’s new Performance Monitor, which is part of Windows Admin Center version 1910. Although the tool is still in preview, I thought it would be a fun change from the old Performance Monitor, which has been around for over 25 years. You can find information about the new Performance Monitor and where to download it in the blog post Introducing the new Performance Monitor for Windows.

To show these metrics in action, I used the following T-SQL script to run a limited test load against a local instance of SQL Server:

DROP TABLE IF EXISTS Orders;
GO
CREATE TABLE Orders(
  ItemID int IDENTITY PRIMARY KEY,
  ItemName nvarchar(50) NOT NULL,
  ItemDescription nvarchar(250) NOT NULL,
  Quantity int NOT NULL,
  Price decimal(18, 2) NOT NULL);
GO
INSERT INTO Orders 
  (ItemName, ItemDescription, Quantity, Price)
VALUES('short product name', 
  'longer more detailed product information', 10, 100.00);
GO 20000
SELECT ItemID, ItemDescription, Quantity, Price FROM Orders;

The script creates a simple table, inserts the same data 20,000 times, and then retrieves the data from the table. I used the GO operator to run the INSERT statement repeatedly.

I realize that there are more elegant ways to generate a load, but I wanted to keep things simple in order to focus on the metrics themselves. Besides, I ran the tests on my laptop’s local solid-state drive (SSD), which connects via a Serial AT Attachment (SATA) interface. This is hardly a production-like simulation. Even so, the examples should give you a sense of what to look for in terms of performance metrics. This also makes it easy for you to try them out on your own system, assuming you have SQL Server installed. Even if you don’t, you can still test these metrics to see what you get.

Monitoring Latency

Latency refers to how long it takes for an application’s I/O requests to be completed. It is the time between when the application issues a request and when it receives a response. The lower the response time, the better.

Several factors can impact latency. For example, if a storage device cannot meet workload demands, I/O requests can start piling up in the queue and slowing down response times. Latency can also be affected by storage capacities, storage protocols, network bottlenecks, device types, number of concurrent operations, and workload types. For instance, a hard-disk drive (HDD) can handle sequential reads more efficiently than random reads because there is less platter and head movement, resulting in lower latency.

The size of the I/O request can also affect latency, with larger sizes tending toward higher latency. Performance Monitor provides several counters for finding the average I/O size if you’re not sure what it is:

  • Avg. Disk Bytes/Read: Average I/O size for read operations.
  • Avg. Disk Bytes/Write: Average I/O size for write operations.
  • Avg. Disk Bytes/Transfer: Average I/O size for read and write operations.

After I enabled these counters on my system, I ran the example T-SQL script. Performance Monitor reported an average I/O size of around 4 KB, which is very low. As a result, I/O size is not likely to contribute to latency for this workload when running on my system.

Applications such as database systems are particularly sensitive to latency issues, which is why latency can be such an important metric to measure. Performance Monitor provides several counters for measuring latency:

  • Avg. Disk sec/Read: Average number of seconds to read data from the disk.
  • Avg. Disk sec/Write: Average number of seconds to write data to the disk.
  • Avg. Disk sec/Transfer: Average number of seconds to read and write data on the disk.

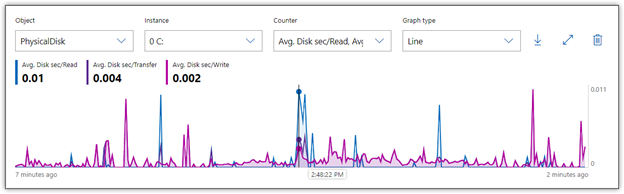
After I added the counters to Performance Monitor, I ran each statement in my T-SQL script. Figure 1 shows the average latency during those operations, taken at one-second intervals. Nearly all the activity is from the INSERT statement, with latency peaking at about 0.011 seconds, or 11 milliseconds (ms).

A screenshot of a cell phone screen with text Description automatically generated

Figure 1. Monitoring latency on a local storage disk

In the figure, the horizontal axis is placed on one of the highest read times, so the statistics near the top left corner of the graph reflect that specific moment. For both read and write operations, a single I/O request never exceeded 11 ms, and most were much lower, averaging closer to 2 or 3 ms. In addition, there was also no indication of gradually increasing latency, which can sometimes occur when storage can’t keep up with the workload.

Of course, I ran this test against a consumer-grade SSD running a simple operation. A real-world enterprise environment will likely show much different results. According to most recommendations, if the average latency consistently exceeds 25 ms, you’ve got a performance problem. I would argue that if you’re running a high-end all-flash array and your latency regularly exceeds 1 ms, you might still have a latency problem.

Monitoring IOPS

Vendors routinely cite a drive’s IOPS as one of its main selling points, and certainly, much attention is given to how IOPS compare from one drive to the next. But a drive seldom comes close to delivering what’s listed in the original specifications. In addition, IOPS should always be considered in relation to other factors, particularly latency and I/O size, as well as drive type (SSD vs. HDD) and workload type (read vs. write, random vs. sequential).

Measuring IOPS will give you the rate of I/O operations per second that the storage system is currently delivering, but IOPS alone does not tell the entire story. For example, a disk might be able to deliver faster IOPS, but the size of the I/O requests coming from an application might be small, reducing the overall throughput. Or a storage drive might be able to deliver outstanding IOPS, but the latency might also be exceptionally high, resulting in poorer performance.

Characteristics specific to a drive type can also play a role. For instance, HDDs with faster rotational speeds can usually deliver more IOPS and lower latency. In addition, factors such as RAID configurations or number of disks in an array can also impact IOPS.

Performance Monitor provides several counters for measuring IOPS:

  • Disk Reads/sec: Number of read IOPS.
  • Disk Writes/sec: Number of write IOPS.
  • Disk Transfers/sec: Number of read and write IOPS.

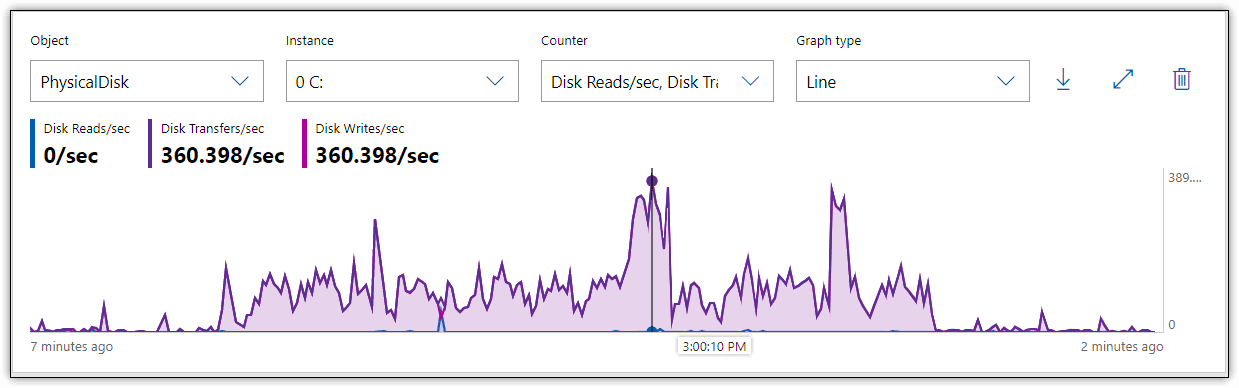
After I enabled these counters on my system, I reran the T-SQL statements. Figure 2 shows the results in Performance Monitor, which indicate that write operations barely reached 360 IOPS and were generally much lower.

A screenshot of a cell phone screen with text Description automatically generated

Figure 2. Monitoring IOPS on a local storage disk

For an SSD, even of the consumer variety, these are fairly low IOPS. Although the decent latency helps improve the performance picture, it doesn’t explain the lower number of operations, which can be the result of several factors. For example, the SSD is at near capacity, which can impact write performance. In addition, outside circumstances might contribute to lower IOPS, such as operating system background tasks. All of these possibilities point to the challenge of relying on IOPS alone to uncover potential performance issues, which is why this metric should be viewed as only one piece in a much larger puzzle.

Monitoring Throughput

Throughput refers to the amount of data that can be written to or read from a storage drive within a given time interval. Also referred to as transfer rate, throughput measures how much data is being transmitted during read and write operations. Throughput can be impacted by such factors as network speeds, interfaces, storage protocols, drive capacities, and workload types. Throughput is generally more relevant to sequential workloads than random.

The terms throughput and bandwidth are sometimes used interchangeably, but they mean two different things. Bandwidth refers to the theoretical maximum transfer rate that a storage system can support, and bandwidth refers to the actual amount of data that is being transferred to and from the storage device. When monitoring performance, actual amounts are always the top concern.

Performance Monitor provides several counters for measuring throughput:

  • Disk Read Bytes/sec: Number of bytes transferred per second during read operations.
  • Disk Write Bytes/sec: Number of bytes transferred per second during write operations.
  • Disk Bytes/sec: Number of bytes transferred per second during read or write operations.

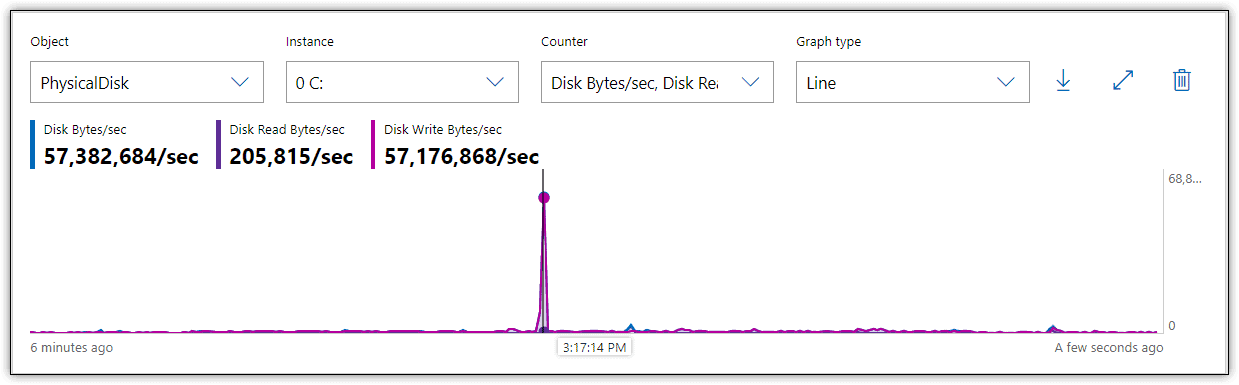
Figure 3 shows the results I received in Performance Monitor when I reran the T-SQL statements, with these three metrics enabled.

Graphical user interface Description automatically generated

Figure 3. Monitoring throughput on a local storage disk

During the insert operation, there was a spike in write throughput to about 57 MB/sec, but most of the time throughput hovered around 2 MB/sec, far below what a SATA flash drive should be able to achieve. However, throughput is directly related to IOPS and I/O request size. In fact, it’s often calculated as IOPS multiplied by I/O size. Given that both my IOPS and I/O size are low, it’s no surprise that throughput is also low.

Monitoring Queue Length

The queue length indicates the average number of I/O requests that are waiting to be read from or written to disk during the sampled interval. Although some queuing is expected, too many waiting requests can lead to higher latency, which can steadily increase with the number of queued requests. That said, if the numbers seem high, but latency remains low, the storage system might be efficient at emptying the queue quickly, in which case, the queue length is probably not an issue.

Performance Monitor includes several counters specific to the queue length:

  • Avg. Disk Read Queue Length: Average number of read I/O requests in the queue.
  • Avg. Disk Write Queue Length: Average number of write I/O requests in the queue.
  • Avg. Disk Queue Length: Average number of read and write I/O requests in the queue.

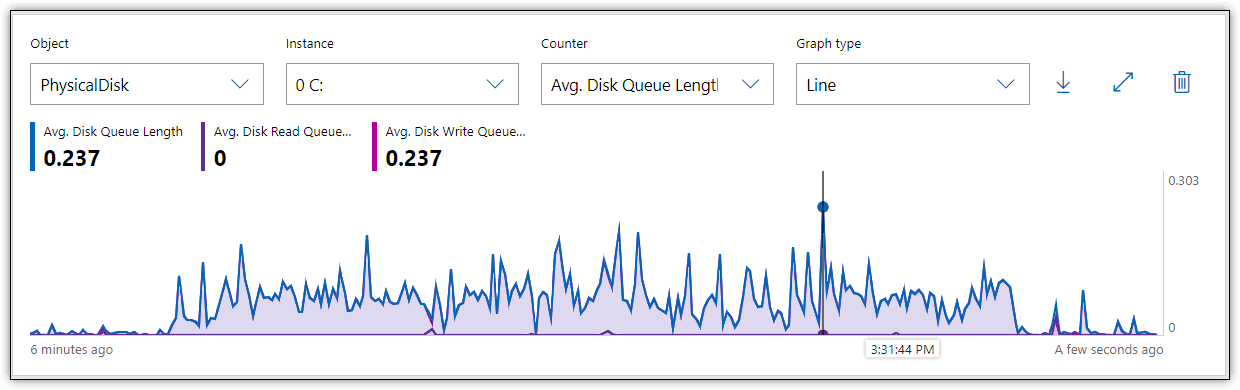
Figure 4 shows the results I received in Performance Monitor when I reran the T-SQL statements and monitored for queuing activity. As with the other examples, the primary activity is in writing the data.

A screenshot of a cell phone screen with text Description automatically generated

Figure 4. Monitoring queue length on a local storage disk

In this case, the queue length average remained well below 1 throughout the entire process. The general recommendation is that the average queue length should remain below 2 or 3 per disk. For example, a five-disk array should theoretically not exceed 10 queued requests on average. However, this might not be a realistic limit with SSDs, which are noted for their ability to handle I/O requests in parallel, making a higher queue rate more acceptable. As with most metrics, queue length should be considered only in relation to other variables.

Monitoring I/O Splitting

In some cases, I/O requests must be split into multiple requests in order to write the data to disk. This can occur because the disk is too fragmented to store the data contiguously or because the application is issuing I/O requests that are too large to process as single requests. In either case, performance can suffer.

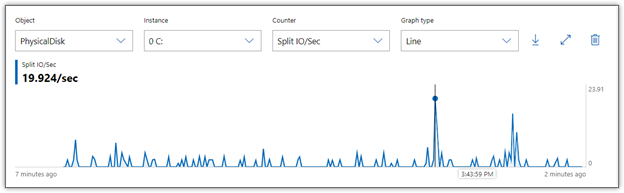
Performance Monitor includes one counter for measuring I/O splitting, Split IO/Sec, which provides the number of I/O requests per second that were split into multiple requests. When I ran the T-SQL statement with this counter enabled, Performance Monitor showed that I had a couple of spikes in the numbers, but for the most part, they remained relatively low, as shown in Figure 5.

Graphical user interface, text, application, website Description automatically generated

Figure 5. Monitoring I/O splitting on a local storage disk

The I/O splitting peaked out at about 20 in a couple places, but generally hovered between 0 and 5. However, any splitting can impact performance, and the closer you come to no splitting, the better. If splitting grows too out-of-control, latency will start to climb. Worse still, systems might freeze up or data might become corrupted.

Monitoring for the Bigger Picture

Storage metrics are connected to each other and should never be viewed in isolation. You must look at them as a whole to get the complete picture. IT teams that take steps to address one metric, without considering others, can make performance worse. For example, developers might update an application to increase I/O sizes for better throughput, but that could also result in higher latency and I/O splitting.

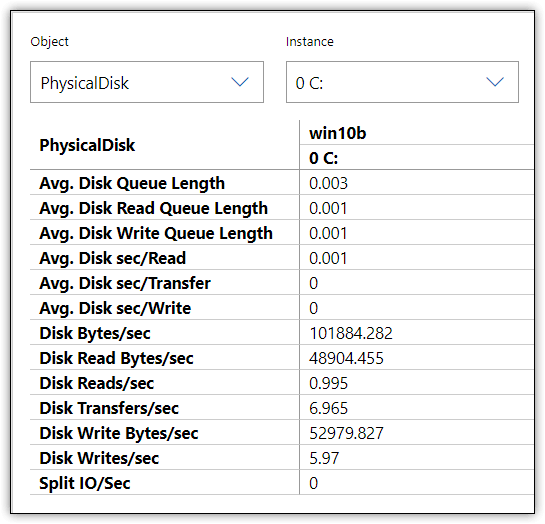
The new Performance Monitor makes it possible to get a snapshot of all your metrics in a readable format that you can export to a CSV file or copy and paste into an application such as Microsoft Excel. Figure 6 shows the information that Performance Monitor displayed on my system when I reran the T-SQL statements. This comes from about midway through the write operations.

Graphical user interface Description automatically generated

Figure 6. Storage metrics in Performance Monitor Report view

Capturing metrics at a specific point of time can be helpful, but it represents only one second from the entire operation. You should evaluate the metrics over a reasonable time span, looking for patterns and troubling behavior. For example, the figure shows the write latency at 0, which would be very suspect if you assumed that this one snapshot represented the entire operation.

You should also consider using other counters to uncover potential performance issues, such as those that monitor compute or network resources. In addition, if you’re monitoring SQL Server performance, you can use the counters built into Performance Monitor specific to that platform. Microsoft also provides other tools for monitoring SQL Server performance, such as the SQLIOSim utility, which is included with the SQL Server installation. Plus, Microsoft offers the DiskSpd utility, a free tool for generating a load on a storage system and measuring its performance. A tool like Redgate SQL Monitor will correlate disk monitoring with other metrics important to SQL Server workloads.

Of course, not all workloads are related to SQL Server, nor are all IT engineers using Windows to manage storage. Fortunately, there are plenty of third-party tools available for monitoring storage, and many storage vendors offer their own monitoring and management solutions. In fact, there are a wide range of options for tracking storage, as well as proactively diagnosing and resolving storage-related issues.

Storage monitoring is an ongoing process that must take into account the entire storage ecosystem—the storage systems themselves, the hardware and network components that support those systems, and the applications and users accessing them. The metrics I discussed here are merely a starting point for understanding the types of factors to take into account when evaluating storage performance. The topic of storage monitoring could easily take up an entire volume. What I covered in this article is just the beginning.

The post Storage 101: Monitoring storage metrics appeared first on Simple Talk.


from Simple Talk https://ift.tt/36C65N3
via