Monday, December 7, 2020

Ten tips for attracting and retaining DevOps talent

DevOps can help organizations become more agile and responsive to their customers, but it’s only as effective as the individuals who participate on the DevOps teams. Getting the right people in place is paramount to a successful DevOps implementation. Organizations need professionals with expertise in DevOps methodologies and who can work effectively within a cross-functional team structure. But such individuals can be difficult to find, especially as more organizations embrace DevOps for their application delivery.

Competition for qualified DevOps professionals has never been steeper, and managers have to work harder than ever to get the people they need for their teams. In this article, I provide ten tips for attracting and retaining DevOps talent but keep in mind that these are meant only as guidelines, not absolute rules. Much will depend on your organization’s individual circumstances and DevOps operations. That said, these tips should provide you with a good starting point for understanding the types of issues to take into account when looking to hire DevOps professionals.

1. Identity and assess internal talent.

Before opening up your search to the world at large, consider looking for talent in-house. It’s a lot cheaper to keep and train someone who already works in your organization than to incur the costs of recruiting and onboarding someone from the outside. Managers who interface with these individuals already have insight into how they work, how quickly they learn, which technologies they understand, and how well they interact with their coworkers. In addition, existing employees are already familiar with the company culture, which is a big plus.

Even if you don’t recruit from your internal pool, you should still assess the collective skills currently available on your DevOps team and from this information determine where there are gaps. For example, you might have team members with extensive development and operational skills but not a lot of experience with infrastructure as code (IaC). In this case, you might want to look for someone who’s strong in this area. Also keep in mind the need for soft skills, such as the ability to communicate and collaborate effectively.

2. Create a proper job description.

A job description defines exactly what you’re looking for. It outlines roles and responsibilities, lists the required experiences and skills, and includes any other pertinent details. It also provides an overview of compensation and benefits. You can use this information to develop a job post or when discussing the position with candidates, recruiters, or other individuals. For most candidates, compensation will be a top consideration. Still, many are also looking for other benefits, such as health care, flexible schedules, or the ability to work from home, which has become more of a priority in the age of COVID.

But compensation is only one part of the job description. It should also identify the required technical qualifications and, just as important, desired values for participating on a DevOps team. Be careful not to make the requirements so steep or rigid that it will be nearly impossible to fill the position. You also don’t want to discourage individuals who, with a little training, could be excellent additions to the team. At the same time, you need to make it clear that this is a cross-functional DevOps role that goes beyond basic development or operations.

3. Use all available resources.

Finding the right candidates is no small task and often requires that you cast a wide net. For many companies, a good place to start is with their own employees. Some organizations implement employee referral programs that include incentives. If you seek employee referrals, make sure you provide them with specific information about the position you’re trying to fill. In addition, if your company uses recruiters, be sure you work with an individual who has at least a basic understanding of what DevOps is about.

Of course, you can post the position to job boards such as LinkedIn, Stack Overflow, or GitHub Jobs, but you should also consider other venues. For example, you might make contacts through social networks, online platforms, or local meetup groups, keeping in mind that many group gatherings are virtual these days. Another option is schools, which often have programs for matching up graduating students with potential employers, although it could be difficult to get individuals with the experience you need.

4. Attend to the basics.

When assessing candidate qualifications, make certain you cover the basics, such verifying their skillsets, work experiences, and knowledge of DevOps methodologies. Also talk to their references and ensure that they’re credible and not just friends or acquaintances. Ask them questions about such topics as the candidates’ work habits, communication skills, willingness to learn, or anything else that can help you determine how well they’d fit into your company and DevOps culture.

Another area to look at is how long candidates have worked at their respective jobs. If someone has constantly hopped around from one position to the next, chances are you won’t want to invest the time and resources necessary to onboard that individual, unless you’re trying to fill a temporary position. In general, you’re looking for anything that might cue you on how well a candidate will meet your requirements and fit into your organization over the long-term.

5. Ease up on the checklist.

When evaluating candidates, you might use a checklist to help assess their qualifications. Even if it’s only in your head, the checklist provides a simple mechanism for quickly weeding through applicants. Just don’t go overboard. For example, your DevOps team might use Jenkins for automation, so you include it on your checklist. However, a candidate might be experienced with an assortment of other DevOps tools, as well as DevOps processes in general, but doesn’t have hands-on experience with Jenkins, in which case, the applicant would fail the checklist test.

If you make your checklist too rigid, you might rule out individuals who could potentially be valuable assets to your DevOps team. Candidates might not be familiar with specific tools, have the latest certifications, or earned degrees in computer science, but they might still have years of qualified experience and have demonstrated their ability to solve problems, learn new technologies, operate in team settings, and understand how DevOps works from the inside out. Your requirements are still important, but so are many other qualities.

6. Create the right company environment.

Attracting and retaining DevOps talent represent different sides of the same coin, and nowhere is this more apparent than when it comes to creating the right atmosphere for hiring, onboarding, and retaining employees. These days, job applicants often research potential companies to learn about their work environments and employee satisfaction. Organizations should strive to maintain and present inviting and professional atmospheres that appeal to both potential and existing employees. It should be clear to everyone that yours is an organization made up of quality individuals and engaged leadership who understand the importance of the people who work there.

Establishing the right atmosphere starts when first posting a job and interviewing candidates. You should be honest and transparent about your organization and the available position, so there are no surprises if the individual joins your company. You should also ensure that the hiring and onboarding processes are as welcoming and painless as possible. At the same time, keep in mind that DevOps professionals want to work on interesting projects and use cutting-edge technologies, which could mean making some changes to current operations.

7. Create the right DevOps team culture.

It’s often remarked that the key to an effective DevOps process is to establish the right team culture, with communication, collaboration, and cross-functional skills the key ingredients. The same goes for attracting and retaining DevOps professionals. When applying for a job, they want to know that they’ll be joining a functional DevOps team. If they get the job and the team doesn’t meet their expectations, they probably won’t be around for too long.

To build the right team culture, the organization’s leadership must be onboard, providing a unified vision that encourages learning, information sharing, team interaction, and innovation. A DevOps team also requires the autonomy necessary to deliver applications as effectively as possible. To this end, team members must also have the tools they need to perform their jobs and the necessary training to use those tools to their maximum benefit. In addition, teams should be kept relatively small, so they’re flexible enough to achieve their goals.

8. Ensure the candidate is a cultural fit.

One of the most difficult yet important qualifications to look for in candidates is whether or not they’ll fit in naturally with your DevOps culture. A candidate must be able to feel comfortable working on your DevOps team, and team members must feel comfortable working with that individual. For this, you need to probe deeper into the candidate’s abilities, rather than limiting yourself to questions about past experiences and qualifications.

You can get a sense of a candidate’s team experiences from the individual’s references and past positions, but it also helps to ask the candidate probing, open-ended questions. For example, rather than focus only on their work experiences, you might ask them how they’d solve specific problems or what steps they’d take to improve DevOps processes. If possible, have a candidate spend time with team members or join in one of their meetings, and then get their feedback on how he or she might fit in.

9. Implement continuous learning.

DevOps professionals want to work for an organization that values training, education and ongoing personal development. They need to stay current with the ongoing stream of new tools and technologies. If they’re not provided with the time and resources necessary to keep up with the industry, the DevOps processes themselves will suffer, leading to a less effective team and disgruntled workers.

The organization’s leadership should take an active role in promoting and providing an active learning environment, identifying new skillsets and setting the direction. DevOps professionals want to feel challenged in their jobs. They want to grow and make professional gains. At the same time, the organization as a whole can benefit from the acquired collective knowledge. For example, an education program might include a component that focuses on security, which could help build a greater awareness about safeguarding data.

10. Empower individual team members.

An organization’s leadership should instill a sense of empowerment in individual DevOps team members. Although learning opportunities go a long way in achieving this goal, an organization can also take other steps. For example, it’s important to give team members the time and space needed to complete their tasks, while still providing room to learn and innovate, all of which can help increase job satisfaction and minimize boredom.

For many people, it’s also important that they’re provided with opportunities for advancement. One way to demonstrate this is by training internal staff for more advanced positions, such as a DevOps role, rather than bringing in people from outside. Of course, not everyone is looking for advancement opportunities, but they still want work that is engaging and challenging, and they want to be recognized for their efforts, which is why feedback and praise can be so important to overall job satisfaction.

Keeping DevOps people around

There are no hard and fast rules for attracting and retaining DevOps professionals, but these tips can help you get started with your own process. In the end, the people you bring into your organization and how long you keep them will depend on your specific circumstances and your current DevOps teams and operations. Your organization’s leadership will play a key role by helping to create a company culture that values each individual while recognizing the importance of building strong teams that break down silos. Not only is a team mindset imperative to effective DevOps, but it’s essential to attracting and retaining the right talent.


The post Ten tips for attracting and retaining DevOps talent appeared first on Simple Talk.


from Simple Talk https://ift.tt/36P6dsa
via

Predictions for Healthcare and Database Infrastructure in 2021

Why will healthcare organizations evolve the way they manage development and test databases?

Kathi Kellenberger writes: In the US, healthcare organizations must maintain accreditation and certification from Joint Commission and other governing bodies to receive reimbursements from Medicare and Medicaid among other benefits. The accreditations emphasize quality, documented processes, outcomes, and patient satisfaction. Organizations must also comply with HIPAA and other regulations.

Infrastructure as code (IaC) can help healthcare organizations meet these requirements by having standardized, documented, and repeatable processes that will allow the organization to provide value to patients and healthcare providers faster.      

Grant Fritchey writes: As the regulatory and compliance requirements of healthcare are constantly growing and changing, the need to quickly respond within IT has become more necessary. The ability to rapidly deploy new systems is vital. Further, as we’ve seen from the pandemic in 2020, there’s a need to be able to burst capabilities along with demand.

All of this taken together means that the healthcare sector has to adopt methods and mechanisms that let them respond to demand more quickly.

Kendra Little writes: There are three factors that make this important for healthcare organizations: 1) competition is fierce; 2) technological innovation to provide cost-savings is badly needed; 3) code quality is of utmost importance.

These things mean that healthcare development needs to move fast while ensuring that they have high quality code. Using traditional development infrastructure patterns– which feature stale datasets and configurations that don’t match production – slows teams down and adds risk.

How can healthcare organizations use data virtualization / lightweight database clones and snapshots?

Kathi writes: Healthcare is changing rapidly with innovations such as electronic medical records, telemedicine, patient collection of data through wearable devices, and data-driven therapy. It’s also subject to the whims of legislation and court decisions. Organizations must have the ability to move fast, usually faster than is comfortable.  IaC gives the ability to deliver solutions more quickly to comply and be competitive.  

Grant writes: The adoption of a DevOps style development approach generally does two things for any organization; increase protection for production environments and helps speed delivery of value for the organization. The value that a healthcare system has to deliver is also two-fold; support of the patients and clients and safe management of their information. Healthcare will be able to use DevOps and Infrastructure as a Service as a mechanism to support the need for bursts of patients, like during the pandemic.

Further, the added protections through automation of delivery, testing, and a more consistent environment means that they can do deliver this added functionality while still protecting the personal identifying information of the patients and clients.

Kendra writes: When it comes to database environments, infrastructure as code patterns provide a massive benefits to organizations who have large teams working on shared databases, or who have unpredictable release cadences. Infrastructure as code allows much greater flexibility when it comes to managing deployments.

How much do you see modernization of database infrastructure taking off with healthcare organizations in 2021?

Kathi writes: We are in unchartered waters right now in the midst of a global pandemic. I imagine that many organizations are struggling with day-to-day operations and don’t foresee making wholesale changes to the way they work. On the other hand, to stay competitive, healthcare organizations must find ways to move faster and innovate. IaC and DevOps practices can be beneficial in the long run, so I hope they are considering adopting these practices.    

Grant writes: Healthcare is generally not quick to move on new technology, depending on the field. There has been a steady growth in this area as the benefits become more and more visible across the industry. I expect the growth to continue and slowly accelerate. I don’t anticipate a giant leap forward, but rather a constant, and growing, general adoption as an obvious benefit.

Kendra writes: We’ve seen continued steady adoption in this sector over time. I think this trend will continue – strong, steady growth, even as some spending lessens due to the pandemic and economic pressures.

The post Predictions for Healthcare and Database Infrastructure in 2021 appeared first on Simple Talk.


from Simple Talk https://ift.tt/36NQvxv
via

Feature branches and pull requests with Git to manage conflicts

I’ve recently fielded two questions from different customers regarding how to best work as a team committing database changes to Git.

While there are a wide variety of branching models which work well for databases with Git — Release Flow, GitFlow, or environment-specific branching models – almost every successful Git workflow emphasizes two things:

  • Using feature branches (also known as topic branches) for the initial development of code
  • Using Pull Requests to merge changes from feature branches into a mainline or shared code branch

These two patterns are very common because Git encourages workflows that branch and merge often, even multiple times in a day. (To learn more about branching, read Branching in a Nutshell.)

In other words, Git is a powerful VCS and has very complex functionality at hand. In my experience, becoming familiar with patterns of branching, merging, and conflict resolution have helped make Git’s complexity easier to understand and have helped me feel like I’m working with Git – rather than constantly fighting against Git.

A pleasant side effect is that this also makes working with Git more fun: I’m able to work more frequently with common commands that work predictably and focus more on my work, rather than resolving an unexpected error.

What does this workflow look like?

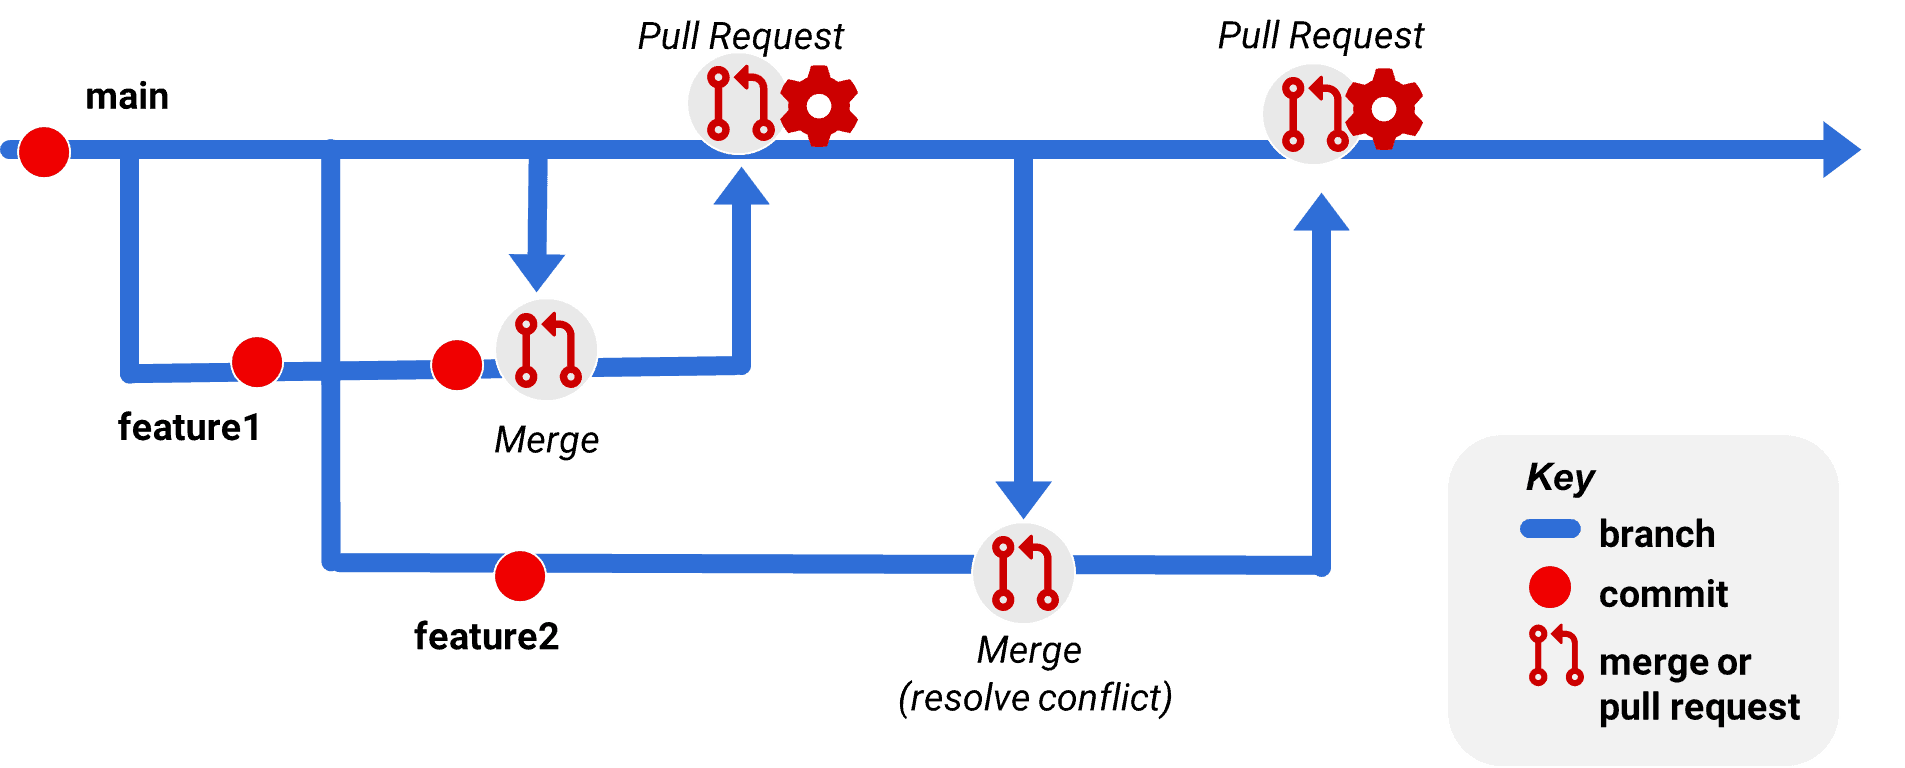
If you’re not an experienced Git user, this probably sounds quite abstract. Here is a diagram of an example workflow which may help you visualize it. This workflow diagram shows a workflow with time flowing from left to right:

Branching diagram

In this workflow, there is a main branch. The main branch represents a mainline of code – it could be named master; it could be named trunk; the naming is up to your preferences. In this example, everything merged into the main branch is expected to be code that has been reviewed and is considered to be ready to be deployable to a QA environment via automation.

Let’s say that our developers are working with the free Git client in VSCode and are using a tool like Redgate’s SQL Source Control, Redgate Change Control, or SQL Change Automation to script their database changes and manage the state of their development databases. (I’m mentioning specific Redgate tools here because I’m very familiar with how they work – if you’re using other tools, they may follow similar flows as this. A lot depends on how the tool has been designed, how much of a Git client is implemented inside the tool, the types of files it uses, and the naming conventions of the files.)

A developer, Amy, has used VSCode’s Git client to create a branch named feature1 off main. Here’s how feature1 progresses:

  • Amy works in a dedicated development database and uses their database development tool of choice (SQL Source Control, Redgate Change Control, SQL Change Automation) to generate database code and commit it to their local clone of the Git repository.
  • After the second commit to feature1, Amy merges from the main branch into feature1 to check if any other commits have been made to main since the feature1 branch was created. In this case, there have been no commits to merge in.
  • When Amy believes their feature is complete, they do a final code generation and commit with their database development tool, then push the feature1 branch to the upstream repository.
  • Amy then creates a Pull Request in the upstream Git repository to merge feature1 into main.
  • The Pull Request process may run a build against the code and automatically add the appropriate reviewers. It also supports discussion and interaction about the change.
  • The Pull Request is approved and completed, resulting in Amy’s changes in feature1 being merged into main.

Another developer, Beth, creates the branch feature2 from main using VSCode’s Git client.

Beth happens to do this a short time after Amy created the feature1 branch, but before Amy used a Pull Request to merge her changes back into main.

  • By the time Beth decides that feature2 is ready to be shared, Amy already merged feature1 back into main via Pull Request.
  • Beth uses the Git client in VSCode to pull down main and see if anything has changed in it recently – and she finds that there have been changes.
  • Beth merges the main branch into feature2 and discovers that some of the files she changed when generating and committing code with her database tool was also changed in main.
  • This is presented as a conflict by the Git client in VSCode. The Git client asks Amy to resolve it for the feature 2 branch.
  • Amy has three choices for each file: she may decide to keep only her own changes which she made to feature2, take only the “incoming” changes (from main), or accept both and combine them. Amy may additionally make changes to the files involved in the conflict, such as fixing up commas or making other manual edits.
  • After deciding how to merge the changes (let’s say they are compatible changes and she decides to combine them), Amy saves the modified files in VSCode. She then stages (“adds”) them and commits the changes into the feature2 branch. This commit concludes the merge process.
  • At this point, it’s useful for Amy to validate that the merge has resulted in valid SQL and to update her development database with any changes she has accepted. She can do this by opening her database development tool and “apply” updates to her development database.
  • When ready to merge changes into main, Amy pushes her commits upstream in the feature1 branch, and follows the same Pull Request workflow described above to merge changes into main.

Q: Can the developers work in a shared database?

In this workflow, developers are working in isolated feature branches and sharing changes by merging. What if each developer doesn’t have their own copy of the database to associate with their feature branch?

First off, dedicated development databases solve many problems and promote better quality code. Troy Hunt outlines why this is the case in his post, The unnecessary evil of the shared development database from 2011. Although this post is a classic, it’s still highly relevant, and the only thing that has changed is that SQL Server Developer Edition is now completely free (it was inexpensive at the time the article was written).

That being said, if you must use a shared development database, you can try to work around the limitations. You may need to take special configuration steps, depending on the tool. For example, if you are using SQL Source Control, you may use a “custom” connection to access a shared database via Git. You may be able to use object locking in your database tool to mitigate the risks of overwriting each other’s work, but you will still see changes in the shared development databases made by other people appear as suggested changes which you could import to version control, which can be very confusing.

Essentially, even if you are sharing a single branch, using a distributed version control system such as Git – where developers each maintain their own local copy of the repo and do not all push and pull to the repo simultaneously – makes using a shared database environment for development awkward.

Whether or not you are using shared or dedicated databases, it is worth your while to get into the practice of using individual feature branches and a Pull Request workflow because of the following benefits.

Building good practices

There are five major things which I really like about this workflow:

1. Team members may share changes safely and easily – Imagine that Amy and Beth do the same changes as above at the same times, but they are both working in the main branch. If either Amy or Beth attempts to push new commits to the main branch and it has been updated since they last pushed, they will get an error that the origin has changed and they cannot push.

What if Amy or Beth is working on an experimental change that they’d like to get feedback on from a team member, without having to integrate other changes? There isn’t a good way to do that when they are sharing the branch.

2. You may push changes upstream regularly without fear – It’s convenient to work in a distributed VCS like Git because you can work in a disconnected fashion when you need to. If you’re using a hosted Git repo like Azure DevOps Services or GitHub and your internet connection fails, no problem! You can still commit locally. However, I think it’s also a good practice to back up your changes by regularly pushing them upstream to the repo. If you have a hardware failure locally or accidentally delete the wrong folder, no worries, you haven’t lost work. Working in a private topic branch means you can push your branch up to the upstream repo anytime without worry about needing to handle a conflict.

3. It makes merging purposeful and frequent – In the scenario where Amy and Beth are both working simultaneously on a shared branch, if one of them pushes a commit, the other will need to merge the changes the next time they pull. This may be done automatically by a Git client if there is no conflict, but if they are working on any of the same files, when pulling they will need to pause to go resolve the conflict. Because this occurs only sometimes on a pull, this feels like a distraction and a break in flow.

To contrast, if Amy and Beth have the habit of working in their own feature branches, they can develop a habit of periodically comparing their branch with mainline branches at the origin, and deciding when they want to merge in changes from those branches. This tends to make merges happen at a point when the developer is ready to consider the merge—not when they might be thinking about solving another problem.

3. It allows frequent commits – Many times when people begin working in a shared branch in Git, it isn’t just any branch – it’s a mainline branch. In other words, it’s a branch that regularly (and perhaps automatically) deploys code to an environment. Doing your early development work in a shared mainline branch like this has some bad effects: it means you are either less likely to experiment, or you are less likely to commit your changes regularly. After all, what if you commit something that is an experiment which you don’t want to get deployed? Well, you’re going to have to undo those commits – that’s not hard, but do you want a commit history full of doing things and then undoing them? Getting into the habit of working in feature branches gives you much more freedom: you can commit and undo commits knowing that at the time you get to a Pull Request, you’ll have some options on squashing your commit history easily when you merge in. Or, if you prefer not to squash commit history, you can always create a temporary feature branch from your existing feature branch to play around with some changes before you decide what you want to do.

5. It encourages early change review and communication – So far, I’ve mainly talked about using Pull Requests as the way in which you merge changes from one branch into another. This is only a small bit of the value PRs give you. PRs often function as a major point of communication and review. Most hosted Git options even allow you to do things like automatically add reviewers and require a specific number of reviewers for a PR to be approved. When a PR is opened, you may also have it automatically run a build and test the code, potentially even deploying it to an environment for the reviewers to examine. In short, PR workflows promote communication and review early in code development. The workflow can be a strong foundation for ensuring you have quality code.

Q: What if I forget to use a feature branch?

If you want everyone to use a PR workflow, you may choose to protect some branches. Many hosted Git providers allow ways to do this: you can configure protected branches in GitHub, create a branch policy in Azure DevOps, or set Branch Permissions in BitBucket, for example. The protections or policies are generally enforced upstream at the origin. If you commit changes locally to a protected branch and attempt to push them, this will result in an error that you’re not allowed to change the upstream branch directly. In this case, you can usually create another branch locally off your updated main branch and proceed from there. If you have some work in progress that you aren’t ready to commit, you may want to stash it.

A detailed video example – “SQL Source Control and VSCode: Handling Git Conflicts”

In this video, I’m using a dedicated development database model with the following setup:

  • Azure DevOps Services Organization and Project – this hosts the upstream Git Repo.
    • The upstream repo is used to push and pull changes for Git clients doing the work. The upstream Git Repo is also where Pull Requests are created, reviewed, approved, and completed.
    • I have cloned two copies of the same Git repo to my local workstation so that I can simulate working as two people, each in their own local repo.
  • SQL Source Control – this compares the SQL Server database to the code in the Git Repo.
    • It identifies when there are changes in the development database to commit to the repo, automatically scripts changes to commit to the repo, and helps keep the development database in sync when new changes come from the Git repo.
    • I’ve already created a SQL Source Control project and committed it to the repo. Both of my local copies of the repo begin with having pulled down copies of the project.
  • VSCode and Azure Data Studio – These free tools from Microsoft share the same free Git client. In this example I use these tools to manage my merge conflicts.
    • I’m using VSCode to represent one user and Azure Data Studio to represent the other, simply because I can set different color schemes in them and it makes it easier for me to track.
    • I have the free GitLens extension installed in both VSCode and Azure Data Studio. This extension makes it easy to see details of commit history and has many more useful options. This is totally optional, simply nice to have in my experience.

A list of chapters is below if you’d like an overview, or if you’d like to jump to specific sections.

Chapters in the video:

  • 00:00 Overview of the demo setup
  • 02:07 Demo begins of a merge conflict when working in the same branch as your teammates
  • 03:17 Why conflicts occur as interrupts if we work in the same branch in Git
  • 04:35 Interpreting Git conflict messages in SQL Source Control
  • 05:58 Resolving a merge conflict within your current branch
  • 08:37 Why working in private feature branches is a common practice for Git users
  • 10:42 Traveling back in time with the GitLens extension
  • 12:07 Resetting SQL Source Control after resetting in Git
  • 14:30 Demo begins of working in a feature branch in SQL Source Control, and proactively merging from main when we’re ready
  • 15:17 Checking out a new branch in VSCode
  • 18:18 Merge changes from the upstream main branch into our feature branch. I have enabled VSCode to regularly fetch changes, so I haven’t manually ‘fetched’.
  • 20:38 Resolving the conflict in VSCode
  • 23:40 Staging and committing to complete the merge
  • 25:05 Applying changes we made in VSCode to our dev database in SQL Source Control
  • 26:06 Pushing our changes to the central Git repo and creating a Pull Request
  • 29:00 Approving and completing the Pull Request

Branching and merging in Git is not as hard as it may seem at first glance!

If you are new to Git, this can seem daunting to learn.

While Git can be quite complex, I have found that hands-on experience with Git and practicing in a test project got me a long way, and it happened faster than I expected. The branching workflows described in this article have also made my work in Git flow easier, which has made it less frustrating and more fun.

I hope this pattern proves useful to your team as well.


The post Feature branches and pull requests with Git to manage conflicts appeared first on Simple Talk.


from Simple Talk https://ift.tt/3oyLzCy
via

Thursday, December 3, 2020

Why it makes sense to monitor SQL Server deadlocks in their own Extended Events trace

We recently had customer ask why SQL Monitor creates an Extended Events session to capture deadlock graphs, when SQL Server has a built-in system-health Extended Events trace which also captures deadlock information?

There are a couple of reasons why a dedicated trace is desirable for capturing deadlock graphs, whether you are rolling your own monitoring scripts or building a monitoring application. I like this question a lot because I feel it gets at an interesting tension/balance which at the heart of monitoring itself.

Segmentation is helpful for users

One reason that SQL Monitor uses a separate Extended Events trace is to segment off what is used by SQL Monitor. This helps administrators understand what is impacted if they stop or modify an Extended Events session. 

While Microsoft recommends that administrators don’t stop, alter, or delete the system_health session, in practice it’s quite easy to do any of these things. An administrator might assume if they have installed other monitoring software that they could stop, delete, or modify the definition of system_health without impacting the alternate monitoring.

Extended Events sessions have retention policies

The current implementation of the system_health session is that it writes data both to an asynchronous ring buffer target and to an event_file. The event files currently have a maximum file size of 5MB and can roll over to 4 files.

While this is a sensible configuration for most systems, the system_health session collects multiple events. In some scenarios, it’s possible for these events to generate a significant amount of data quickly, which could plausibly use up a lot of the event file space and roll off other events. 

It’s also quite possible for Microsoft to add additional events or change the amount of data retained for these logs at any time.

These factors make it desirable to use a separate trace for distinct events which you care about for monitoring purposes. This way you control your own retention policies and can isolate events to their own traces as needed. 

Deadlock reports are lightweight to collect in Extended Events

When creating any Extended Events trace against a production instance, it’s important to evaluate the performance impact of the events you’re collecting. 

The xml_deadlock_report event, for example, is a lightweight event to collect. 

Other events have a greater impact on the instance. The most famous example of this is that starting an Extended Events trace that collects ‘actual’ execution plans using the ‘query_post_execution_showplan’ event can very quickly slow down a SQL Server instance — even if you have applied a filter to only collect plans for a very specific query! This event unfortunately has a very high overhead which filtering does not reduce. (There are some alternatives, but it gets complex pretty fast.)

Monitoring is an art of balancing between observation and impact

I like this example because it gets at a core challenge of monitoring: we always need to balance the impact of observation with the benefits of the data we collect. This is always a tough problem as you build monitoring software, as monitoring queries are also subject to variances in query optimization and performance in a database, just like any other activities.

In the case of deadlock graphs, the impact of collecting these in a dedicated Extended Events session is low enough that the benefits of segmenting this out are persuasive, in my view.

Want to learn more about deadlocks?

The post Why it makes sense to monitor SQL Server deadlocks in their own Extended Events trace appeared first on Simple Talk.


from Simple Talk https://ift.tt/37ujgOP
via

Tuesday, December 1, 2020

Deep Learning with GPU Acceleration

Deep Learning is the most sought-after field of machine learning today due to its ability to produce amazing, jaw-dropping results. However, it was not always the case, and there was a time around 10 years back when deep learning was not a field considered by many to be practical. The long history of deep learning shows that researchers proposed many theories and architectures between the 1950s to 2000s. However, training large neural networks used to take a ridiculous amount of time due to the limited hardware support of those times. Thus, neural networks were deemed highly impractical by the machine learning community.

Although some dedicated researchers continued with their work on neural networks, the significant success came in the late 2000s when researchers started experimenting with training neural networks on GPUs (Graphics Processing Unit) to speed up the process, thus making it somewhat practical. It was, however, the 2012 Imagenet challenge winner Alexnet model which was, trained parallelly, on GPUs, that inspired the use of GPUs to the broader community and catapulted deep learning into the revolution seen today.

What is so special about GPUs that they can accelerate neural network training? And can any GPU be used for deep learning? This article explores the answers to these questions in more detail.

CPU vs GPU Architecture

Traditionally, the CPU (Central Processing Unit) has been the leading powerhouse of computers responsible for all computations taking place behind the scenes on the computer. The GPU is special hardware that was created for the computer graphics industry to boost the computing-intensive graphics rendering process. It was pioneered by NVIDIA who launched the first GPU Geoforce 256 in 1999.

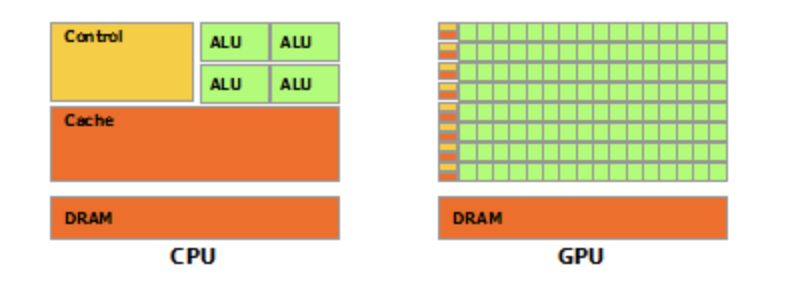
Architecturally, the main difference between the CPU and GPU is that a CPU generally has limited cores for carrying out arithmetic operations. In contrast, a GPU can have hundreds and thousands of cores. For example, a standard high performing CPU generally has 8-16 cores whereas NVIDIA GPU GeForce GTX TITAN Z has 5760 cores! Compared to CPUs, the GPU also has a high memory bandwidth which allows it to move massive data between the memory. The figure below shows the basic architecture of the two processing units.

CPU vs GPU Architecture

Why is the GPU good for Deep Learning?

Since the GPU has a significantly high number of cores and a large memory bandwidth, it can be used to perform high-speed parallel processing on any task that can be broken down for parallel computing. In fact, GPUs are incredibly ideal for embarrassingly parallel tasks that require no effort to break them down for parallel computation.

It so happens that the mathematical matrice operations of the neural network also fall into the embarrassingly parallel category. This means GPU can effortlessly break down the matrice operation of an extensive neural network, load a huge chunk of matrice data into memory due to the high memory bandwidth, and do fast parallel processing with its thousands of cores.

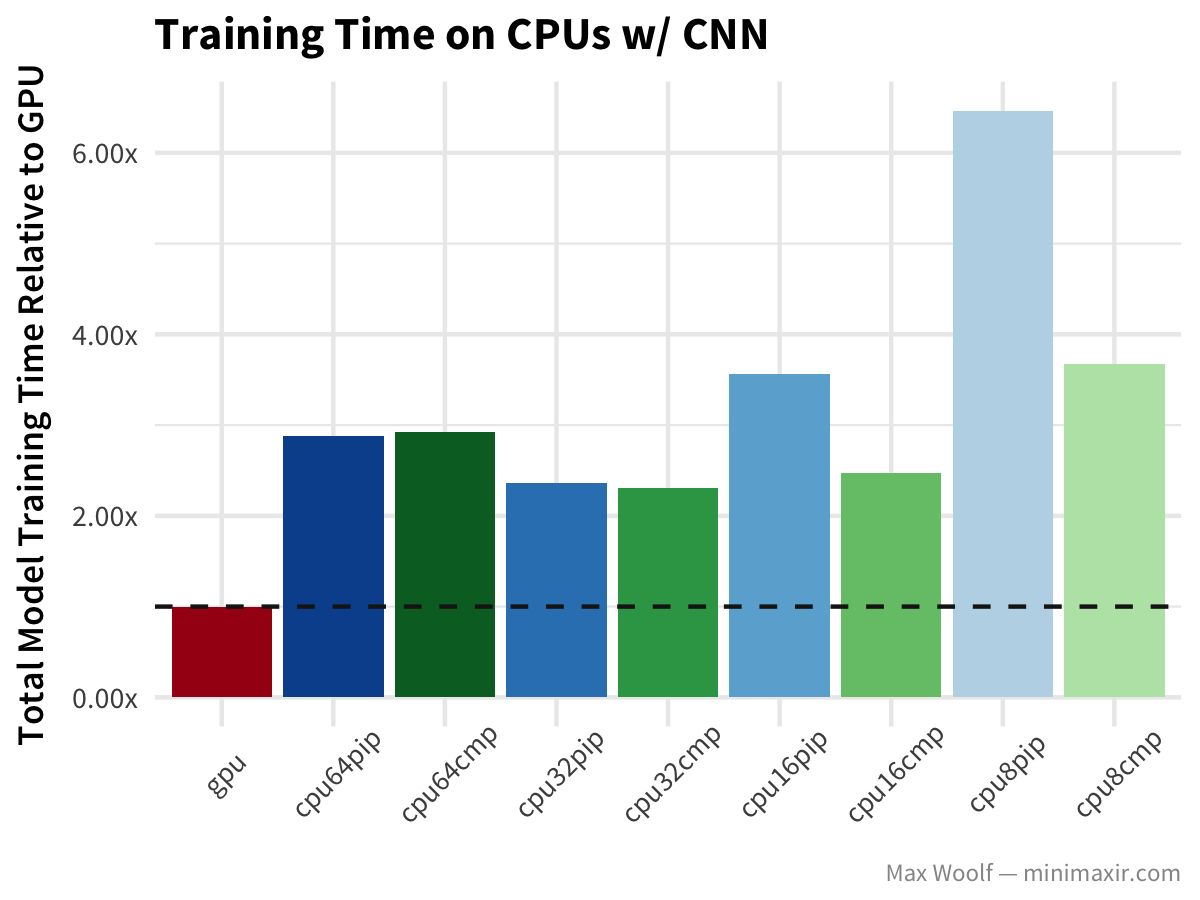
A researcher did a benchmark experiment by running the CNN benchmark on the MNIST dataset on GPU and various CPUs on the Google Cloud Platform. The results clearly show that CPUs are struggling with training time, whereas the GPU is blazingly fast.

GPU vs CPU performance benchmark (Source)

NVIDIA CUDA and CuDNN for Deep Learning

Currently, Deep Learning models can be accelerated only on NVIDIA GPUs, and this is possible with its API called CUDA for doing general-purpose GPU programming (GPGPU). CUDA which stands for Compute Unified Device Architecture, was initially released in 2007, and the Deep Learning community soon picked it up. Seeing the growing popularity of their GPUs with Deep Learning, NVIDIA released CuDNN in 2014, which was a wrapper library built on CUDA for Deep Learning functions like backpropagation, convolution, pooling, etc. This made life easier for people leveraging the GPU for Deep Learning without going through the low-level complexities of CUDA.

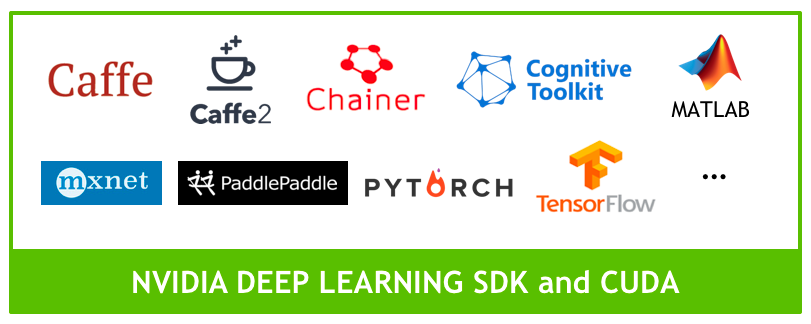
Soon all the popular Deep Learning libraries like PyTorch, Tensorflow, Matlab, and MXNet started incorporating CuDNN directly in their framework to give a seamless experience to its users. Hence using a GPU for deep learning has become very simple compared to earlier days.

Deep Learning Libraries supporting CUDA (Source)

NVIDIA Tensor Core

By releasing CuDNN, NVIDIA positioned itself as an innovator in the Deep Learning revolution, but that was not all. In 2017, NVIDIA launched a GPU called Tesla V100, which had a new type of Voltas architecture built with dedicated Tensor Core to carry out tensor operations of the neural network. NVIDIA claimed that it was 12 times faster than its traditional GPUs built on CUDA core.

Voltas Tensor Core Performance (Source)

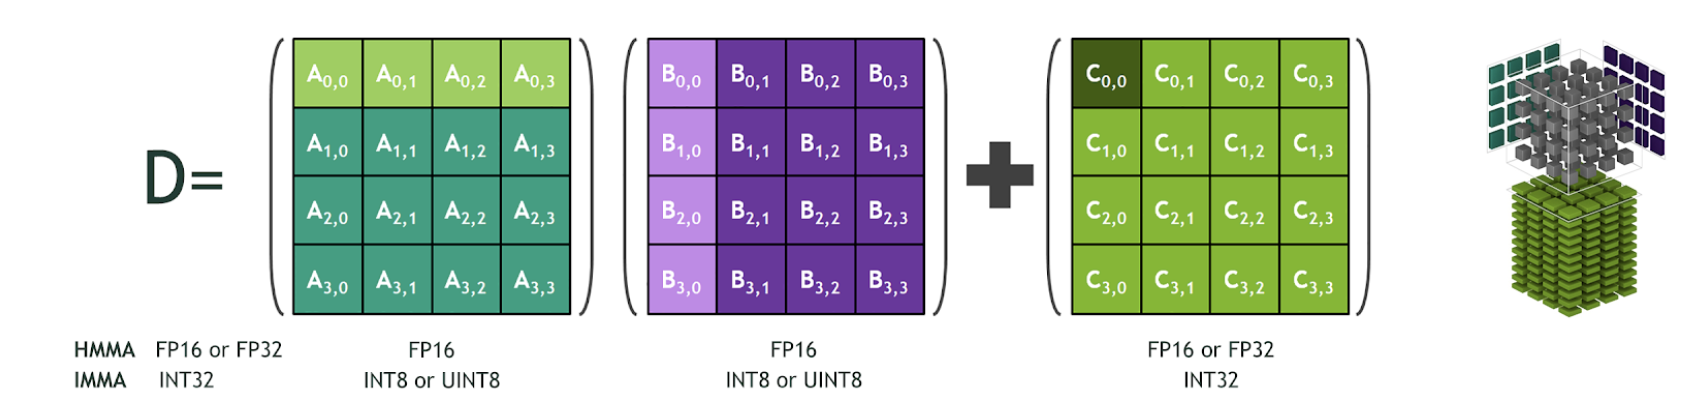
This performance gain was possible because its Tensor Core was optimized to carry out a specific matrice operation of multiplying two 4×4 FP16 matrices and add another 4×4 FP16 or FP32 matrices. Such operations are quite common in neural networks; hence an optimized Tensor Core for this operation could boost the performance significantly.

Matrice Operation supported by Tensor Core (Source)

NVIDIA added support for FP32, INT4, and INT8 precision in the 2nd generation Turing Tensor Core architecture. Recently, NVIDIA released the 3rd generation A100 Tensor Core GPU based on Ampere architecture with support for FP64 and a new precision Tensor Float 32 which is similar to FP32 and can deliver 20 times more speed without code change.

Turing Tensor Core Performance (Source)

Hands-on with CUDA and PyTorch

Now take a look at how to use CUDA from PyTorch. This example carries out multiple operations both on CPU and GPU and compares the speed. (code source)

First, import the required numpy and PyTorch libraries.

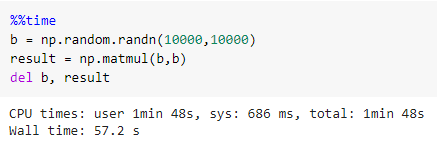
Now multiply the two 10000 x 10000 matrices with CPU using numpy. It took 1min 48s.

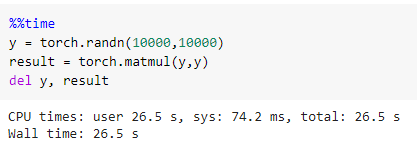
Next, carry out the same operation using torch on CPU, and this time it took only 26.5 seconds

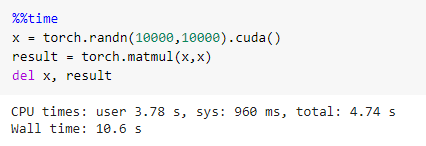
Finally, carry this operation using torch on CUDA, and it amazingly takes just 10.6 seconds

To summarize, the GPU was around 2.5 times faster than the CPU with PyTorch.

Points to consider for GPU Purchase

NVIDIA GPUs have undoubtedly helped to spearhead the revolution of Deep Learning, but they are quite costly, and a regular hobbyist might not find it very pocket friendly. It is essential to purchase the right GPU as per your needs and not go for high-end GPUs unless really required.

If your needs are to train state of the art models for regular use or research, you can go for high-end GPUs like RTX 8000, RTX 6000, Titan RTX. In fact, some of the projects may also require you to set up a cluster of GPUs which will require a fair amount of funds.

If you intend to use GPUs for competitions or hobbies and have the money, you can purchase medium to low-end GPUs like RTX 2080, RTX 2070, RTX 2060 GTX 1080. You also have to consider the RAM required for your work since the GPUs come with different RAM sizes and are priced accordingly.

If you don’t have the money and would still like to experience GPU, your best option is to use a Google Colab that gives free but limited GPU support to its users.

Conclusion

I hope this article gave you a very useful introduction into how GPUs have revolutionized Deep Learning. The article made an architectural and practical comparison between CPU and GPU performance and also discussed various aspects that you should consider while choosing GPU for your project.


The post Deep Learning with GPU Acceleration appeared first on Simple Talk.


from Simple Talk https://ift.tt/3mnyN9D
via

Monday, November 30, 2020

Are your Oracle archived log files much too small?

Have you ever noticed that your archived redo logs can be much smaller than the online redo logs and may display a wild variation in size? This difference is most likely to happen in systems with a very large SGA (system global area), and the underlying mechanisms may result in Oracle writing data blocks to disc far more aggressively than is necessary. This article is a high-level description of how Oracle uses its online redo logs and why it can end up generating archived redo logs that are much smaller than you might expect.

Background

I’ll start with some details about default values for various instance parameters, but before I say any more, I need to present a warning. Throughout this article, I really ought to keep repeating “seems to be” when making statements about what Oracle is (seems to be) doing. Because I don’t have access to any specification documents or source code, all I have is a system to experiment on and observe and the same access to the documentation and MOS as everyone else. However, it would be a very tedious document if I had to keep reminding you that I’m just guessing (and checking). I will say this only once: remember that any comments I make in this note are probably close to correct but aren’t guaranteed to be absolutely correct. With that caveat in mind, start with the following (for 19.3.0.0):

Processes defaults to cpu_count * 80 + 40

Sessions defaults to processes * 1.5 + 24 (the manuals say + 22, but that seems to be wrong)

Transactions: defaults to sessions * 1.1

The parameter I’ll be using is transactions. Since 10g, Oracle has allowed multiple “public” and “private” redo log buffers, generally referred to as strands; the number of private strands is trunc(transactions/10). and the number of public strands is trunc(cpu_count/16) with a minimum of 2. In both cases, these are maximum values, and Oracle won’t necessarily use all the strands (and may not even allocate memory for all the private strands) unless there is contention due to the volume of concurrent transactions.

For 64-bit systems, the private strands are approximately 128KB and, corresponding to the private redo strands, there is a set of matching in-memory undo structures which are also approximately 128KB each. There are x$ objects you can query to check the maximum number of private strands but it’s easier to check v$latch_children as there’s a latch protecting each in-memory undo structure and each redo strand:

select  name, count(*) 
from    v$latch_children
where   name in (
                'In memory undo latch',
                'redo allocation'
        )
group by name
/

The difference between the number of redo allocation latches and in-memory undo latches tells you that I have three public redo strands on this system as well as the 168 (potential) private strands.

The next important piece of the puzzle is the general strategy for memory allocation. To allow Oracle to move chunks of memory between the shared pool and buffer cache and other large memory areas, the memory you allocate for the SGA target is handled in “granules” so, for example:

select  component, current_size, granule_size 
from    v$sga_dynamic_componentsa
where   current_size != 0
/

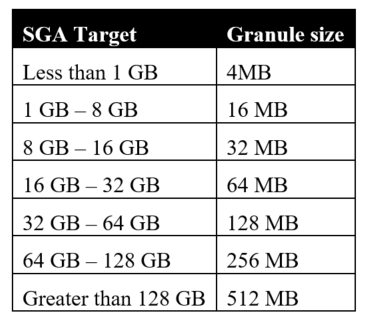
This is a basic setup with a 10GB SGA target, with everything left to default. As you can see from the final column, Oracle has decided to handle SGA memory in granules of 32MB. The granule size is dependent on the SGA target size according to the following table:

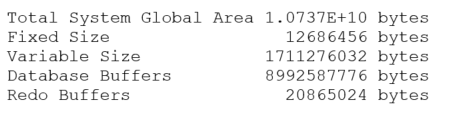
The last piece of information you need is the memory required for the “fixed SGA” which is reported as the “Fixed size” as the instance starts up or in response to the command show sga (or select * from v$sga), e.g.:

SQL> show sga

Once you know the granule size, the fixed SGA size, and the number of CPUs (technically the value of the parameter cpu_count rather than the actual number of CPUs) you can work out how Oracle calculates the size of the individual public redo strands – plus or minus a few KB.

By default, Oracle allocates a single granule to hold both the fixed SGA and the public redo strands, and the number of public redo strands is trunc(cpu_count/16). With my cpu_count of 48, a fixed SGA size of 12,686,456 bytes (as above), and a granule size of 33,554,432 bytes (32MB), I should expect to see three public redo strands sized at roughly:

(33,554,432 – 12,686,456) / trunc((48 / 16)) = 20,867,976 / 3 = 6,955,992

In fact, you’ll notice if you start chasing the arithmetic, that the numbers won’t quite match my predictions. Some of the variations are due to the granule map, and other headers, pointers and other things I don’t know about in the granule that holds the fixed SGA and public redo buffers. In this case, the actual reported size of the public strands was 6,709,248 bytes – so the calculation is in the right ballpark but not extremely accurate.

Log buffer, meet log file

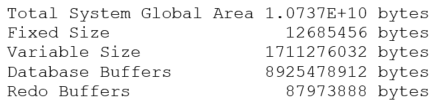
It is possible to set the log_buffer parameter in the startup file to dictate the space to be allocated to the public strands. It’s going to be convenient for me to do so to demonstrate why the archived redo logs can vary so much in size for “no apparent reason”. Therefore, I’m going to restart this instance with the setting log_buffer = 60M. This will (should) give me 3 public strands of 20MB. But 60MB is more than one granule, and if you add the 12MB fixed size that’s 72MB+. This result is more than two granules, so Oracle will have to allocate three granules (96MB) to hold everything. This is what I see as the startup SGA:

Checking the arithmetic 87973888 + 12685456 = 100659344 = 95.996 MB i.e. three granules.

The reason why I wanted a nice round 20MB for the three strands is that I created my online redo log files at 75MB (which is equivalent to 3 strands worth plus 15MB), and then I decided to drop them to 65MB (three strands plus 5MB).

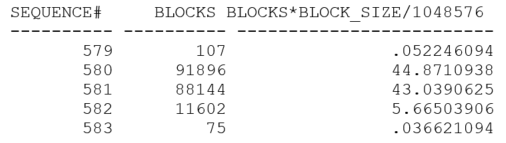
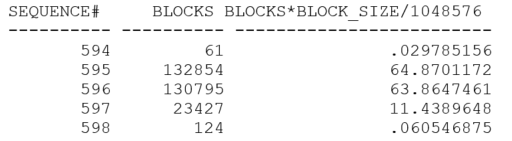
My first test consisted of nothing but switching log files then getting one process to execute a pl/sql loop that did several thousand single-row updates and commits. After running the test, this is what the last few entries of my log archive history looked like:

select  sequence#, blocks, blocks * block_size / 1048576 
from    v$archived_log;

My test generated roughly 72MB of redo, but Oracle switched log files (twice) after a little less than 35MB. That’s quite interesting, because 34.36 MB is roughly 20MB (one public strand) + 15MB and that “coincidence” prompted me to reduce my online logs to 65MB and re-run the test. This is what the next set of archived logs looked like:

This time I have archived logs which are about 25MB – which is equivalent to one strand plus 5MB – and that’s a very big hint. Oracle is behaving as if each public strand allocates space for itself in the online redo log file in chunks equal to the size of the strand. Then, when the strand has filled that chunk, Oracle tries to allocate the next chunk – if the space is available. If there’s not enough space left for a whole strand, Oracle allocates the rest of the file. If there’s no space left at all, Oracle triggers a log file switch, and the strand allocates its space in the next online redo log file. The sequence of events in my case was that each strand allocated 20MB, but only one of my strands was busy. When it had filled its first allocation, it allocated the last 5 (or 15) MB in the file. When that was full, I saw a log file switch.

To test this hypothesis, I could predict that if I ran two copies of my update loop (addressing 2 different tables to avoid contention), I would see the archived logs coming out at something closer to 45MB (i.e. two full allocations plus 5MB). Here’s what I got when I tried the experiment:

If you’re keeping an eye on the sequence# column, you may wonder why there’s been a rather large jump from the previous test. It’s because my hypothesis was right, but my initial test wasn’t quite good enough to demonstrate it. With all my single-row updates and commits and the machine I was using, Oracle needed to take advantage of the 2nd public redo strand some of the time but not for a “fair share” of the updates. Therefore, the log file switch was biased towards the first public redo strand reaching its limits, and this produced archived redo logs of a fairly regular 35MB (which would be 25MB for public strand #1 and 10MB for public strand #2). It took me a few tests to realize what had happened. The results above come from a modified test where I changed the loop to run a small number of times updating 1,000 rows each time. I checked that I still saw switches at 25MB with a single run – though, as you may have noticed, the array update generated a lot less redo than the single-row updates to update the same number of rows.

Finally, since I had three redo strands, what’s going to happen if I run three copies of the loop (addressing three different tables)?

With sufficient pressure on the redo log buffers (and probably with just a little bit of luck in the timing), I managed to get redo log files that were just about full when the switch took place.

Consequences

Reminder – my description here is based on tests and inference; it’s not guaranteed to be totally correct.

When you have multiple public redo strands, each strand allocates space in the current online redo log file equivalent to the size of the strand, and the memory for the strand is pre-formatted to include the redo log block header and block number. When Oracle has worked its way through the whole strand, it tries to allocate space in the log file for the next cycle through the strand. If there isn’t enough space for the whole strand, it allocates all the available space. If there’s no space available at all, it initiates a log file switch and allocates the space from the next online redo log file.

As a consequence, if you have N public redo strands and aren’t keeping the system busy enough to be using all of them constantly, then you could find that you have N-1 strand allocations that are virtually empty when the log file switch takes place. If you are not aware of this, you may see log file switches taking place much more frequently than you expect, producing archived log files that are much smaller than you expect. (On the damage limitation front, Oracle doesn’t copy the empty parts of an online redo log file when it archives it.)

In my case, because I had created redo log files of 65MB then set the log_buffer parameter to 60MB when the cpu_count demanded three public redo strands, I was doomed to see log file switches every 25MB. I wasn’t working the system hard enough to keep all three strands busy. If I had left the log buffer to default (which was a little under 7MB), then in the worst-case scenario I would have left roughly 14MB of online redo log unused and would have been producing archived redo logs of 51MB each.

Think about what this might mean on a very large system. Say you have 16 Cores which are pretending to be 8 CPUs each (fooling Oracle into thinking you have 128 CPUs), and you’ve set the SGA target to be 100GB. Because the system is a little busy, you’ve set the redo log file size to be a generous-sounding 256MB. Oracle will allocate 8 public redo strands (cpu_count/16), and – checking the table above – a granule size of 256MB. Can you spot the threat when the granule size matches the file size, and you’ve got a relatively large number of public redo strands?

Assuming the fixed SGA size is still about 12M (I don’t have a machine I can test on), you’ve got

strand size = 244MB / 8 = 30.5 MB

When you switch into a new online redo log file, you pre-allocate 8 chunks of 30.5MB for a total of 244M, with only 12MB left for the first strand to allocate once it’s filled its initial allocation. The worst-case scenario Is that you could get a log file switch after only 30.5 MB + 12 MB = 42.5 MB. You could be switching log files about 6 times as often as expected when you set up the 256MB log file size.

Conclusion

There may be various restrictions or limits that make some difference to the arithmetic I’ve discussed. For example, I have seen a system using 512MB granules that seemed to set the public strand size to 32 MB when I was expecting the default to get closer to 64MB. There are a number of details I’ve avoided commenting on in this article, but the indications from the tests that I can do suggest that if you’re seeing archived redo log files that are small compared to the online redo log files, then the space you’re losing is because of space reserved for inactive or “low-use” strands. If this is the case, there’s not much (legal) that you can do other than increase the online redo log files so that the “lost” space (which won’t change) becomes a smaller fraction of the total size of the online redo log. As a guideline, setting the online redo log file size to at least twice the granule size seems like a good idea, and four times the size may be even better.

There are other options, of course, that involve tweaking the parameter file. Most of these changes would be for hidden parameters, but you could supply a suitable setting for the log_buffer parameter that makes the individual public strands much smaller – provided this didn’t introduce excessive waits for log buffer space. Remember that the value you set would be shared between the public redo threads, and don’t forget that the number of public redo threads might change if you change the number of CPUs in the system.


The post Are your Oracle archived log files much too small? appeared first on Simple Talk.


from Simple Talk https://ift.tt/36oNXpz
via

Wednesday, November 25, 2020

Why installing a “cringe-meter” on social media can boost joy

Do you cringe while scrolling through social media? When have you ever felt better after scrolling?

If you feel like social media is a net-loss for collective mental health, you’re not alone.

We post in superabundance with flailing emotions. We flaunt our duck-faced selfies with smooth-faced filters until we don’t even look human. We hammer our political stances down the throats of others until both sides are fuming. We show off our eighth-graders consolation sports awards as if they were the NBA finals. We highlight all of our greatness under a golden spotlight and ignore the flaws. The cringe-factor on social media has reached profound levels.

We’ve all done it. We’ve all made cringe-posts.

I’ve looked back at posts I’d made and had to cringe. You know the ones…

“Congratulations to me!” is the underlying theme of a cringe-post.

There’s nothing inherently wrong with self-promotion in the modern age, but these cringe-posts typically cross the line into “corn-syrup”. Cringe-posts are void of substance and social nutrition. They highlight thy self while providing no value to anyone else. Cringe-posts merely add to the noise and inject more “corn syrup” into the social media diet of others.

It’s a post made from a place of desperation or vulnerability. And it’s not our fault.

Those Instagram, Facebook and Twitter algorithms aim to exploit us when we are most vulnerable. We know this now. They nudge us to post more than we actually want to. And when we post too often, we run out of things to say. When we run out of things to say, we make posts without substance…cringe-posts. It’s not a good look for us as individuals.

This is why I have installed a cringe-meter into my social media. The meter runs 1-5.

1 = tiny bit cringe
2 = uncomfortable cringe
3 = gross cringe
4 = heavy reputation harming cringe
5 = unbearable career-threatening cringe

How does it work?

A close friend of whom I deeply trust will post a 1-5 in the comments of a “cringe-post” I make. And I will do the same for them. I call this person my “cringe-meter-monitor” (CMM). The goal is not to chart at all (no number posted in the comments).

It’s important to find a cringe-meter-monitor who will give it to you straight—someone with high self-awareness and higher social-awareness. Someone you really trust to critique you. Note, if they are posting several “cringe-posts” on their own social media, they are not the monitor for you.

So far, social media has been the old Wild West. And the cringe-meter is a system of checks and balances to restore some calm in the saloon.

Even if the cringe-meter can decrease cringes by 10-15%, I believe social media will be a much healthier and tolerable place: Less “corn syrup” posts. Less selfish posts. More posts made from a peaceful mindset. Quality over quantity.

Hey, the cringe-meter may not save the world, but it’s a solid start.

The good news is, social media has been exposed. At its core, it is ultimately not our friend. And with this new awareness, we can be more self-aware in how we present ourselves online. It’s all going to get better.

Commentary Competition

Enjoyed the topic? Have a relevant anecdote? Disagree with the author? Leave your two cents on this post in the comments below, and our favourite response will win a $50 Amazon gift card. The competition closes two weeks from the date of publication, and the winner will be announced in the next Simple Talk newsletter.

The post Why installing a “cringe-meter” on social media can boost joy appeared first on Simple Talk.


from Simple Talk https://ift.tt/39c6cQB
via