Wednesday, February 17, 2021

How to become a data scientist: A data-driven approach to careers in data science

Imagine a world without any data. Now imagine the extent of all the available data. Both are equally unimaginable. Every second of the day, petabytes of data are being produced. However, copious amounts of data, also known as big data, in and of itself are not useful until it is computed. As John Allen Paulos famously once said – “Data data everywhere but not a thought to think.”, we are surrounded by an overwhelming amount of data. Still, the real value of having data and analytics teams is in generating this data’s insights. 

Big data needs to be explored, tamed, analyzed, and interpreted before it can be of use. In the recent past, organizations have hired unicorns to help them solve this problem. Unicorns named data scientists that can help them to store, retrieve, and tame their unstructured data. They are also expected to generate predictive insights from the data using advanced analytics.

What does a data scientist do?

Data science combines various disciplines such as data analysis, data engineering, mathematics, statistics, domain expertise, advanced computing, visualization, and much more. A data scientist is expected to have mastery in four fundamental areas: business/domain, mathematics, computer science, and communication.

Thus, a data scientist is someone who can leverage the seemingly infinite amount of data to achieve business goals. They are expected to uncover the latest trends in unstructured data through microscopic attention and analysis. The analysis is followed by effective communication and interpretation of the results, enabling the organization to drive change.

Why is it an exciting time to start a career in data science?

Data science became the rite of passage for many data enthusiasts after the Harvard Business Review called it “the sexiest job of the 21st century”. The field of data science has made enormous strides since this article in 2012. When no universities were offering a degree in data science, Harvard scholars predicted the rapid growth and popularity of this field. Immediately after, LinkedIn saw a rise in the number of people identifying as data scientists.

Data science has been the most sought after career in the US for four consecutive years, according to Glassdoor. Bloomberg reported a 75% increase in job listings for data scientists. In 2018, the demand for data scientists in India shot up by an incredible 417%. According to the US Bureau of Labor Statistics, 11.5 million new jobs are expected to be created in the field of data science by 2026.

Considering the supersonic speed at which data is being produced, the demand for data scientists is not expected to take a dip anytime soon. With technological advancements and the high tide of data submerging every form of industry, organization, and enterprise, it is no surprise that experts who can crunch data are required everywhere. With more and more companies realizing the importance of big data, AI, and machine learning, they are rapidly implementing data science capabilities.

Not just tech for companies, data scientists are being sought by every sector. Tech giants like Amazon, Apple, Facebook, Google, and Microsoft employ only one-half of one percent of the data scientists in the U.S. While there is no shortage of data, there is a shortage of data scientists. According to DataRobot, 73% of organizations surveyed do not have any data scientists or AI specialists.

Since data science is all the rage, it creates a demand for individuals with advanced educational qualifications. All the big organizations look for people with at least a Master’s or a PhD. The higher the educational qualification, the greater is the depth of knowledge required to be a data scientist. According to KDnuggets, 88% of data scientists have a Master’s degree, and 46% have a PhD. However, with an increasing demand for this position and not enough highly qualified professionals to fill them, small companies accept citizen data scientists.

Apart from the high demand and the handsome pay, data science is a satisfying career because of the vast array of problems you can solve with it.

Roles that are close to data science

There are multiple career paths that one could take to become a data scientist. The most obvious route is through education. According to the Bureau of Labor Statistics, most data scientists possess a master’s degree or higher in computer science. Thanks to the diversity of skills required in data science organizations, not everyone needs to get an advanced degree to get into the data science space. There are many paths a working professional can take to become a data scientist. Most of the modern and data-driven organizations have realized the value of data. This realization led to the creation of multiple specialized roles that deliver value using data. Below are some of the data related roles that exist in most organizations:

Data Analyst

A data analyst is required to collect, process, and transform data into usable forms. They help companies make better business decisions. Depending on the organization, an analyst’s job could include tracking web analytics, extracting insights from consumer datasets, analyzing A/B testing, making strategic recommendations based on financial data, or merely organizing messy, unstructured data. A qualified data analyst’s essential requirements are to understand Python, C/C++, HTML, visualization tools, and SQL.

Data Engineer

Data engineers are architects of big data and information pipelines. They strive to create a reliable, interconnected network of data for use within an organization. They design, build, and manage systems that analyze and process data for the organization. They also ensure that the systems run smoothly. This job is different from typical data science careers because it focuses more on hardware and data warehousing than analysis. It is an advanced position and requires a background in software engineering. Data engineers must be skilled in SQL, Databases, Big Data, Cloud computing, Java, Python, Ruby, Matlab, Hive, Pig, SAS, etc.

Database Administrator

Database administrators (DBAs) are responsible for effectively storing and organizing an organization’s data. DBAs are often seen as the guardian angels of the company’s data as they – create highly available databases, design security rules and protocols to safeguard data and perform upgrades to keep databases up to date. DBAs are expected to have at least a bachelor’s degree in computer science or information technology. DBAs are skilled in SQL, Database management, Big Data, Algorithms, Optimization, UNIX/ Linux, Data Analysis, AWS, Python, etc.

Business Analyst

Business Analysis is a great career choice for someone with an educational background in business and a strong foundation in numbers. Business analysis is a less technical position, requiring collaboration between business and IT. A business analyst requires a knowledge of business processes, data visualization tools, and data modeling. They are expected to understand and map out business processes, identify key business problems that can be solved with analytics, and collaborate with other technical groups to translate business problems into solutions.

Business Intelligence Developer

This position requires extensive knowledge about business and the ability to translate data into consumable data products. BI developers and analysts gather data, design and develop systems to increase a business’ efficiency, and help management make good decisions. They do this by either mining data from a company’s software or reviewing competitor data and industry trends. These experts are expected to be tech-savvy, and they can either use the existing BI tools or develop their own BI analytic applications.

Machine Learning Engineer

Machine learning engineers deliver machine learning-focused software solutions to meet an organization’s needs. They design and build machine learning systems that can interpret data and make predictions or draw conclusions. In addition to creating data funnels and machine learning software, they also run tests and monitor the system’s performance to ensure accuracy. These engineers require advanced skills in statistics, programming, and data science.

Data Architect

With the increasing importance of big data, this position is becoming more and more critical. Data architects engineer new database systems, design analytics applications, and create blueprints to integrate, centralize, maintain, and protect data. They ensure the performance of data solutions, improve the functionality of existing systems, and provide access to database analysts and administrators. The position requires a solid understanding of languages like Hive, XML, SQL, Pig, Spark, systems development, and database architecture skills.

How to break into data science?

As I alluded to in the previous section, many roles come close to data science. What are the similarities and differences between these roles? What skills should one add to their profile to become a data scientist? This section will show a data-driven approach explaining the career path options for a citizen data scientist.

Data scientists skills profile

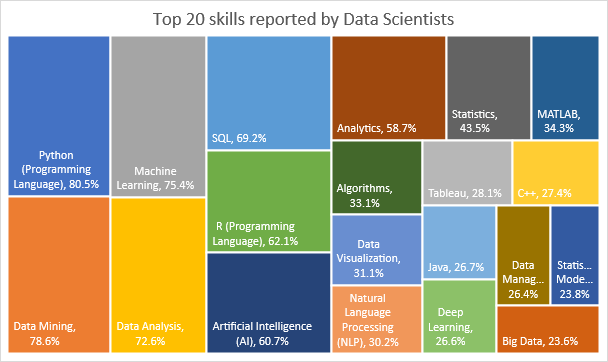
I performed an analysis of the skills that are required to become a data scientist. The information represented below is manually collected from LinkedIn. Figure 1 summarizes the skills of 200 data scientists from leading technology destinations such as the San Francisco Bay Area, New York City Metropolitan Area, Seattle, Dallas-Fort Worth Metroplex, Raleigh-Durham-Chapel Hill Area, Greater Chicago Area, Greater Boston, London Area, Bengaluru, and New Delhi.
Top 20 skills for data science

Figure 1: Top 20 skills of data scientists

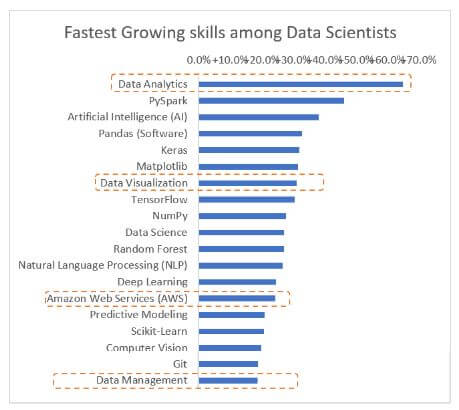
It is abundantly clear from Figure 1 that the top skill that most data scientists have is Python, followed by data mining. Figure 2 represents the fastest-growing skills among data scientists for the last 12 months. It’s interesting to observe that members of other data teams traditionally possess four out of the top 20 growing skills. For instance, “Data Analytics”, and “Data Visualization” skills are very common among Data Analysts, Business Analysts, and Business Intelligence Engineers. “AWS” and “Data management” skills are commonly found among Data Engineers and Database Administrators.
Fastest growing skills for data scientists

Figure 2: Fastest growing skills among data scientists

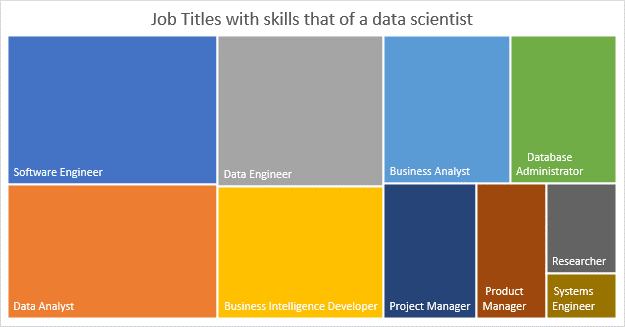
Motivated by these growing skills, I conducted a separate analysis to understand the common job titles of these skills. In other words, I manually collected the job titles of people who have at least one of the top 20 skills that data scientists have. I have excluded data science-related jobs such as Statistician, AI Engineer, ML Developer, etc., from this analysis. Figure 3 summarizes the top 10 job titles for these skills. It is clear from Figure 3 that people who are already in roles such as Software Engineers, Data Analysts, Business Analysts, Data Engineers, Business Intelligence Developers, and Database Administrators have the highest chances of getting into data science.
Job titles with skills that overlap data science

Figure 3: Top 10 Job Titles with skills that of a data scientist

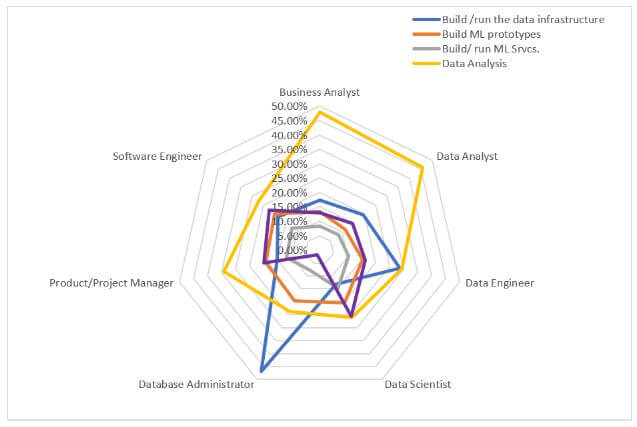
Another data point I looked at is the annual Kaggle Data Science and Machine Learning survey. The latest 2020 survey garnered 20,036 survey responses. The survey attracted global participants at all career and educational levels. This survey asks an extensive list of questions related to their careers, tools usage, nature of work, etc. The specific question that caught my attention is – “Select any activities that make up an important part of your role at work: (Select all that apply)”. The results of this question are summarized in Figure 4. Like the previous analysis, I have excluded data science-related jobs such as Statistician, AI Engineer, ML Developer, etc., from Figure 4. The spider chart from Figure 4 shows that Data Analysts and Business Analysts spend a significant amount of their time performing Data Analysis. Data Engineers balance their time building and running data infrastructure and performing data analysis. DBAs spend a significant amount of their time building and running data infrastructure. DBAs are also seen supporting the data science function by conducting data analysis and assisting the building of ML prototypes. But what’s interesting is the duties of data scientists (yellow line in spider chart). It seems like data scientists are performing duties that are distributed across many skillsets: data analysis, experimentation, ML prototyping, and building ML services. The chart also shows that data scientists spend most of their time performing data analysis than other duties.
Kaggle- Duties performed vs. roles.

Figure 4: Kaggle- Duties performed vs. roles.

Career paths for citizen data scientists:

Based on the above data points and analysis, I created four different career paths for citizen data scientists. Data analysts, data engineers & DBAs, business analysts, and software engineers have the most direct career paths to become a data scientist. Figure 5 outlines the options for professionals in data careers to become data scientists and identifies the transferable skills and the gaps that existing data professionals might have to fill.
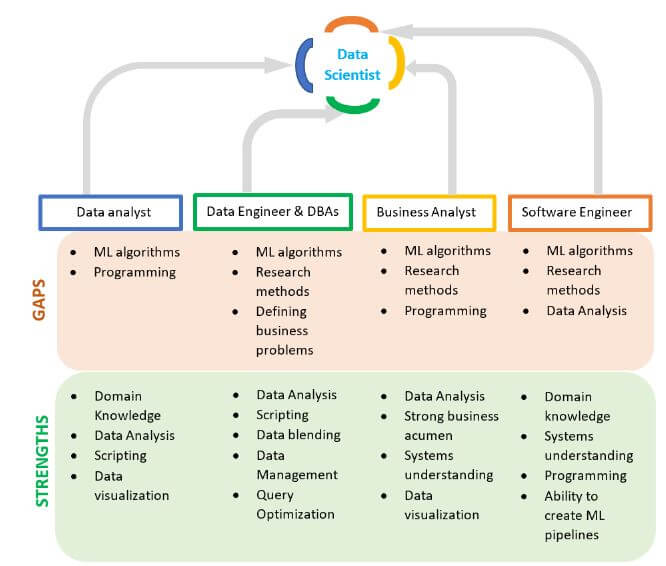
How to become a data scientist pathways for roles

Figure 5: Career paths for citizen Data Scientists

How to become a data scientist

Data science has become a hot field in the recent past, and it will continue to be one for the foreseeable future. The shortage of people with data science skills will be amplified soon as more companies realize the value of investing in data scientists. This article provides a view into the data science related careers, and it also conducts a detailed analysis of the skills and duties of these related fields. Finally, the article also provides career path options for data professionals to become a data scientist.

If you liked this article, you might also like Building Machine Learning Models to Solve Practical Problems.

The post How to become a data scientist: A data-driven approach to careers in data science appeared first on Simple Talk.


from Simple Talk https://ift.tt/3rYPQB9
via

Tuesday, February 16, 2021

Storage 101: RAID

The series so far:

  1. Storage 101: Welcome to the Wonderful World of Storage
  2. Storage 101: The Language of Storage
  3. Storage 101: Understanding the Hard-Disk Drive 
  4. Storage 101: Understanding the NAND Flash Solid State Drive
  5. Storage 101: Data Center Storage Configurations
  6. Storage 101: Modern Storage Technologies
  7. Storage 101: Convergence and Composability 
  8. Storage 101: Cloud Storage
  9. Storage 101: Data Security and Privacy 
  10. Storage 101: The Future of Storage
  11. Storage 101: Monitoring storage metrics
  12. Storage 101: RAID

Organizations have been turning to RAID (redundant array of independent disks) since the 1990s to support their application storage. A RAID device comprises multiple disk drives that provide a unified storage solution capable of delivering greater performance and fault tolerance than an individual disk. The use of multiple drives makes it possible to employ techniques such as striping, mirroring, and parity, while delivering an integrated platform that an operating system (OS) sees as a single logical drive.

The idea of distributing data across multiple disks has been around for many decades, but it wasn’t until 1988 that the concept of RAID was formalized by David A. Patterson, Garth Gibson, and Randy H. Katz in their seminal report, A Case for Redundant Arrays of Inexpensive Disks (RAID). The report introduced five levels or RAID and described their relative cost and performance.

Soon after publication, RAID quickly solidified as a valuable option for efficiently storing data. However, it also became apparent that the arrays were not as inexpensive as the original title suggested, so the founders soon adopted the name redundant array of independent disks. From these beginnings, RAID’s popularity quickly grew. Between 1990 and 2002, vendors sold over $150 billion in RAID storage devices, according to Katz.

RAID’s popularity continues to this day. Although it doesn’t replace a comprehensive backup strategy, most levels offer some level of redundancy for providing fault tolerance. In addition, RAID can also help improve performance, depending on the configuration and supported workloads. Plus, RAID makes it possible to deliver greater capacities because it uses multiple drives. Together, these advantages continue to afford RAID a prominent place in data centers and other environments where data is stored.

Digging into RAID

RAID works by spreading data across multiple disks and presenting those disks as a single logical drive. The way in which data is distributed depends on the RAID configuration, which is indicated by the RAID level, such as RAID 1 or RAID 5. Each level uses one or more of the following technologies to provide fault tolerance or improve performance:

  • Striping. Logically sequential data such as a file is segmented into multiple blocks of a specific size and distributed across the disks in the array. The data can also be split at the bit or byte level, rather than block. Because the data is distributed, it can be read from and written to multiple disks simultaneously, significantly improving read and write performance, depending on the workloads.
  • Mirroring. Data is replicated to two or more disks during write operations, providing redundancy and ensuring availability in the event of disk failure or data corruption on one of the disks. Mirroring can often improve read performance, but it generally has minimal impact on write performance.
  • Parity. The storage controller performs exclusive OR (XOR) comparisons on the striped data across an array’s drives and stores the results of those calculations either on the same drives or on a separate drive. The parity data can then be used to reconstruct the primary data if one of the drives fails. Although parity requires extra disk space, it’s typically less than what’s needed for mirroring, and it still offers fault tolerance. However, write performance is compromised owing to the requirements of the parity calculation—for each application write, four physical I/Os are required, two reads and two writes. This is commonly referred to as the “RAID 5 write penalty”.

For the most part, mirroring and parity are mutually exclusive, which means a RAID level will use only one or two of the distribution technologies, but not three. However, data distribution is only part of the story. A RAID device can also be implemented as either a hardware-based or software-based solution:

  • Hardware-based RAID. A dedicated hardware controller manages and processes all storage operations. The controller might by a separate RAID card or built into the motherboard. Hardware-based RAID is more expensive to implement than software-based, but it performs better, is compatible with various operating systems, and it supports more RAID levels.
  • Software-based RAID. The host OS manages and processes the storage operations, making it cheaper and easier to set up than hardware-based RAID. However, it might not perform as well, especially if it’s competing with other server operations. In addition, an OS might support only specific RAID levels. Software-based RAID is generally not suited to complex RAID configurations.

Although hardware-based and software-based RAID are the primary ways in which RAID is implemented, there are also other approaches. For example, you might find references to firmware-based RAID, driver-based RAID, hybrid RAID, or other forms. The pros and cons of these other forms fall somewhere between software-based and hardware-based RAID.

RAID Levels

One of the primary ways in which RAID devices are distinguished from one another is by their configuration levels, which determine how data is distributed across the drives. Each level represents a storage configuration that employs various combinations of striping, mirroring, and parity to improve performance, fault tolerance, or both.

The original RAID taxonomy introduced a numbering scheme for labeling each level, and that scheme has continued to this day. Each level is characterized by tradeoffs between usable capacity, availability, and performance. The taxonomy included the following six levels:

  • RAID 0: This level uses striping to split data into blocks and distribute those blocks across two or more disks. RAID 0 can improve performance because data can be written to or read from all the disks simultaneously, but it provides no redundancy and therefore no fault tolerance. If one disk fails, the entire stripe is unreadable, making RAID 0 ill-suited for most business applications. However, RAID 0 maximizes capacity usage, so it can be a cost-effective option for non-critical or non-persistent workloads. (RAID 0 was not mentioned in the 1988 report.)
  • RAID 1: This level uses mirroring to duplicate data to two or more drives. In case of disk failure, data can be read from one of the other disks, providing reliable fault tolerance. RAID 1 improves read performance because data can be read from multiple disks simultaneously, and for most workloads write performance does not suffer. Organizations implement RAID 1 primarily for its fault tolerance and availability, making it well-suited for mission-critical applications. RAID 1 also lowers usable capacity, resulting in a higher cost per GB.
  • RAID 5: This level uses block-level striping similar to RAID 0 but also adds parity. However, the parity data is distributed across the array’s drives, rather than using a dedicated drive like RAID 3 or RAID 4. Implementing RAID 5 requires at least three disks. In addition, the parity reduces usable drive space and impacts write performance because of the added complexity of writing data. However, RAID 5 can tolerate a single drive failure without losing data
  • RAID 2, RAID 3, and RAID 4: Although these RAID levels are described by Patterson et al. (in the paper mentioned above), the levels are obsolete and are included here merely for reference. Their primary distinctions are how striping and parity are implemented. RAID 2 leverages bit-level striping, RAID 3 uses byte-level striping, and RAID 4 implements block-level striping. RAID 3 and RAID 4 also require a dedicated disk for parity. All three of these RAID levels use Hamming code parity, a linear form of error-correcting code that protects against data loss.

RAID 0, RAID 1, and RAID 5 are commonly used today, and other RAID configurations have been added since the early days. For example, RAID 6 extends RAID 5 by including another layer of parity. As a result, a RAID 6 array requires at least four disks, but it can handle two simultaneous disk failures without losing data.

Another approach to RAID is to nest configurations to address limitations in any one level. By far the most common nested implementations is RAID 10, which is also written as RAID 1+0 because it combines RAID 0 and RAID 1. In this configuration, the array uses striping and mirroring to deliver both performance and fault tolerance. RAID 10 requires a minimum of four drives and comes at a greater cost per GB as a result of the higher redundancy.

To help to make sense of these configurations, the following table lists several common RAID levels in use today and the some of the main differences between them.

Feature

RAID 0

RAID 1

RAID 5

RAID 6

RAID 10

Data distribution technology

Striping

Mirroring

Striping and parity

Striping and double parity

Striping and mirroring

Minimum disks

2

2

3

4

4

Disk utilization based on minimum number of disks

100%

50%

Varies, but typically more than 50%

Varies, but typically more than 50%

50%

Data protection

No fault tolerance

Provides fault tolerance

Provides fault tolerance

Provides fault tolerance

Provides fault tolerance

Performance

Good read and write

Good read, average write

Good read, below average write

Good read, below average write

Good read and write

The table is meant only to provide a high-level overview of how RAID configurations compare, particularly when it comes to performance. Differences in storage products and controllers, types of workloads, network capabilities, and other variables can all impact how well a RAID storage device performs.

Typical SQL Server use cases for RAID include:

  • RAID 0: Stream analytics or other transient, non-persistent data
  • RAID 1: OS, SQL log
  • RAID 5: SQL data for which high write performance is not required
  • RAID 10: SQL log for which high availability and high capacity or high availability and high performance are required or SQL data for which high write performance is required.

One of the most common implementation blunders is choosing RAID 5 rather than RAID 10. There is a time-worn project management maxim: Good, fast, cheap—pick two. In the context of RAID levels, this is accurately refashioned to: Available, fast, cheap—pick two. Both RAID 5 and RAID 10 provide availability. However, IT teams commonly choose the higher usable capacity of RAID 5, which requires fewer disks than a RAID 10 implementation for the same user capacity and is therefore less expensive in terms of raw hardware costs. Yet doing so comes at the expense of performance. Owing to the “RAID 5 write penalty” described earlier, high write workloads on RAID 5 will suffer significantly relative to RAID 10.

In addition, storage solutions might also implement other configurations. For example, RAID 01 (RAID 0+1) is similar to RAID 10 except that the data is first mirrored and then striped, rather than the other way around. In addition, some RAID configurations require proprietary hardware, such as RAID 7, a RAID level whose name was trademarked by the Storage Computer Corporation. RAID 7 is based on RAID 3 and RAID 4 but adds caching capabilities.

RAID’s Uncertain Future

In recent years, industry pundits have been discussing the extent to which RAID will have a place in the next generation data center, but despite uncertainty, its presence remains ubiquitous. Yet as storage evolves, and requirements grow more demanding. These factors put into question how long RAID will remain relevant.

For example, RAID was not designed to handle many of today’s larger hard disk drives (HDDs). A disk failure can result in lengthy data rebuild times, significantly impacting performance and availability. And the longer it takes to rebuild a drive, the greater the chances another one will fail. At the same time, many organizations are turning to object storage, which can offer more efficient mechanisms for ensuring redundancy.

Some also cite the greater reliance on solid state drives (SSDs) as another reason for RAID’s demise. Today’s SSDs are more reliable than HDDs and offer performance orders of magnitude greater than HDDs (even when compared RAID 0). For this reason, some argue that RAID is no longer necessary with all-flash storage. However, most experts agree that mission critical workloads demand storage tier redundancy.

Most experts also believe that SSD-based RAID is a viable alternative to traditional systems, especially for the additional fault tolerance. In fact, several vendors now offer all-flash storage solutions that support standard RAID or proprietary forms of RAID. For example, the Hewlett Packard Enterprise (HPE) 3PAR storage systems supports several RAID configurations, including RAID 10, RAID 50 (RAID 5+0) and RAID MP (multiple parity and striping).

The future of RAID remains uncertain, but the advent of SSD-based RAID and proprietary RAID implementations suggest that RAID, like most storage technologies, will continue to evolve to meet the needs of modern workloads. Whether the end result will look anything like the RAID of 1990 is yet to be seen. But no matter what we end up with, there will always be a demand for storage that can deliver the performance and fault tolerance necessary to support whatever workloads are thrown our way, which is what RAID is all about.


The post Storage 101: RAID appeared first on Simple Talk.


from Simple Talk https://ift.tt/3jT3tPv
via

Monday, February 15, 2021

Custom Binding for Azure Functions

Azure Functions are a great development tool, allowing us to create serverless software. However, one detail was bothering me when I create a function: The HTTP Trigger receives a HTTPRequest object and we need to extract the parameters from the request. This becomes kind of a low-level code mixed with our business code. It’s like going back in time some years.

The solution is simple: we can create a custom binding to extract objects from the HTTPrequest. I’m surprised I haven’t found many references to this online. The most complete reference I found was a reply on stackoverflow: https://stackoverflow.com/questions/45183820/how-to-pass-parameters-by-post-to-an-azure-function . However, we can still improve the code.

Let’s see how we can implement this custom binding and how it can improve the development of Azure Functions. We will analyze the classes needed to build the custom binding.

BindingExtensionProvider

This class is responsible for adding a binding rule to the azure function configuration. While adding the binding rule, a link is stablished between a custom attribute for the binding rule (FromBodyAttribute in our example) and the binding rule factory (FromBodyBindingProvider). This is the only purpose of the attribute, stablish this link.

    public class BindingExtensionProvider : IExtensionConfigProvider
    {
        private readonly ILogger logger;
        public BindingExtensionProvider(ILogger<Startup> logger)
        {
            this.logger = logger;
        }

        public void Initialize(ExtensionConfigContext context)
        {
            // Creates a rule that links the attribute to the binding
            context.AddBindingRule<FromBodyAttribute>().Bind(new FromBodyBindingProvider(this.logger));
        }
    }


FromBodyAttribute

It’s a simple attribute with no special code, but it’s used by BindingExtensionProvider to link a parameter in the Azure Function with this binding provider. We can apply the attribute to a parameter and the link will be stablished.


    [AttributeUsage(AttributeTargets.Parameter | AttributeTargets.ReturnValue)]
    [Binding]
    public sealed class FromBodyAttribute : Attribute
    {
    }


FromBodyBindingProvider

This class implements the interface IBindingProvider and works like a factory for our custom binding rule. The BindingExtensionProvider inserts an instance of this class in the Azure Function configuration.

This class creates the next one, the binding rule. and here I included one small touch of wisdom: The binding rule is generic, the code captures the data type of the parameter in the context and dynamically creates the binding rule using this data type. By doing so, the data type will be identified from the parameter declaration, no additional clutter in the middle.


    public class FromBodyBindingProvider : IBindingProvider
    {
        private readonly ILogger logger;
        public FromBodyBindingProvider(ILogger logger)
        {
            this.logger = logger;
        }

        public Task<IBinding> TryCreateAsync(BindingProviderContext context)
        {
            IBinding binding = CreateBodyBinding(logger, context.Parameter.ParameterType);
            return Task.FromResult(binding);
        }

        private IBinding CreateBodyBinding(ILogger log,Type T)
        {
            var type = typeof(FromBodyBinding<>).MakeGenericType(T);
            var a_Context = Activator.CreateInstance(type, new object[] { log });
            return (IBinding)a_Context;
        }
    }


FromBodyBinding

This class implements the IBinding interface. This is the class injected inside Azure Function configuration. It provides an instance of IValueProvider, responsible to extract the value from the HTTPRequest.


    public class FromBodyBinding<T> : IBinding
    {
        private readonly ILogger logger;
        public FromBodyBinding(ILogger logger)
        {
            this.logger = logger;
        }
        public Task<IValueProvider> BindAsync(BindingContext context)
        {
            // Get the HTTP request
            var request = context.BindingData["req"] as HttpRequest;
            return Task.FromResult<IValueProvider>(new FromBodyValueProvider<T>(request, logger));
        }

        public bool FromAttribute => true;


        public Task<IValueProvider> BindAsync(object value, ValueBindingContext context)
        {
            return null;
        }

        public ParameterDescriptor ToParameterDescriptor() => new ParameterDescriptor();
    }


FromBodyValueProvider

This class implements the IValueProvider interface and is the responsible for extracting the object from the HTTPRequest. This is where we will use the type we got from the original parameter and used as a generic type for the FromBodyBinding class.


    public class FromBodyValueProvider<T> : IValueProvider
    {
        private HttpRequest request;
        private ILogger logger;

        public FromBodyValueProvider(HttpRequest request, ILogger logger)
        {
            this.request = request;
            this.logger = logger;
        }

        public async Task<object> GetValueAsync()
        {
            try
            {
                string requestBody = await new StreamReader(this.request.Body).ReadToEndAsync();
                T result = JsonConvert.DeserializeObject<T>(requestBody);
                return result;
            }
            catch (System.Exception ex)
            {
                this.logger.LogCritical(ex, "Error deserializing object from body");

                throw ex;
            }
        }

        public Type Type => typeof(object);
        public string ToInvokeString() => string.Empty;
    }


Linking Everything

The Azure Functions have evolved along the time. Some time ago, Azure functions used the interface IWebJobsHostBuilder on their startup function. Nowadays this interface was replaced by IFunctionsHostBuilder.

The old IWebJobsHostBuilder interface had a direct method to add the binding extension. On the other hand, the IFunctionsHostBuilder doesn’t. In order to solve this problem we need to use a strange workaround.

Once again, stackoverflow comes to the rescue. This link explains the workaround: https://stackoverflow.com/questions/57564396/how-do-i-mix-custom-parameter-binding-with-dependency-injection-in-azure-functio


        public override void Configure(IFunctionsHostBuilder builder)
        {
            string SqlConnection = Environment.GetEnvironmentVariable("SqlConnectionString");
            builder.Services.AddDbContext<VotingContext>(x => x.UseSqlServer(SqlConnection));


            // IWebJobsBuilders instance
            var wbBuilder = builder.Services.AddWebJobs(x => { return; });

            // And now you can use AddExtension
            wbBuilder.AddExtension<BindingExtensionProvider>();
        }


Using the Binding in a Function

The code below is an example of how to use the binding we created in a function.


        [FunctionName("Voting")]
        public async Task<IActionResult> RegisterVote(
            [HttpTrigger(AuthorizationLevel.Function, "post", Route = "Sessions/Vote")]
            HttpRequest req,
            ILogger log, [libTools.Bindings.FromBody] VotesRecord votes)
        {

        }


Conclusion

It’s always a good practice to create and re-use tools to make our code more high-level, I hope this will help to improve your code. I published this custom binding on GitHub, feel free to improve it: https://github.com/DennesTorres/HttpBinding

The post Custom Binding for Azure Functions appeared first on Simple Talk.


from Simple Talk https://ift.tt/3s0Ayfl
via

Key insights from the 2021 State of Database DevOps survey

This is the fifth year that Redgate has surveyed IT professionals about their organization’s DevOps practices. Each year, the number of respondents increases, reaching 3,200 submissions this year. An interesting new topic to consider this year is how the Covid-19 pandemic affected DevOps practices.

Here are the some of the key insights found in the report:

Among software delivery performance clusters, Elite and High performing groups are more likely to have implemented DevOps and database DevOps practices.  

The performance metrics used to classify performance clusters were defined in the 2019 Accelerate State of DevOps Report. The Elite group had the highest rate of DevOps adoption at 43%, correlating high performing organizations with DevOps. On the other hand, the Elite group was also the highest group to have no plans to adopt DevOps over the next two years at 15%. The lowest performing group reported 20% DevOps adoption and 10% with no plans.

On average, Elite performers are considerably faster in delivering database changes 

Over 30% of Elite performers report multiple database deployments per day. That’s more than twice the rate of any of the other groups. The next group, High performers, were most likely to report that they deploy databases changes once per week.

While frequent database changes may make DBAs nervous, small frequent changes are less likely to fail than large infrequent changes. Even though Elite performers report the most frequent changes, they also report the lowest percent of deployments requiring a hotfix of any of the groups. Even though Elite performers report the most frequent changes, they also report the lowest percent of deployments requiring a hotfix of any of the groups. Elite performers also report that they are more likely to follow best practices, automate processes, and use tools.

Cloud adoption showed a drastic acceleration with only one in five respondents saying they are hosting databases only on-premises. 

Only 20% of respondents reported that they were all on premises in this survey with 15% reporting that they were all cloud. Smaller companies were more likely to be all cloud at 25% as were Elite performers at 22%.

We saw a significant rise in estates with diverse database technologies, from 61% in 2020 to 70% in 2021, with 48% having three or more different databases in use. 

Among the respondents, over 80% used SQL Server which was by far the largest reported. However, while proprietary databases are still popular, NoSQL and cloud databases are being adopted more frequently each year.

Overall, the Covid-19 pandemic has had only a moderate impact on performance and productivity for most IT teams. In fact, with remote working, individual productivity has actually improved for the majority (63%). 

Many organizations had to switch to remote working without much notice. It’s possible that many IT individuals saw improved productivity since they may have already been set up with laptops and VPN access due to on-call support. Others may have seen less productivity due to kids’ remote schooling and decreased ability to collaborate with team members.

The large majority of respondents (68%) expect the budget for database management and tooling to stay at least the same or increase in the next 12 months, indicating the importance of it within the overall IT strategy. 

Lack of budget is mentioned in the report as a barrier or challenge to implementing DevOps. On the other hand, 68% of respondents state that budgets for database management and development will stay the same or increase in the next year. That’s good news as tooling is critical for DevOps.

Thank you to those of you who participated in this year’s survey. You can download a copy of the report here.

Commentary Competition

Enjoyed the topic? Have a relevant anecdote? Disagree with the author? Leave your two cents on this post in the comments below, and our favourite response will win a $50 Amazon gift card. The competition closes two weeks from the date of publication, and the winner will be announced in the next Simple Talk newsletter.

The post Key insights from the 2021 State of Database DevOps survey appeared first on Simple Talk.


from Simple Talk https://ift.tt/3u0Pqfl
via

Thursday, February 11, 2021

IronPython: First steps

Python is one of the most popular languages for many reasons. Julio Sampaio explains how IronPython allows you to integrate Python with your favorite .NET language.

Have you ever imagined integrating some Python code along with .NET? This idea goes a bit beyond the possibility of creating Python code within Visual Studio, although that’s an important step towards such a goal. IronPython is a way to accomplish this integration. It is an open-source implementation of the Python language to allow closer integration with the .NET Framework.

IronPython works as an extension to the .NET Framework, but it can also be used by .NET projects to take advantage of Python’s scripting power. Other than that, since IronPython is a real implementation of Python itself, there’s no need to learn a new language or extra features if you already know Python.

This article explores the language and teaches how you can benefit from its integration with .NET.

Setup

There are a couple of ways to install it. If you aim to use IronPython standalone in projects other than those in Visual Studio, you can download and install it. Examples in this article use the 2.7.11 release, but the examples should work well with the latest version.

Go to the GitHub download page, and click the MSI installer to download it. I’m assuming you’re following this tutorial from a Windows OS. Visual Studio still has no support for adding Python extensions on macOS, for instance.

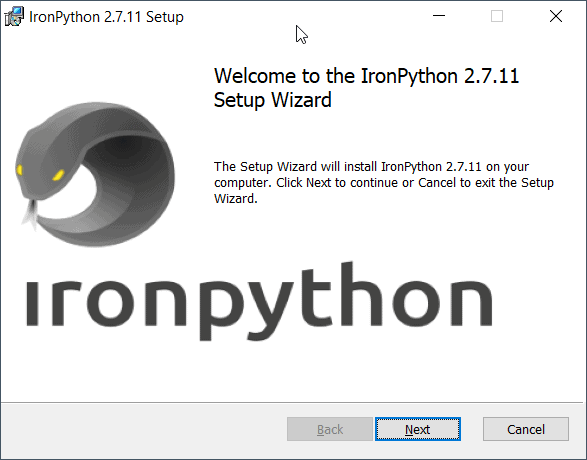
Run the installer and follow the steps until the end.

IronPython setup wizard

Figure 1. Installing IronPython on Windows.

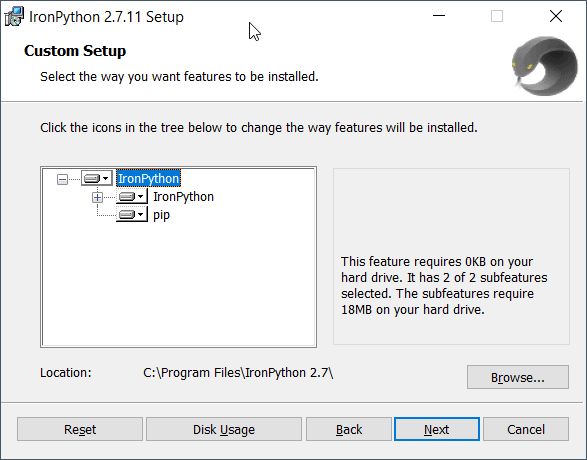
During the process, you may notice a screen that shows the Python versions being installed (Figure 2). It comes by default with Python’s IronPython language, along with the pip (package manager for Python).

IronPython setup

Figure 2. Selecting the IronPython features.

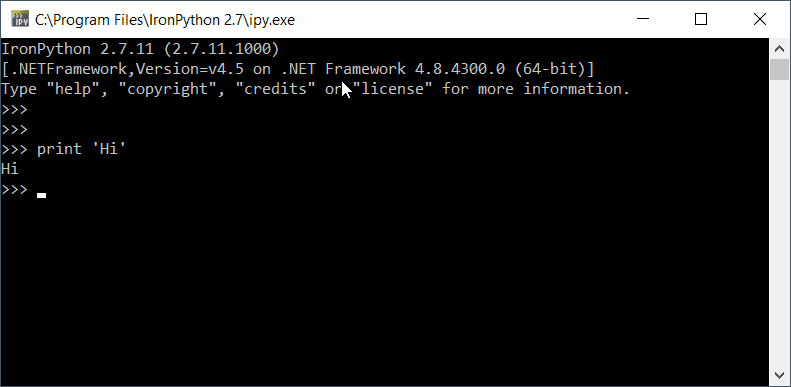
Make sure to browse for the installation location shown in Figure 2 if you won’t use the default one. After the process is done, you can go to the specified folder and run the file ipy.exe. It represents the command line interface from which you may run your IronPython commands.

Run it, and check in Figure 3 how the interface looks.

check the interface

Figure 3. IronPython command-line shell.

It is also a REPL, which allows you to execute interactive Python code to try it out. Do it as you please.

Alternatively, you can also download IronPython binary files, extract them and access the executor via the command line. We’ll stick, however, to the installer-based version which is more concise and straightforward.

WinForms with IronPython

Now that you have the environment set up, it’s time to learn what IronPython is capable of doing. Perhaps one of the best ways to prove its interoperability with .NET is through the construction of some WinForms.

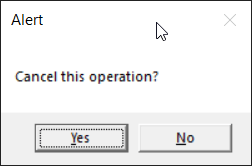
To see this in action, you will create a simple MessageBox to display a message window and two buttons: Yes and No. Figure 4 illustrates how the box is going to look .

MessageBox with IronPython

Figure 4. A MessageBox built with IronPython.

Each operation is going to run some Python code to perform different actions. You can find the code for this in Listing 1.

Listing 1. Creating a box with action buttons.

import clr
clr.AddReference('System')
clr.AddReference('System.Windows.Forms')
import System
import System.Windows.Forms as WinForms
message = "Cancel this operation?"
caption = "Alert"
buttons = WinForms.MessageBoxButtons.YesNo
result = WinForms.MessageBox.Show(message, caption, buttons)
if result == WinForms.DialogResult.Yes:
    WinForms.MessageBox.Show("Great, it's canceled!")
    System.Console.Write("Success!")
else:
    print "Sorry, something went wrong!"

If you’ve coded with Python and C# before, this code may look weirdly familiar.

The starting point of any mixed code with IronPython starts with its CLR module (the common language runtime). It allows a deep integration between both languages. With it in hand, you can add as many references as you want, such as the System and the Windows Forms.

Take note of how the whole coding experience is Python-based, and only Python. This includes the imports, the variables, the code indentation, the conditional statements, etc.

Once you add the .NET references, you’re allowed to use them throughout the code as real Python objects. The methods, types, parameters, and results also apply, so be careful. Also, pay attention to the body of the if condition. In case the user selects the option “Yes”, another message box is displayed along with a logline coded in C# via System.Console. Otherwise, the negative log is displayed but this time via Python’s print function. Cool, isn’t it?

Save the code to a file called Hello.py into the same folder that IronPython is installed. Then, open a standard command line (cmd), navigate to the IronPython root folder:

cd C:\Program Files\IronPython 2.7

Then run the following command:

ipy.exe Hello.py

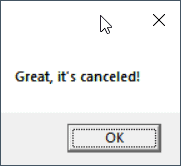
The execution triggers the message box shown in Figure 4. Go ahead and test both the buttons. Figure 5 shows what happens after clicking the Yes option.

Figure 5. Message box opened after Yes option-click.

The image above will be followed by the message “Success” logged in the console.

Dealing with generics

Generics are an important part of Object-oriented programming, and IronPython allows its usage along with some Python code. Take the classic example of Collections. They represent one of the most traditional uses of generics in C#. Check out the code presented in Listing 2.

Listing 2. Dealing with Generics in IronPython

from System.Collections.Generic import List
items = List[str]()
items.Add('Item A')
items.Add('Item B')
items.Add('Item C')
for item in items:
 print item

Note how array-like this syntax is. Yes, you can provide IronPython with generics just the way you access array indices. If you try to add anything other than strings, like shown below:

items = List[str]()
items.Add(123)

A corresponding error will be thrown:

Traceback (most recent call last):
  File "Hello.py", line 3, in <module>
TypeError: expected str, got int

Object-oriented programming

OOP is another crucial part when it comes to C# development. Among its many facets, being able to create classes (along with attributes and methods) and instantiate objects is also possible in IronPython. To demonstrate, change the content of your Hello.py file with the code shown in Listing 3.

Listing 3. Example of a C# class in IronPython

class Person:
    name = 'John Silva'
    age = 12
    email = 'john@email.com'
    
    # setters
    def setName(self, name):
        self.name = name
    def setAge(self, age):
        self.age = age
    def setEmail(self, email):
        self.email = email
        
    # getters
    def getName(self):
        return self.name
    def getAge(self):
        return self.age
    def getEmail(self):
        return self.email
    def getInfo(self):
        print "Hi! I'm ", self.name, ", I'm ", self.age, "years old and this is my email: ", self.email

Pretty simple. There’s just a couple of attributes and getters/setters for each. To make use of this class, you’d have to import it within another Python file. However, to simplify it, open another command line window and cd into the folder where the Hello.py file is located. Then, execute the command below in order to let ipy notice that specific class:

ipy Hello.py

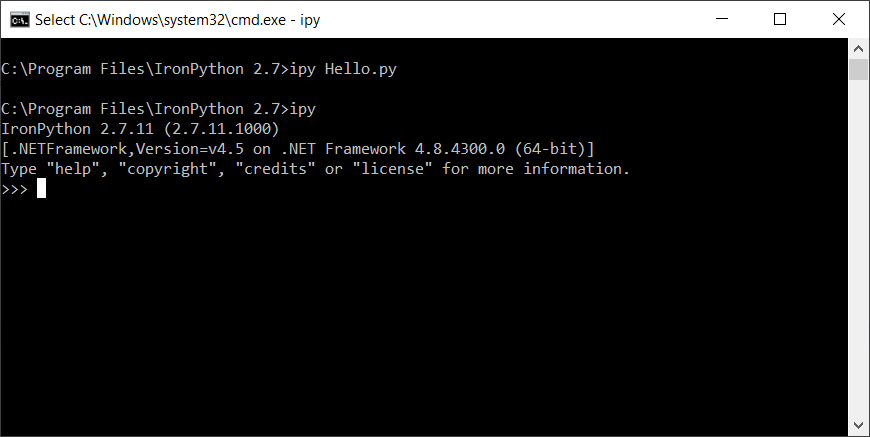
Now, it’s time to enter into the interactive mode. Just hit the ipy command for that, and the terminal must change to how it is shown in Figure 6.

Figure 6. IronPython interactive mode.

Then, you can run some interactive code exploring the Person class previously created. Type the following code lines directly to the new shell window:

import sys
sys.path.append('C:\Program Files\IronPython 2.7')
import Hello

Make sure to change IronPython’s path with yours. Finally, play with it by creating a person object and calling its methods:

person = Hello.Person()
person.getInfo()
> Hi! I'm  John Silva, I'm  12 years old and this is my email:  john@email.com

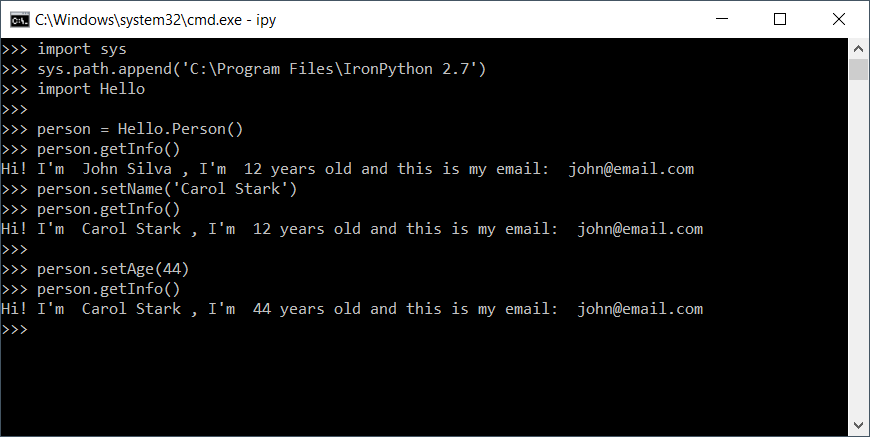
Figure 7 shows a bit more of the options you can base at.

Figure 7. Playing with Person object’s methods in IronPython.

What else can you do with IronPython?

IronPython can work for many of the .NET facets, such as ASP.NET web applications, APIs, data science, etc., but it’s been more widely used for desktop application development.

There used to be an IronPython Studio to integrate with Visual Studio 2008. However, time and maintenance have proved too difficult to keep up with. Today, you can add IronPython’s dependencies to your .NET projects via NuGet, especially if you’re working with Visual Studio.

It’s important to note that IronPython has been around for quite a long time, and still, the team has been working to maintain and update it. The documentation is not complete, but it’s enough to make some grounds when getting started. Additionally, the classic book IronPython in Action is a must-read if you’re willing to understand more about its capability.


The post IronPython: First steps appeared first on Simple Talk.


from Simple Talk https://ift.tt/3ac1PW8
via

Tuesday, February 9, 2021

Visualizing a set of SQL Server Graph tables by generating TGF Format

In my last blog, I built some Powershell to take a graph that I had modelled and bring that into SQL Server in a format that could be imported into SQL Server node and edge tables. I have started on a tool to take that imported data and create a set of graph tables to test with, but to test that process, I found it kind of important to be able to visualize a graph to make sure it worked! I considered using a rich format like Arvind Shyamsundar dis in his blog: (https://deep.data.blog/2017/11/03/how-we-did-it-pass-2017-summit-session-similarity-using-sql-graph-and-python/) by outputting GraphML, but that was kind of overkill since every time I import a set of nodes, I will have to reformat anyhow. It turned out to be much easier to build generic code using TGF (Trivial Graph Format) just like in my export example. Another goal of mine is to make this tool to work with any graph in SQL Server (I am currently building an some code to do just that to categorize geographies, so this is a double win) so I used dynamic SQL as the basis, so I could pick and choose the node and edge tables, plus dynamically set a column for the nodes to display. (A future enhancement will be to include a filter on the node value so you can just see how a few nodes are related.)

I did some searching for some sample graph data in SQL Server objects, and I found this example on the docs.microsoft.com site. It contains a complete database with 3 nodes and 3 edges that gave me something to output. This code should work on 2017 or 2019 equally well.

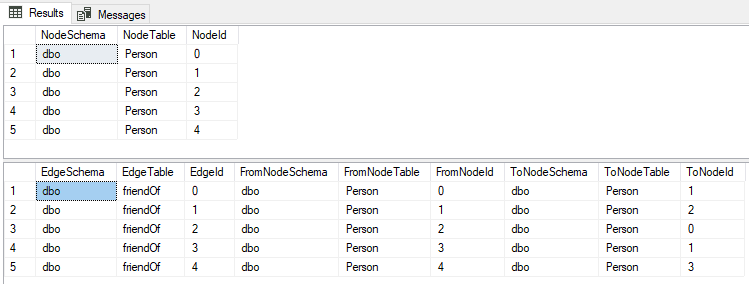
It is a quite a bit of code, none of it super interesting for including directly in the blog, except the base of the code using the JSON metadata values that is a part of the structure of the SQL Server objects. Since an edge can connect any number of nodes, you use these values to know what you can join to and from:

SELECT  JSON_VALUE(CAST($node_id AS nvarchar(1000)),'$.schema') AS NodeSchema, 
                JSON_VALUE(CAST($node_id AS nvarchar(1000)),'$.table') AS NodeTable, 
                JSON_VALUE(CAST($node_id AS nvarchar(1000)),'$.id') AS NodeId
FROM   dbo.Person; --A node

SELECT 
                JSON_VALUE(CAST($edge_id AS nvarchar(1000)),'$.schema') AS EdgeSchema, 
                JSON_VALUE(CAST($edge_id AS nvarchar(1000)),'$.table') AS EdgeTable, 
                JSON_VALUE(CAST($edge_id AS nvarchar(1000)),'$.id') AS EdgeId, 
                
                JSON_VALUE(CAST($from_id AS nvarchar(1000)),'$.schema') AS FromNodeSchema, 
                JSON_VALUE(CAST($from_id AS nvarchar(1000)),'$.table') AS FromNodeTable, 
                JSON_VALUE(CAST($from_id AS nvarchar(1000)),'$.id') AS FromNodeId, 
                JSON_VALUE(CAST($To_id AS nvarchar(1000)),'$.schema') AS ToNodeSchema, 
                JSON_VALUE(CAST($to_id AS nvarchar(1000)),'$.table') AS ToNodeTable, 
                JSON_VALUE(CAST($to_id AS nvarchar(1000)),'$.id') AS ToNodeId
FROM  dbo.friendOf; --An edge

The output of this query is:

Each node object has its own surrogate key values that start at 0, so if you are going to use the code for more than one node at a time, you have to make the surrogate values unique for the TGF file (see the last blog on importing for more details on that). In the code I make a temp table to stage the objects, so if you have > 1 node, the second set of keys need to start off where the previous ones left off. So the code uses an identity column, and joins to that identity column by schema, table, and edgeId, outputting the unique key:

The code has a few things to choose in the header. The database, a list of nodes and edges you want in the output (for example, you might wish to graph just persons through the friendOf edge (example later)). There are a few default node and edge type values that control if matching labels or node types are appended to the graph.

USE GraphDemo
GO

--parameters values for this database: https://docs.microsoft.com/en-us/sql/relational-databases/graphs/sql-graph-sample?view=sql-server-ver15
--list of nodes in format schema.nodetable.nameForLabel;schema.nodetable.nameForLabel;
--done this way because it is a lot easier to manually edit
DECLARE @NodeList nvarchar(4000) = 'dbo.person.name;dbo.Restaurant.name;dbo.City.name';

--list of edges in format schema.edgeTable
DECLARE @EdgeList nvarchar(4000) = 'dbo.likes;dbo.friendOf;dbo.locatedIn;dbo.livesIn';

--used to determine formatting of name in output
DECLARE @DefaultNodeType nvarchar(100) = '?'; --I want them all to have the node type appended in parens
DECLARE @DefaultEdgeType nvarchar(100) = '?';
DECLARE @LabelNonDefaultEdgeFlag bit = 1;

You can find the actual code here from my github repository: https://github.com/drsqlgithub/TGFImport/blob/main/OutputToTGF.sql.

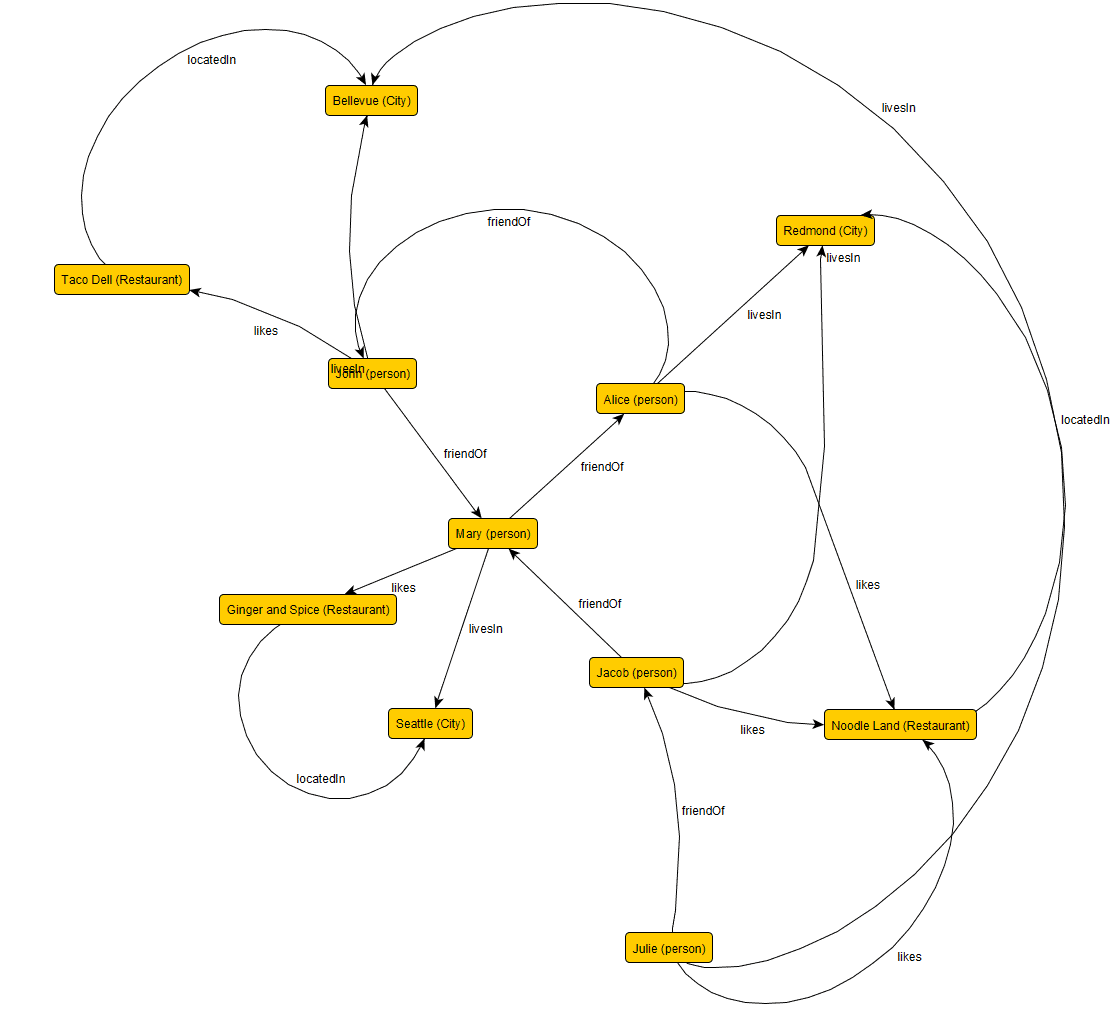
Using the parameters above (and the ones that are in the file), the output of my code from the database from the Microsoft demo script is:

outputValue
-----------------------------------
1 Bellevue (City)
2 Seattle (City)
3 Redmond (City)
4 John (person)
5 Mary (person)
6 Alice (person)
7 Jacob (person)
8 Julie (person)
9 Taco Dell (Restaurant)
10 Ginger and Spice (Restaurant)
11 Noodle Land (Restaurant)
#
4 5 friendOf
5 6 friendOf
6 4 friendOf
7 5 friendOf
8 7 friendOf
4 9 likes
5 10 likes
6 11 likes
7 11 likes
8 11 likes
4 1 livesIn
5 2 livesIn
6 3 livesIn
7 3 livesIn
8 1 livesIn
9 1 locatedIn
10 2 locatedIn
11 3 locatedIn

I chose to label all of the node types, and all of the edges. Saving this output (without the header) as a text file with a TGF extension, you can open and then importing into yEd (a free tool), you see this:

TGF files have no formatting (and how would you include formatting from a set of SQL Server objects anyhow), so you need to use the tools to format the diagram. There are two steps to make a good looking diagram reasonably quick.

Use the Tools\Fit Node to Label menu. This will make the nodes sized so that the text is not hanging over the edge.

Then use one of tools in the Layout menu to output your diagram. I find the radial format works pretty good for semi complex, highly connected data. Keep in mind that any model is going to get complex to render (or even hand draw) fast. Radial put out a model that looks like:

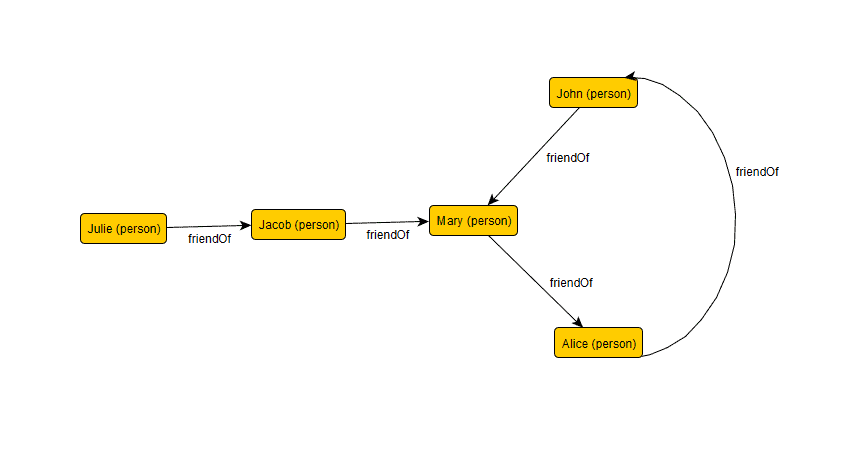
If you only want a single node and edge, you can just set a couple of nodes, like here the subgraph of person and friendOf:

DECLARE @NodeList nvarchar(4000) = 'dbo.person.name';
DECLARE @EdgeList nvarchar(4000) = 'dbo.friendOf';

The output is lets you see the following subgraph showing you who is friends with whom without the other noise::

It does kind of make me think about the name “friendOf”. Is friendOf a good name for a relationship that can be onesided? Not sure, but I did compare the data and this query:

SELECT Person.Name, 'FriendOf', Friend.Name AS FriendName
FROM Person, dbo.friendOf, Person AS Friend
WHERE MATCH(Person - (friendOf) -> Friend);

Outputs the following:

Name               FriendName
--------- -------- --------------
John      FriendOf Mary
Mary      FriendOf Alice
Alice     FriendOf John
Jacob     FriendOf Mary
Julie     FriendOf Jacob

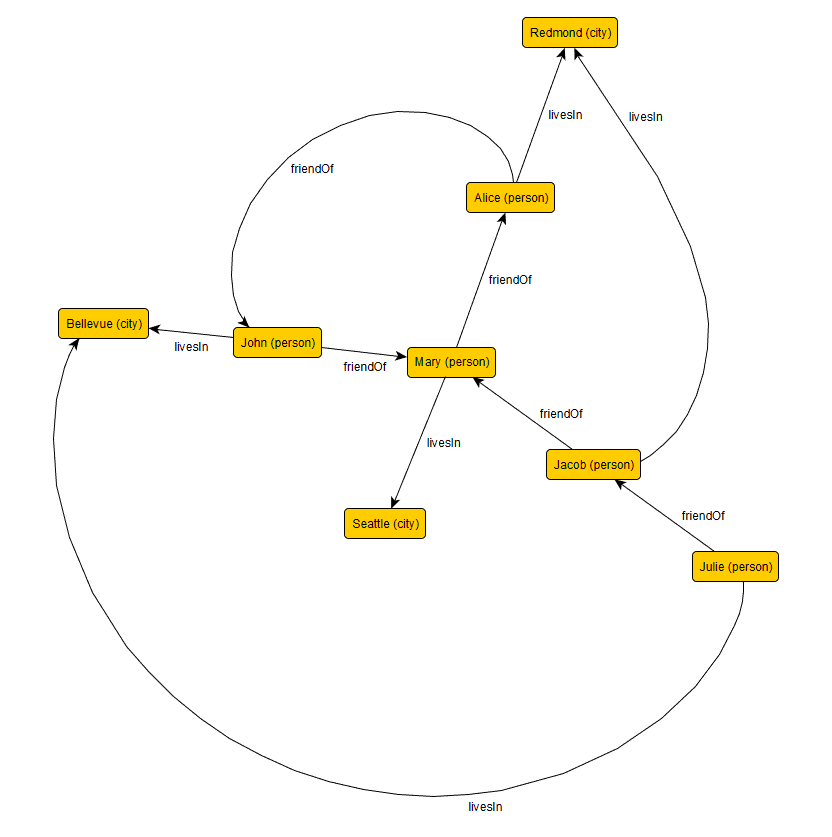
Or you might want to see person and city, with just the edges friendOf and livesIn. Note that you will only see edges that go from person to person, city to city, or city to person (or person to city):

DECLARE @NodeList nvarchar(4000) = 'dbo.person.name;dbo.city.name';
DECLARE @EdgeList nvarchar(4000) = 'dbo.friendOf;dbo.livesIn';

This outputs the following graph diagram:

Hopefully this will help you if you are trying to draw up some sample data and you want to check to see the relationships graphically.

The post Visualizing a set of SQL Server Graph tables by generating TGF Format appeared first on Simple Talk.


from Simple Talk https://ift.tt/2LwFjNY
via

Friday, February 5, 2021

Recruiting DBAs for DevOps

Experienced DevOps professionals have the responsibility to assimilate new people into the movement. DBAs coming on board need to understand (and possibly be convinced) that DevOps is about improving and quickening a continuous flow of software or web service improvements designed to provide a richer customer experience, abounding with excellent performance and extreme availability. DBAs need to change many habits to blend traditional work into the DevOps model. This article examines recruiting DBAs for DevOps.

DBA “Undersight”

DBA work has been a “black box” for too long that can seem like “magic” to everyone else. Reality shows that DBA scripts, database performance configuration changes, login triggers, and other DBA outputs are not scrutinized enough nor managed properly. The change advisory board (CAB) team may ask a question or two about why the change is needed, but many CAB members probably do not have the required knowledge to question the change enough to understand the potential harm. I hear what you are thinking, “The CAB does not have the technical experience to interrogate most changes.” I agree, but I also maintain the position that the CAB members see fewer database changes (compared with application changes) and fail to realize that database change mistakes tend to lean toward catastrophic. I believe it’s because the CAB should not be evaluating changes. The product owner and DevOps team members should know when to deploy because they intimately know the readiness of the code, understand the consequences of failure, and are working the backlog based on value. DevOps protects the teams from consequences if the teams abide by the mandates to excessively test to code and never allow a defect to be deployed into production. DBAs and DevOps team members surely agree to this value proposition, not needing oversight for releases. You’ll have to persistently engage the DBAs to shift expectations in order to incorporate their work into the release cycle.

“Bridg-ers”

Although DBAs fortunately have the rare ability to bridge the gap between development and operations, they have been detrimentally overlooked in many companies that deploy DevOps practices. A DBA’s ability to interrogate code and construct a resilient, well–performing database environment uniquely defines the capabilities needed for DevOps. DevOps requires transformation from organizational silos defined by a technology skill set to process-driven, continuous flowing work streams that are empowered by collaboration and automation. DevOps is about speed, delivery time, continuous integration and deployment, release cadence, and superior customer experience. Although metrics are critical for measuring customer experiences such as application responsiveness, they are also needed to measure release success rate, software defects, test data problems, work, and more. DBAs tend to be strong technical leaders who provide insight into coding best practices, host platform configurations, database performance improvements, data security and protection. To be successful, DBAs have to communicate, collaborate, teach, and learn while continuously improving database performance and availability. The job often includes having to meet with development to discuss poor performing code, index requirements, or execution plans to recommend code remediation. These “normal” interactions are imperative to the success of DevOps, leaving me perplexed about why DBAs were not one of the first operations team members asked to join the DevOps movement.

Transition

Understanding that DBAs are “built” in significantly different ways should help with the approach. Many DBAs were once developers, others came from various infrastructure roles, and still others have always been DBAs. Determining which DBA type is easier to bring into the fold is a fool’s game. DBAs are people, and people are surprisingly unpredictable. One ex-developer DBA may be excited to finally be able to use both skillsets to help advance DevOps, whereas another may be perturbed by having to dig up old skills she had hoped were long dead and buried. Individually interviewing and evaluating each DBA may be necessary. Much like interviewing potential employees, discernment is needed to assess fit, training needs, and potential disruptive factors that may impact the existing DevOps team members. The right leaders and SMEs need to be involved and dedicated to the time and effort needed to integrate DBAs. Rest easy; the good news is that even if some DBAs may resist, they all want to provide value by improving the environment. Besides, as you start to expand participation in DevOps, you already have a handful of people in mind to make the voyage smoother. You know who I’m talking about. Yes, the ones you see talking to the development teams on a regular basis, checking in to see how things are going, seeing what changes are coming down the pipe, asking what the application users are saying about performance, and even offering to assist as needed. These people should be your initial picks to join the DevOps team. Specifically, you should find DBAs who are already engaged, bring them on board, and then let them help you select and onboard other DBAs when needed. Having a trusted and respected DBA doing the team’s bidding for additional DBA talent is likely to result in volunteers. People want to work with people with whom they have an established relationship. Leverage previous successful working relationships to resourcefully construct the DevOps team.

Reciprocal Teaching

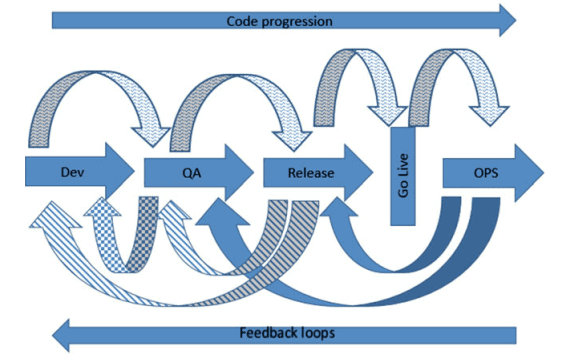
Whether through formal methods such as classroom or virtual training, job shadowing, and mentoring; or through informal methods such as team discussions or presentations, teaching needs to be a frequent element of team integration. It is a given that IT and business teams have difficulty understanding each other without a common taxonomy. Even teams within IT often fail to understand each other. A developer discussing encapsulation or inheritance may totally perplex a DBA unfamiliar with object-oriented programming terminology. Never mind if you start talking about Agile, which is very new to many IT professionals. Likewise, a DBA ranting about developers “thrashing” the buffer cache is likely to see the “deer in the headlights” stare. While investigating a performance issue specific to a screen, a developer shared with a DBA that the drop-down window would display ten data elements from which the application user could select. As they looked at the code and then tested the code in a non-prod environment, they learned that the result set was millions of records. The million records would move from the database to the middle tier, and then the needed to rows would be pushed to the client application screen. When asking why millions of rows were being returned, the developer said that was a standard practice. After looking into other queries, the DBA soon found herself ranting to several development managers about the developers thrashing the buffer cache and the performance impact. After realizing that these managers did not understand DBA “technical” jargon, she determined that there was a better way to communicate the message. She scheduled a meeting a few days later, in which she put together a presentation deck outlining basic buffer cache concepts with visuals (see Figure 1) that demonstrated how large result sets can negatively impact not only the query requesting the data but also every aspect of the database performance. After the DBA spent an hour walking the developers through the presentation and answering questions, these developers understood the impact of less-selective queries. As days and weeks passed, and often when the DBA was visiting the developer realm, developers would jokingly remind each other to not thrash that buffer cache unless they wanted the DBA to get after them. Although the training was succinct and simplified, it closed the language gap, resulting in improved query selection criteria, smaller result sets, and less buffer cache “thrashing.” The point is that even people in the same industry do not necessarily speak the same language. DevOps introduces another language gap that requires purposeful definition to keep all members of the team aligned. This book presumes that readers are technically savvy and already familiar with DevOps and the core terminology, but it may not be true as they begin working with DBAs. Accelerating DBA engagement requires DBAs to understand the DevOps principles and foundational constructs. Experienced DevOps team members need to educate DBAs on processes, continuous integration and delivery, and the implemented toolset. Demonstrating how code is built, tested, integrated, and released helps DBAs determine where best to interject changes supporting the code cycle. DBAs also need early notification when system changes are necessary, allowing time for the reconfiguration to be completed, tested, security approved, and automated for pipeline consumption.

Buffer cache thrashing Recruiting DBAs for DevOps

Figure 1. Buffer cache thrashing

Molding DBAs

Adding DBAs to Dev Ops teams gives the DevOps team members the opportunity to “mold” the DBAs. Previous challenges of getting a DBA to even consider a nonrelational database solution becomes an opportunity for the DBA to learn new database technologies. Just climbing over the fence gives new perspective. Once DBAs buy into DevOps, learn the processes, and fully understand how database work can benefit the business, instead of the development team (the previous customer), the pipeline expands from database change introduction, growing the code base as DBAs check in database changes and infrastructure as code templates and scripts. Cycle time shrinks from database changes no longer being an outlier to the process. Deployments smooth out and complete faster as DBA work is automated.

DBA Value Proposition

DBA participation in DevOps draws in a critical application availability and performance contributor: the database. Involving DBAs means that application code is evaluated from a different perspective, especially calls to the database. Database changes become integrated code for continuous integration and exhaustive testing. DBAs can identify poorly executing queries and transactions and baseline production performance. They can get ahead of forthcoming code changes or new functionality by understanding the impact on the preprod environments, which gives DBAs time to analyze and implement performance-tuning enhancements before the additional load is present. Problems become challenges for a larger team, compiling more experiences and skills into the pool of contributors to determine root cause and deploy mitigation. DBAs’ experiences in other infrastructure areas add another layer of value by being able to assess the application and database by looking under the covers at the operating systems, storage, and network. Further discussion is ahead. Closer and constant DBA and DevOps team collaboration improves product outcomes, stability, security, and performance, which lead to happier customers and improved business results. As DBAs better understand the business team’s use of the product, building a disaster recovery solution or recovery from backup strategy can be customized Giving developers the freedom to fire up virtual hosts with different database options enables consideration of risk early in the process. A developer wanting to test a new data access service can test, retry, and destroy the virtual host to start over with a fresh host if necessary. DBAs scripting different template options applicable to different data platforms shifts experimentation from production too early in the pipeline.

Recruiting DBAs for DevOps

DBAs are a good match for DevOps. Driven to improve performance, reliability, and system stability; and matched with the skills to adapt, analyze, and execute process improvements, DBAs can expand the DevOps team’s capabilities; reduce cycle time by pulling database changes into the continuous integration process; contribute new test cases for improved bug detection; and get ahead of performance, load, and other operational challenges before production impact. By investing in DBAs joining DevOps teams, DevOps leaders and engineers increase influence and impact on the business. Applying proven DevOps processes to database changes, build templates, database selections, and broader platform considerations presents new opportunities that may have been previously resisted by the same DBAs. DBAs get excited when their contribution can grow, they can grow, and the business can grow.


This article is an excerpt from DevOps, DBAs, and DBaaS – Managing Data Platforms to Support Continuous Integration printed with permission by Apress Publishing.

If you liked this article, you might also like Ten tips for building a collaborative DevOps culture.

The post Recruiting DBAs for DevOps appeared first on Simple Talk.


from Simple Talk https://ift.tt/3jgQpmG
via