Friday, December 20, 2019

Database Security, People and Processes

Database developers and DBAs can use many “mechanical” security mechanisms to safeguard corporate data. Robert Sheldon has written an excellent six part Introduction to SQL Server Security covering most of them. However, DBAs know that these alone are not enough, because they cannot fully secure data while ignoring human frailties: they should not merely operate a hermit kingdom.

No matter how good the mechanical security, the corporate database is vulnerable to the people and processes within the organization. Often the risks of breaches to sensitive data come not through intention or malice, but ignorance or expedience.

It is easy to deal with ignorance, but the lure of expedient decisions can be harder to resist. They are, by definition, a convenient way to deliver the desired results, in the short term, when it feels like the detrimental consequences don’t matter. It is, for example, tiresome for people to have only the ‘minimum required’ permissions to access the data, just enough for the role they are supposed to fulfil. How much more convenient it would be for a member of staff to have an elevated level of access. What could go wrong?

To meet the demands of society for the curation of personal data, and the vital need of a business for the security of its data, security must take precedence to convenience. Any expediency in dealing with matters of data curation and security must be cleared with the business, even when it is legal. It must be an explicit business decision at a senior level because it comes with a quantifiable risk in monetary and reputational terms.

Addressing ignorance

The key to dealing with a lack of knowledge about data curation and security is to ask questions.

What information do I need in order to be able to secure the data resource for which I am responsible and accountable?

Where is that information within the organization?

Who are the stewards of that information?

Am I a steward of any information that would help other employees to secure the resources for which they are responsible and accountable?

How can I, as a steward, keep others up to date with the information they need?

Is the data for which I am responsible secure, and how can I be sure?

The answers to these questions provide a checklist that should form part of an operational playbook, to be applies at the start of any new project or business initiative. These checklists and playbooks will ensure the consistency and completeness of a security assessment. The checklists are auditable artifacts that demonstrate compliance with organizational security policies. Under EU GDPR Article 35, organizations handling personal data are compelled to carry out a Data Protection Impact Assessment (DPIA). There will be a large overlap between the organizational security assessment and the DPIA. The UK information commissioner’s office provides handy checklists for awareness, screening, process and evaluation of DPIAs.

Communication and collaboration

Data curation requires that data is kept secure, that only the people who should access the data can do so, and that only the data that they need for their role is provided to them. It also requires information integrity. Is the data correct, can it be checked and corrected if necessary, and is it properly disposed of when no longer needed?

Data security and information integrity are closely linked, and they are both team sports. An effective data security regime needs communication and collaboration between technical and non-technical functions within the business. This is far easier in an Agile/DevOps culture, where a team should already comprise of most of the disciplines needed for that team to operate autonomously, although there will always be a few specialist functions that need to be accessed from outside the team. Rather than be embedded in a team, these specialist functions will work generically across teams. Examples of these are HR, legal, risk and compliance.

Information integrity also requires reconciliation of information between those disciplines or functions. Each discipline or function validates the information it receives from every other discipline or function. The organization is required to know where all copies of data are held and why, and what steps are taken to ensure that it is correct. The officers of any organization are responsible for legal compliance.

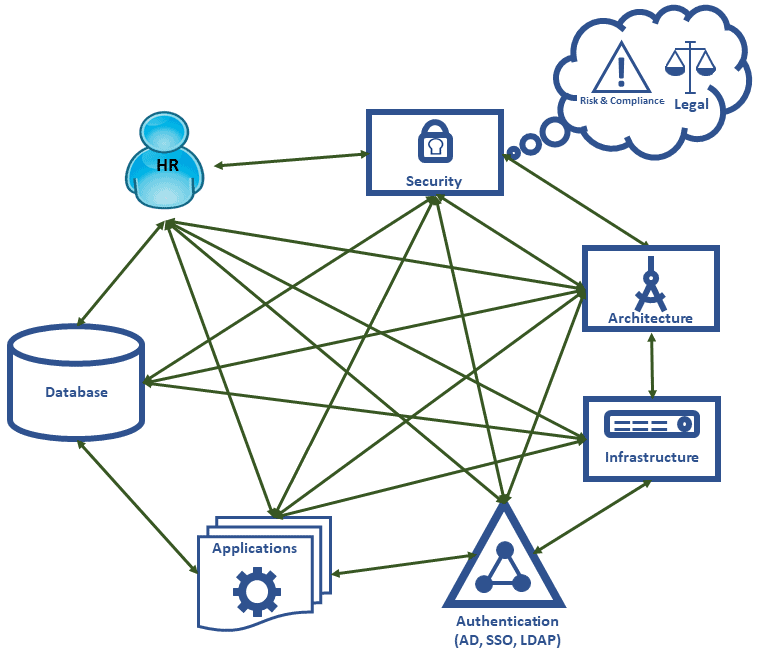
The diagram below focusses on the main communication paths necessary for a good security regime. The exact functions and boundaries may differ or blur from organization to organization. As a general principle every function shown in the diagram should be listening and talking to every other function. For simplicity’s sake, non-technical business functions are not represented (except for Human Resources).

For any of these functions, security by obscurity is not a good strategy. If the way in which information is secured is opaque, then it is as opaque to people who should be guarding that information as it is to those people we wish to guard against: possibly more so. We must consider what artefacts are useful to help each function build systems that are secure. The following table provides examples but does not represent a definitive list of useful security artefacts:

Artefact

Description

Employee directory

  • Current employees with their job roles
  • Organizational hierarchy
  • Data stewardship/ownership

Database roles and permissions documentation

A list of the database roles and what they are intended to represent. Thanks to Dr Codd’s rule 4 this does not have to be a static or offline document; it can be a dashboard or report driven directly from the database server.

Database access log

A facility to allow the analysis of patterns of behavior that are potential indicators of undesirable activity.

  • Who accessed the data?
  • Using what application?
  • When?
  • How much data was accessed?
  • From what location (geography, IP address)?
  • If data was changed then what was the change?

Data Catalog

  • Where the data resides
  • Business description of the data artefacts, down to the attribute level
  • Information type and sensitivity
  • Stewards and owners
  • Retention policy
  • Applicable regulations
  • Data lineage

Applications catalog

The current technical state of the organization:

  • Application versions and patch levels
  • Libraries and frameworks versions and patch levels
  • Authentication requirements
  • Infrastructure requirements
  • Database requirements
  • Service level agreements
  • Recovery time & point objectives

Active Directory structure

  • Active Directory groups and their intended purpose
  • Service account logins
  • Machine registrations

Network and infrastructure diagram

  • Subnets with their CIDR ranges,
  • Network access control lists (ACLs)
  • Security groups
  • Routing tables
  • Etc.

Architectural road map

Represents the future technical state of the organization. In effect this is what the future applications catalogue is intended to be.

Software vulnerability log

A collated list of software vulnerabilities for items in either the applications catalogue or architectural roadmap.

Security policies and procedures

Policies must be clear, unambiguous and written to help employees comply with any regulatory regime. These are most helpful when in the form of checklists or operational playbooks.

Having identified business functions and useful artefacts that will help those functions secure the information within the organization, we can now explore the roles each function plays in maintaining those artefacts.

Human Resources

HR are important actors in any security theatre. They are the first to know if an employee’s status has changed and they are privy to several items of information that are useful in securing data.

  • A list of current and active employees
  • A list of, and process for, starters, leavers and job changers. Mandatory for PCI-DSS and/or ISO27001 compliance.
  • A list of employees who are absent, sick or on holiday (ASH)
  • A list of employees on “Gardening Leave”
  • Organizational structure, job roles and line management

There must be a reconciliation process between HR’s records and the logins in the following systems:

  • Active Directory
  • Email systems
  • Databases
  • Applications including SaaS

Another important HR role in information security is to ensure that there is ongoing staff education. GDPR article 47 “Binding Corporate Rules” states that rules should specify that appropriate data protection training should be given to personnel having permanent or regular access to personal data. There must be dialogue between HR and the security and governance function to determine what form security training should take, and to provide an audit trail of who has had such training, the recency of that training, and the level of training provided.

As HR has access to some of the most personal of data, they must include themselves in any training. The other technical areas should be able to signal what training they require to ensure that what they build is secure.

It may be beneficial for HR to have the capability to deactivate user accounts given they will be the first to know if an employee has left the organization. It may also be judicious to disable logins when employees take annual leave or have extended periods of absence. This would not just be for security purposes but to help to safeguard the mental health of the employees on leave.

Development teams and infrastructure

The consequences of not having an application catalog were demonstrated back in 2003 by the SQL Slammer worm. Organizations with patched and up-to-date SQL Servers found their networks brought to a standstill by network traffic caused by the worm trying to propagate. Their suffering was caused by unpatched applications, of which they knew nothing, acting as attack vectors. If there had been a catalog, these applications could have been patched.

In an organization that has adopted a DevOps culture, most of the attributes mentioned earlier as part of an application catalogue are part of the software build. Practices that make the job of assembling such a catalog far easier, and even automatic, include:

  • Infrastructure as code
  • Configuration management
  • Continuous integration and delivery
  • Use of source control

A DevOps culture also addresses the consequences of involving network and infrastructure specialists too little and too late. Such late involvement threatens security because it means that the security infrastructure must be put together with avoidably imperfect knowledge, and in unnecessary haste.

Just as HR has a “starters and leavers” process, so an application catalog needs an “adopters and deprecators” process for the applications it holds. Applications need attention at all stages in their lifecycle. If an application is deprecated, then this represents an opportunity to reduce the attack surface area for the organization:

  • Removal of database logins for the application and possibly even databases
  • Removal of service accounts from Active Directory
  • Deprecation of infrastructure
  • Tightening of firewalls, network rules

Architects and architecture

In an Agile organization many of the disciplines that have traditionally been part of the architect role have been devolved, so they become part of the day to day tasks of the development teams.

Even so, it remains a primary duty of anyone aspiring to be an architect to control the technical diversity within an organization. The application catalog provides the means to monitor whether this is being achieved. For example, it will reveal that the organization is running multiple versions of the same application, library or framework, or ‘different’ libraries or frameworks that do more-or-less the same thing.

All complex systems have vulnerabilities. If you are using three ORM frameworks, then you have three sets of vulnerabilities to worry about. You also limit your internal pool of expertise to help address those vulnerabilities.

There is a cyclic relationship between the architectural roadmap and the applications catalog:

  • Architects use the applications catalog to form an architectural roadmap for the organization and to help design and plan future systems.
  • When implementing the architectural roadmap, much of the underlying detail that emerges should propagate through to the applications catalog.

The roadmap will also inform all parties as to what training needs to be incorporated into the plan.

Discussions regarding security tend to focus on blocking illegitimate activity. However, security also means ensuring that legitimate activity continues to take place. The architects also need to think about what performance metrics need to be available to ensure that applications, database and infrastructure folk build a system that is both secure and reliable.

Security and governance

In a post GDPR world, a new business idea may seem to be technically easy to execute, but will be on shaky ground, or maybe even quicksand, regarding laws and regulation.

  • Does the proposed feature depend on personal data that the organization has consent to use?
  • Is the data required for the feature necessary for the organization to carry out its primary business?

This is one of the reasons that a security and governance function inevitably has a proactive role. They must be subject matter experts advising on how to avoid introducing vulnerabilities and explaining what is required to implement good security practice.

GDPR article 25 requires us to build in data protection by design and default. It is far easier to build secure systems when security is a foundation stone of the design. You are likely to create more problems than you solve by attempting to secure something in retrospect.

Once again, the importance of an applications catalog, as well as a data catalog, becomes apparent. Its importance is in the detailing of the applications, libraries and frameworks in use within the organization and the versions and patch levels for each.

A fundamental duty of the security and governance function is to keep up to date with threats and vulnerabilities that might affect the organization, such as those arising from:

  • Software used by the organization, whether it be apps, libraries or frameworks
  • Tools and techniques that can invalidate security safeguards.
  • Legal and regulatory change, such as GDPR
  • Changing business requirements that may bring the organization under new regulatory bodies
  • Social engineering approaches to defeating security, such as phishing.
  • Organizational restructuring

Again, there should be cyclic relationship between the architectural roadmap and the work undertaken to identify vulnerabilities. The expertise of the security and government specialists informs the architectural roadmap, and so the architectural roadmap informs security and governance specialists as to what new software and tools will be required.

In the event of a vulnerability or threat, a security and governance function would provide an early warning for application developers, database teams and for those responsible for the network infrastructure. All parties should work closely together to ensure those vulnerabilities are addressed.

As vulnerabilities and threats are a moving target, they also have an important role in determining how security training should be updated so that people have the information they need to address new threats. Emerging training needs should be a feedback loop to HR.

Organizational behavior needed to build secure systems

If we accept that organizational security is a team sport, then we must consider the organizational behaviors needed to nurture a team mentality. Consider Patrick Lenceoni’s 5 dysfunctions of a team and what threat these dysfunctions pose when securing the organization. In this case each team member is an organizational function.

Trust

Team members need to trust in each other, and that other team members are competent. They need to feel that it is safe to admit to knowledge gaps and to ask for help from other team members, but also that they can hold each other to account and in turn be held to account themselves. Without trust, scarce resources are wasted because teams:

  • Build isolated fortresses, without covering the grey areas in between, resulting in security vulnerabilities in the overall systems
  • Build features to guard against the perceived incompetence of other team members rather than features to guard against real threats
  • Create unnecessary complexity, making system security difficult to test and verify

Dealing constructively with conflict

Conflict, in the positive sense, can be the action of holding each other to account or drawing attention to vulnerabilities. If conflict is avoided, due to fear of political ramifications, then the risk is that security is weakened because critical information and feedback is withheld.

Attention to results

The desired outcome is a secure, appropriately accessible corporate data asset. The organization needs to decide how it can measure the implementation and effectiveness of the security regime intended to deliver that outcome. This includes what “KPIs” are and how they are presented.

If the organization identifies the security regime it wants, without identifying and quantifying the KPIs it will use to prove it has achieved it, then team members will tend focus on just the KPIs that indicate their individual behavior rather than KPIs that indicate the success or failure of the team as a whole.

Commitment to act

The clearest, most informative security dashboard on Earth is of no use unless there is commitment to act on the information presented. This requires commitment from each team member:

  • To define appropriate processes in response to measures that indicate action is needed
  • To enact those processes promptly when required
  • To log actions taken and communicate that action to the team

Accountability

Each team member must be accountable for:

  • Providing the information that allows others in their team to fulfil their security obligations.
  • Making clear what information is required from other teams and departments
  • Highlighting when that information is not forthcoming

Measurement, surveillance and monitoring

Most security breaches are internal to the organization and are often unintended, or caused by employee complacency, or both. Employees already have legitimate access to organizational systems so are already within the company’s security perimeter. For this reason, there needs to be robust and continual monitoring and logging of items such as the following:

  • Changes to data
  • Changes to infrastructure configuration
  • Changes to application versions patch levels
  • Changes to permissions
  • Changes to role membership (both Active Directory and database)
  • Logins and logouts

As with any measurement regime, we can only recognize and detect abnormal behavior if we have a baseline for what constitutes normal behavior. The thresholds for “abnormal” require careful definition; too high and threats are missed, too low and the system “cries wolf” and is soon ignored.

Monitoring SQL Server Security: What’s Required?

A monitoring tool must help us defend against both known and unknown avenues of attack. It must be adaptable, monitor a diffuse collection of metrics, and then help us determine the reason for any sudden change in the patterns of access.

The purpose of any alert, report or dashboard is to support a decision or be a clear call to action. Brevity and clarity should be the guiding principles with the recipient being the arbiter of what is useful.

Third party security specialists should carry out both external and internal penetration testing on the system. They will flush out vulnerabilities that would only otherwise be found by hostile parties, and their testing will verify the effectiveness of systems intended to spot anomalous behavior. Penetration testing should show up in the logs and trigger appropriate alerts.

Another important consideration is the perceived neutrality of the third party. Audits can uncover painful truths and receiving those truths from a neutral third party can be more palatable; if not, it is rarely frowned upon to shoot an external messenger.

Summary and recap

  • Data security must ensure that legitimate people have access to the information they need, as well as preventing malicious actors from gaining access.
  • Information integrity is essential to ensure that data can be both checked and corrected, and that data curation complies with the law.
  • You must be able to prove that data security is not being compromised. It is no longer enough to claim you didn’t know about a breach.
  • Collaboration and corroboration both aid the implementation of an effective security regime
  • Housekeeping tasks help manage the security surface area thus making anomalies easier to spot
  • Security by obscurity is not a good strategy. It is as likely, if not more likely, to hide vulnerabilities as it is to act as a preventative measure
  • Database applications must, by design, allow the organization to meet the required standards of data security and information integrity.


The post Database Security, People and Processes appeared first on Simple Talk.


from Simple Talk https://ift.tt/2Q594DJ
via

Thursday, December 19, 2019

Translating a SQL Server Schema into a Cassandra Table: Part I Problem Space and Cassandra Primary Key

The series so far:

A subset of related tables in a relational schema can satisfy any number of queries known and unknown at design time. Refactoring the schema into one Cassandra table to answer a specific query, though, will (re)introduce all the data redundancies the original design had sought to avoid.

In this series, I’ll do just that. Starting from a normalized SQL Server design and statement of the Cassandra query, I’ll develop four possible solutions in both logical and physical models. To get there, though, I’ll first lay the foundation.

This initial article focuses on the Cassandra primary key. There are significant differences from those in relational systems, and I’ll cover it in some depth. Each solution (Part III) will have a different key.

Part II uses – and this may surprise you – several techniques from the relational world to gain insight into the primary key choices and their implications as well as redundancy points.

Part III employs the foundation from I and II both to design and evaluates each logical and physical model pair.

A background in relational databases and theory is essential, but not Cassandra. I’ll present enough context as the series progresses.

The Problem

The sample transactional database tracks real estate companies and their activities nationwide. Its data is growing into the terabyte range, and the decision was made to port to a NoSQL solution on Azure. The downsides are the loss of the expressive power of T-SQL, joins, procedural modules, fully ACID-compliant transactions and referential integrity, but the gains are scalability and quick read/write response over a cluster of commodity nodes.

Among the SQL Server 2017 artifacts is this greatly simplified, fully normalized four-table diagram:

A screenshot of a cell phone Description automatically generated

Figure 1. Normalized SQL Server schema

Both relational and Cassandra database design (should) go through conceptual, logical and physical analysis. They use the same conceptual model, mostly an ER diagram, but veer off starting at the logical design. The diagram for this purpose is an ER replacement; I’ll use it to pick attributes for what I’ll term a “unified relation,” the structure created by merging entities into one, which is to become the Cassandra table. Verifying against enterprise rules, Figure 1 is fully normalized (through 5NF). There is no redundancy.

This is the query, aka data access pattern, that the single Cassandra table is to support:

Qk Find listings for a realtor company in a city

The resultant Cassandra table will be a denormalized, partitioned and sorted dataset on cluster nodes’ discs meant to answer the query efficiently for any given realtor company-city pair(s). More generally, as joins are not supported, a table is a precomputed result set from which data is sliced. The method is moving from organizing data around meaning to query-first design.

Answering the sample query Qk doesn’t require all attributes, or even most, from the diagram. Many of the attributes would have been provided to the app by previous workflow access patterns or needed by later ones. I include them to show dependencies and redundancies in solutions to come.

The Cassandra Primary Key

This primer is meant to be enough to understand key designs in the solutions and a little more. A Cassandra Primary Key consists of two parts: the partition key and the clustering column list.

Figure 2. Two-part primary key

I’ll use this shorthand pattern to represent the primary key: ((AB)CDE). The inner parentheses enclose the partition key column(s), and clustering columns follow. In the solutions, columns in the logical and actual table primary key definitions are in the order presented. Order matters!

The design of the primary key affects data locality, sorting on disc, and performance. Keep in mind that the attributes chosen are those to be constrained in CRUD operations.

In addition, there is no notion of an alternate key and no referential integrity and so no foreign keys. Cassandra allows a limited form of indexing at times useful for retrofit queries but not meant to be used for the primary query for which the table was designed.

As with relational databases, the Cassandra primary key uniquely identifies rows. This does not mean, however, that its key patterns follow rules for unique key design in the relational model – far from it. An important deviation as you’ll see is that the key commonly combines attributes that can appear separately in unique keys and non-unique indexes. Another involves data types not available in relational systems.

Collection Data Types: Extending Key Design Possibilities

Parts II and III explore concepts demonstrated here in more depth. For now, I give a basic example of how a key can be “unique” in a non-traditional manner.

Cassandra Query Language (CQL) data types include collection types, which are not permissible in the relational model (by 1NF): list, set, map, tuple and user-defined type (UDT). A UDT groups related fields in a structure.

This graphic shows how two entities associate as per enterprise rules in the “listed by” relationship:

Figure 3. Occurrence diagram: many-to-one from Listing to Realtor

Say the query is this: Find the realtor for a listing. Since CQL has no joins, the listing identifier must be in the key so you can search on it, the realtor identifier and its other data should be non-key columns, and that there must be one row per listing. Specifically, the “many” side functionally determines the “one” side.

As for redundancy: this is expected in Cassandra for performance as it obviates the need for multi-pass queries. A major challenge, though, is keeping duplicated data consistent between rows (let alone between tables). Here, any data in a dependency relationship with the realtor identifier can be redundant.

Now turn the query around: Find all listings for a realtor. Realtor is placed in the key for searching, but for demonstration purposes, place listings outside the key in a set as this sample CQL written in DataStax Studio shows:

A screenshot of a cell phone Description automatically generated

Query over two partitions – see next section – and result:

A screenshot of a cell phone Description automatically generated

I’ve omitted a lot here. The point is this: the one-side key uniquely identifies its row but could not be a unique key in SQL Server. I generalize the concept to mean that any key column(s), used for uniqueness or not – see the section below on clustering columns – can reverse functional dependency with collection types.

A final point. Any key column can also be a collection (example later).

Partition Key

This first part of the primary key definition consists of one or more columns and divides the table’s rows into disjoint sets of related rows. The partition also is the atomic unit of storage – its rows cannot be split among nodes – and so column choice is important to physical design size considerations as well as logical row grouping for efficient querying and modification.

Each partition of replicated rows is automatically and transparently placed on nodes in the Cassandra cluster via partition key hashing. During CRUD operations, Cassandra can instantly locate partitions without scanning the potentially large cluster.

For the initial access pattern that a table is to support, you get the best performance if you design for equality comparisons on the partition key, and if multiple columns, you constrain on each column. As an example, here is a CQL query returning all rows on two partitions given partition key columns realtor company and state, abbreviated (RS):

SELECT *
FROM   listings_by_realtor_state
WHERE  R IN(‘Cirrus’, ‘Stratus’) and S = ‘Michigan’;

Inequality comparisons or failure to constrain on all partition key columns results in unpredictable (generally poor) performance. Good performance often requires that Cassandra find rows in one partition, or failing that, a very small, knowable set of partitions as does the sample.

Static columns are data not repeated in each row but stored once in its partition. This is possible because any given static column is in a dependency relationship with a subset of partition columns.

As an example, let (RSC) be the partition key where “C” is city. The combination (SC) functionally determines city population, and S, the governor, state bird, flag and other attributes when known:

A screenshot of a cell phone Description automatically generated

There is much redundancy across partitions when an (SC) or S value is repeated, but much less so than if the statics were in each row in a large partition.

There can be no static columns, however, if there are no clustering columns.

Clustering Columns

Unlike the partition key, the list of clustering columns in the primary key definition is optional. When absent, a table partition has at most one row: the partition column(s) uniquely identifies its row.

When present, clustering columns enable a partition to have multiple rows (and static columns) and establish the ordering of rows within the partition. Just as Cassandra uses the partition key to instantly locate row sets on a node(s) in the cluster, it uses the clustering columns to quickly access slices of data within the partition.

The ordering of clustering columns in the primary key definition follows this sequence:

Figure 4. Clustering column conceptual breakdown

Any subset of these clustering column types may be in the primary key clustering column list, as long as they are placed in this order. CQL, though, has no notion of these types – certainly no syntax – but it matters to the query.

In the opening section for the Cassandra primary key, I stated that the key can be a mix of attributes for uniqueness and others for searching or different ordering from non-unique indexes – Figure 4 is meant to show this. A key having any of searching or ordering attributes accompanying those for uniqueness is, in relational terms, a non-minimal superkey. Such is a near-guarantee for data corruption in relational OLTP systems, but common in the Cassandra key.

In the WHERE clause predicate, a query can filter on no clustering columns to get all rows in a partition or all of them to pinpoint one row. It can get contiguous ranges of rows off disc by constraining on a proper subset of them. CQL, however, will not allow a query to filter on a clustering column if the clustering columns defined in the list before them are not also constrained.

One more important restriction: once a clustering column in the WHERE clause is filtered with a non-equality operator, no clustering column following it in the list may be constrained.

I’ll use this table with two clustering columns to illustrate:

A screenshot of a cell phone Description automatically generated

The CQL shell (CQLSH) utility show two errors in violation of the rules:

The first two types of columns shown in Figure 3 form the “search attributes.” Columns meant to be constrained on equality operators “=’ and “IN()” may be followed by columns more likely to be filtered with inequality operators such as “≤.” Queries with an inequality operation used on an equality column and conversely equality operations on inequality columns will work, subject to the above restrictions.

Ordering columns can be appended next to the clustering column list to further affect data layout on disc. It is essential to realize that ordering columns – in fact, clustering columns in general – do not order over the entire table but only within the slice of rows in the partition defined by the clustering columns in the list before them. As with previous clustering column types, a query may or not filter on these columns.

Columns in the last position, if any, are added as necessary to make the primary key unique. The assumption is that these appended columns – assuming there are clustering columns defined before them – are not critical to searching and sorting. Placement higher in the list would hamper this ability. And further, it is often the case that their values, when not constrained upon in the query, are needed in the result set. While this is recommended form, do recall the deviant case from the collection types section in which the key remains unique although the “uniqueness” columns are in an off-key structure.

Finally, another way to affect data layout is to make any clustering column ascending, the default, or descending. Logical models will show each clustering column annotated with the “C↑” or “C↓” arrows, but the actual table definitions will all have ascending columns, so their specifications are not shown.

The Combined Key

A screenshot of a cell phone Description automatically generated

Figure 5. Conceptual row nesting in a partition

The graphic shows the nested layout for possible rows given key ((R)SCL) where abbreviations R and S and C are as before, and “L” for Listing# appended to make the key unique. The static columns for partition key R are not shown. Aside from those columns, you can visualize with a CQL query a three-row result set containing C and L and all non-key columns sliced from the partition:

SELECT *
FROM   listings_by_realtor_city
WHERE  R = ‘Stratus’ AND 
       S IN(‘Oregon’, ‘California’);

Here is a summary of some properties of the primary key; compare how in each case they differ from the relational primary (or alternate) key:

  • Key columns are immutable
  • The key is often a non-minimal superkey
  • The key may not functionally determine its rows (while remaining unique)
  • Any key column may be a collection
  • Key and non-key column dependencies may fail any level of normalization

As to the third point: in the collection types section, you saw the “one” side of a many-to-one relationship placed in the key and the “many” side in a set of nested collections as a non-key attribute. I illustrate the fourth by reversing this; this valid table definition uses collections for the partition and a clustering column:

A screenshot of a cell phone Description automatically generated

Key or not, collections fail 1NF.

During physical design, clustering columns can be moved into the partition key to create more partitions with fewer rows, or movement in the opposite direction to create fewer partitions with more rows. The decision also affects which columns become static.

In most solutions, I will use combinations of attributes ((R)SC) in the key. The final designs, though, could be based on ((RS)C) or even ((RSC)). This is noted but not considered further.

Conclusion

You’ve seen that Cassandra tables have partition columns for data locality among nodes and their attendant static columns. Clustering columns and rigid CQL query restrictions are aimed at optimizing contiguous row retrieval and processing. Every table is a denormalized, precomputed result set from which data is sliced. Tables typically have a non-minimal superkey if that. Understanding collections as key and non-key columns with little or no indexing as we’re accustomed to thinking is quite an adjustment.

Add to this the redundancy that denormalization implies; converting to a system that not only expects data duplication between rows in a single partition, across partitions and tables as well but requires it for responsiveness. Any table can fail normalization levels in multiple places via relationships involving key and non-key columns.

Cassandra does have mechanisms to keep replicated rows in sync and some ACID compliance. It has durability always, atomicity and isolation to a partial degree but nothing for all the other consistency and integrity checking we’re used to ranging from alternate and foreign keys and transaction isolation levels to stored procedures and triggers. It all implies a tight coupling with the OLTP app and the development of new apps to find integrity problems.

In Part II, I’ll continue foundation with relational analysis using tools such as occurrence and functional dependency diagrams, and a function that computes closure over a set of attributes and determines whether the set would be a superkey for the unified relation.


The post Translating a SQL Server Schema into a Cassandra Table: Part I Problem Space and Cassandra Primary Key appeared first on Simple Talk.


from Simple Talk https://ift.tt/2S8jpl4
via

Wednesday, December 18, 2019

Portable Objects in PowerShell with CLIXML

As a Database Administrator, it’s essential to keep track of the systems you manage as they change over time. There are several ways to do that, and I’ve found PowerShell objects especially useful.

This article covers creating portable objects which allow you to collect data on one server and copy that data to another server. Then you can continue to work with the objects. It’s especially useful when you want to limit your work on the source server to minimize resource usage, or you want to collect data from many servers in one place and process that data as a group.

Before there was PowerShell . . .

In my early days as a DBA, I worked on Sybase SQL Server (version 4.2, for those asking) on Unix servers. To collect information from those servers, I’d use Korn shell scripts to iterate through the servers and gather the information I needed. Here’s a sample script I used over 20 years ago to collect logins across all my servers:

. /software/admin/bin/SAPSSWD
SA_PASSWORD=`echo $SAPSSWD`
SHORTNAME=`echo $1 | cut -c1-4`
echo "Using short name of .${SHORTNAME}"
echo "select name,@@servername,'#' from syslogins where name like '%${SHORTNAME}%'" > /tmp/t
echo "go" >> /tmp/t
isql -Usa -Scli42a -i/tmp/t -P${SA_PASSWORD} | tee /tmp/t.out
isql -Usa -Scli42b -i/tmp/t -P${SA_PASSWORD} | tee -a /tmp/t.out
isql -Usa -Scli44a -i/tmp/t -P${SA_PASSWORD} | tee -a /tmp/t.out
isql -Usa -Scli45a -i/tmp/t -P${SA_PASSWORD} | tee -a /tmp/t.out
isql -Usa -Scli46a -i/tmp/t -P${SA_PASSWORD} | tee -a /tmp/t.out
isql -Usa -Scli47a -i/tmp/t -P${SA_PASSWORD} | tee -a /tmp/t.out
isql -Usa -Scli47b -i/tmp/t -P${SA_PASSWORD} | tee -a /tmp/t.out
isql -Usa -Scli48a -i/tmp/t -P${SA_PASSWORD} | tee -a /tmp/t.out
isql -Usa -Scli48b -i/tmp/t -P${SA_PASSWORD} | tee -a /tmp/t.out
DATASERVERS=`cat /tmp/t.out | sed -e s/name//g | sed -e s/-//g | sed -e /.row./d`
rm /tmp/t.out   
rm /tmp/t

(Yes, I’d do things differently today, with the security concerns we have in today’s world.)

When I ran this script, which selects login and server name (and a #) from each of the nine servers, it returns a list in the DATASERVERS variable of all the logins and which server they are defined. (This is Korn shell on a Unix box running against Sybase servers.) In the script, isql does what you now do using sqlcmd. cli4xx is the name of the server, and the results are tee’d to both the console and to the t.out file. I used this script to find all the servers where a given login (SHORTNAME) was defined so that I could update or remove it.

The thing I’d like to point out is the line where I build the DATASERVERS variable. I’m taking the results from the queries that have been directed to the t.out file in the /tmp directory. Then I use the sed (stream editor) utility to filter out any occurrences of the string ‘name’, then the string ‘-‘, and then deleting any line that has the string ‘row’ prefixed or suffixed by 0 or more characters. (Try the command in SSMS with results to text, and the edits will make more sense.)

This method is the standard in Unix environments for piping the results of one utility into another. You have to ensure that the results of one are correctly formatted to be usable in the next utility in the pipeline.

PowerShell and .NET Objects

One of the first features I found amazing in PowerShell is the use of .NET objects for everything. What’s especially great is that I don’t have to use sed (or grep, or awk) to do all the formatting I as I did in Unix environments to get the same power when writing my scripts.

For example, if I want to see what’s running on my server, I run the Get-Process command:

If I want to pull back a specific process name, I can pipe the results to the where-object cmdlet (aliased as just ‘where’), testing each member of the results to see if the Name property is equal to ‘sqlservr’.

Get-Process | where {$_.Name -eq 'sqlservr'}

If I want to see the top five most memory-consuming processes, I can sort (sort-object) on the WorkingSet (WS) column in descending order, and then select (select-object) the first five.

Get-Process | sort workingset -desc | select -first 5

There’s no text manipulation here, as I had to do using the Korn shell 20 years ago. Objects contain properties, and I can select just the properties I want or can filter by specific (or wildcarded) values, as I need. I can discover what properties are available for a specific cmdlet by piping the command to Get-Member.

Get-Process | Get-Member

As you can see, there are a lot of properties available in this object. Each object is defined by its type (in this case it’s a System.Diagnostics.Process object), and Get-Member returns the properties and methods for the object, as well as other MemberTypes.

As a consultant, I work with systems for multiple clients, and the work I do often requires that I be disconnected from the client systems. This is where PowerShell’s special CLIXML (Common Language Infrastructure XML) type comes into play.

PowerShell Object Serialization

When you move data from one computer to another in PowerShell, it does so by serializing the object – exporting to another form – into XML, usually. There are a lot of options for exporting data out of PowerShell. There’s Export-Csv, and there’s a number of options using the ConvertTo verb, including ConvertTo-Html, ConvertTo-Json, and ConvertTo-Xml. Each of these cmdlets serialize the data in the objects in different ways, but most of them strip out most of the object features. Let’s look at an example.

$sqlps = Get-Process | where {$_.Name -eq 'sqlservr'}
$sqlps | ConvertTo-Xml -as String | Set-Content -path c:\work\SQLProcessXML.xml

The results show a standard XML file with values for the individual properties.

<?xml version="1.0" encoding="utf-8"?>
<Objects>
  <Object Type="System.Diagnostics.Process">
    <Property Name="Name" Type="System.String">sqlservr</Property>
    <Property Name="SI" Type="System.Int32">0</Property>
    <Property Name="Handles" Type="System.Int32">929</Property>
    <Property Name="VM" Type="System.Int64">7689175040</Property>
    <Property Name="WS" Type="System.Int64">418717696</Property>
    <Property Name="PM" Type="System.Int64">482795520</Property>
    <Property Name="NPM" Type="System.Int64">115392</Property>
    <Property Name="Path" Type="System.String">C:\Program Files\Microsoft SQL Server\MSSQL14.MSSQLSERVER\MSSQL\Binn\sqlservr.exe</Property>
    <Property Name="Company" Type="System.String">Microsoft Corporation</Property>
    <Property Name="CPU" Type="System.Double">27.03125</Property>
    <Property Name="FileVersion" Type="System.String">2017.0140.1000.169 ((SQLServer).170822-2340)</Property>
    <Property Name="ProductVersion" Type="System.String">14.0.1000.169</Property>
    <Property Name="Description" Type="System.String">SQL Server Windows NT - 64 Bit</Property>
…

CLIXML is structured differently, however, and contains a lot more information. You can also use the Export-Clixml command to export it.

$sqlps | Export-Clixml c:\work\SQLProcessCLIXML.xml

The output file looks like this:

<Objs Version="1.1.0.1" xmlns="http://schemas.microsoft.com/powershell/2004/04">
  <Obj RefId="0">
    <TN RefId="0">
      <T>System.Diagnostics.Process</T>
      <T>System.ComponentModel.Component</T>
      <T>System.MarshalByRefObject</T>
      <T>System.Object</T>
    </TN>
    <ToString>System.Diagnostics.Process (sqlservr)</ToString>
    <Props>
      <I32 N="BasePriority">8</I32>
      <B N="HasExited">false</B>
      <Obj N="Handle" RefId="1">
        <TN RefId="1">
          <T>System.IntPtr</T>
          <T>System.ValueType</T>
          <T>System.Object</T>
        </TN>
        <ToString>7088</ToString>
      </Obj>
      <Obj N="SafeHandle" RefId="2">
        <TN RefId="2">
          <T>Microsoft.Win32.SafeHandles.SafeProcessHandle</T>
          <T>Microsoft.Win32.SafeHandles.SafeHandleZeroOrMinusOneIsInvalid</T>
          <T>System.Runtime.InteropServices.SafeHandle</T>
          <T>System.Runtime.ConstrainedExecution.CriticalFinalizerObject</T>
          <T>System.Object</T>
        </TN>
        <ToString>Microsoft.Win32.SafeHandles.SafeProcessHandle</ToString>
        <Props>
          <B N="IsInvalid">false</B>
          <B N="IsClosed">false</B>
        </Props>
      </Obj>
      <I32 N="HandleCount">929</I32>
      <I32 N="Id">2808</I32>
      <S N="MachineName">.</S>
      <Obj N="MainWindowHandle" RefId="3">
        <TNRef RefId="1" />
        <ToString>0</ToString>
      </Obj>
      <S N="MainWindowTitle"></S>
      <Obj N="MainModule" RefId="4">
        <TN RefId="3">
          <T>System.Diagnostics.ProcessModule</T>
          <T>System.ComponentModel.Component</T>
          <T>System.MarshalByRefObject</T>
          <T>System.Object</T>
        </TN>
        <ToString>System.Diagnostics.ProcessModule (sqlservr.exe)</ToString>
        <Props>
          <S N="ModuleName">sqlservr.exe</S>
          <S N="FileName">C:\Program Files\Microsoft SQL Server\MSSQL14.MSSQLSERVER\MSSQL\Binn\sqlservr.exe</S>
          <S N="BaseAddress">140702702632960</S>
          <I32 N="ModuleMemorySize">516096</I32>
          <S N="EntryPointAddress">140702702798896</S>
          <S N="FileVersionInfo">File:             C:\Program Files\Microsoft SQL Server\MSSQL14.MSSQLSERVER\MSSQL\Binn\sqlservr.exe_x000D__x000A_InternalName:     SQLSERVR_x000D__x000A_OriginalFilename: SQLSERVR.EXE_x000D__x000A_FileVersion:      2017.0140.1000.169 ((SQLServer).170822-2340)_x000D__x000A_FileDescription:  SQL Server Windows NT - 64 Bit_x000D__x000A_Product:          Microsoft SQL Server_x000D__x000A_ProductVersion:   14.0.1000.169_x000D__x000A_Debug:            False_x000D__x000A_Patched:          False_x000D__x000A_PreRelease:       False_x000D__x000A_PrivateBuild:     False_x000D__x000A_SpecialBuild:     False_x000D__x000A_Language:         English (United States)_x000D__x000A_</S>
          <Nil N="Site" />
          <Nil N="Container" />
        </Props>
        <MS>
          <I32 N="Size">504</I32>
          <S N="Company">Microsoft Corporation</S>
          <S N="FileVersion">2017.0140.1000.169 ((SQLServer).170822-2340)</S>
          <S N="ProductVersion">14.0.1000.169</S>
          <S N="Description">SQL Server Windows NT - 64 Bit</S>
…

As you can see, things are quite different.

The standard XML file contains the information in the object, but much like you’d do when you put it into a report. The CLIXML file, on the other hand, contains the entire object structure, including the object definitions of the properties within the objects. Because of this, you can import the CLIXML file, using the Import-Clixml cmdlet, and have the complete object in the variable you assign the import to.

As an example, you can use the Get-Content cmdlet to import the data into an XML variable.

[xml]$ps = Get-Content c:\work\SQLProcessXML.xml

You can then navigate down to the Property elements to retrieve the values. In PowerShell, it’s fairly easy to navigate an XML object by using dots (‘.’) to separate the XML elements.

$ps.Objects.Object.Property

On the other hand, with CLIXML, you can use the Import-Clixml cmdlet to retrieve the original object.

$cli = Import-Clixml e:\work\SQLProcessCLIXML.xml

Then, the full depth of the original object is returned.

$cli 
$cli | Get-Member

As you can see, the CLIXML object retains the original object type. Note that it’s been deserialized, so you have all the data in the original object. You can access the object members as you normally would, but the original methods and nested properties are excluded. The important thing to consider is that if you’re planning on using the data in another application, you probably want to use a format appropriate to that application, like JSON, XML, CSV, etc. If, on the other hand, if you’re going to use that data in another PowerShell session, then CLIXML is the format you should use.

Object Portability

The benefit I principally get from CLIXML is the ability to capture data at client systems, then port those objects to my own systems for later analysis.

One of the first things I do when starting with a new client is gather performance metrics using the Get-Counter cmdlet. I’ve got a short script that I use to define the servers I need counters from, the counters I want, and it then uses Invoke-Command to execute the script locally on each of the defined servers.

$srvrs = 'WS16SQL1','WS16SQL2','WS16SQL3'
Invoke-Command -ComputerName $srvrs -ScriptBlock {
        $srv = $env:COMPUTERNAME
        $iname = 'sqlserver'
        $dtstr = (get-date).ToString('yyyyMddHHmm')
        $counters = @(
            "\Processor(_Total)\% Processor Time",
            "\Memory\Available MBytes",
            "\Paging File(_Total)\% Usage",
            "\PhysicalDisk(_Total)\Avg. Disk sec/Read",
            "\PhysicalDisk(_Total)\Avg. Disk sec/Write",
            "\System\Processor Queue Length",
            "\$($iname):Access Methods\Forwarded Records/sec",
            "\$($iname):Access Methods\Page Splits/sec",
            "\$($iname):Buffer Manager\Buffer cache hit ratio",
            "\$($iname):Buffer Manager\Page life expectancy",
            "\$($iname):Databases(_Total)\Log Growths",
            "\$($iname):General Statistics\Processes blocked",
            "\$($iname):SQL Statistics\Batch Requests/sec",
            "\$($iname):SQL Statistics\SQL Compilations/sec",
            "\$($iname):SQL Statistics\SQL Re-Compilations/sec"
        )
        
        # Get performance counter data
        $ctr = Get-Counter -ComputerName $srv -Counter $counters -SampleInterval 60 -MaxSamples 1440
        $ctr | Export-Clixml "c:\\work\\$($srv)_counters_$($dtstr).xml"
}

I load the names of the servers into the $srvrs variable and use that to tell Invoke-Command which servers to run the script on. In PowerShell, any executable set of commands, within a pair of braces ({ and }), is called a ScriptBlock. The commands within the ScriptBlock get the local computer name and set the date string to the current date and time. It then defines the individual counters to be gathered into a hash table called $counters. The $iname variable contains the instance name to be used in the counters. In most environments, companies use the default instance, and so I’ve coded this making that assumption.

Once the variables needed for Get-Counter are set, I call Get-Counter, specifying a sample interval of 60 seconds and a maximum number of samples at 1440. Essentially, I’m gathering the counters once a minute, for 24 hours. (If you want to try out the script in a shorter time period, just modify those values.) When the Get-Counter cmdlet completes 24 hours later, it assigns the collection of counter values to the $ctr variable. It then pipes that variable to Export-Clixml, which writes the collection to a file in the local work directory with the server name and the date and time the process started in the file name.

I collect these files and copy them locally to my own machine where I have a second script that imports the CLIXML files and loads the counter values into a database table. I then have reports that read that data and produce reports that show the counters in both graphical and tabular values.

Without installing anything at my client site, I’m able to gather important performance metrics and build a performance baseline against which I can evaluate any changes I make going forward. If you would like to use these reports yourself, you can download the schema and report definitions here.

SQL Power Doc

Kendal Van Dyke (@sqldba) wrote a set of PowerShell modules and scripts that, in two separate steps, collect Windows and SQL Server configuration data, and convert that data into three separate spreadsheets. One contains all the Windows operating system and server configuration data. A second workbook contains SQL Server instance, database, and Agent configuration data. A third workbook provides an analysis of the configuration data and provides an assessment of that configuration against known best practices, with links to the Microsoft documentation describing the best practice descriptions.

There’s a single download zip file you can get from GitHub and, in that file, are the modules, the scripts you need to run, and text documents explaining how to run the scripts. (Note that running the scripts requires local admin rights on each of the servers from which data is collected. This is due to the breadth of information the scripts collect, which use a combination of Windows Management Instrumentation (WMI) and SQL Server Server Management Objects (SMO) to gather its data.)

The first step of the process uses one of the “Get” scripts. I almost always use the Get-SqlServerInventoryToClixml.ps1 script. This script then searches the computers provided in the -ComputerName argument and gathers the configuration data. If I have the necessary privileges, I run this from a workstation in my client environment, and if I don’t, I ask someone who does to run it for me. It doesn’t change anything; it just collects data.

The file it produces is a CLIXML file, compressed using gzip, thus the gz extension.

I then copy the gz file to my local machine and run the second script – Convert-SqlServerInventoryClixmlToExcel.ps1, which produces the spreadsheets I described earlier.

Caveat

I’ve run into many cases where an object I’m working with is not serializable. For example, using the brilliant scripts provided by the dbatools project, I’ve found that some of the objects I’ve retrieved are serializable (Get-DbaComputerSystem, Get-DbaDiskSpace) where others are not (Get-DbaLogin). When they are not, PowerShell throws an error.

Experiment with serialization and the CLIXML file format. You’ll find the right combination of commands that will meet your requirements.

Summary

Over the years, I’ve been successful using scripting to automate the processes of administering databases. PowerShell has been a tremendous step forward from when I started with Korn shell. It’s also important to localize your work, so you don’t use resources on server systems unnecessarily. It’s in this case, where the power of CLIXML comes in handy, to move objects from the servers that have other work to do to your local machine, where you can continue the work without using the server resources.


The post Portable Objects in PowerShell with CLIXML appeared first on Simple Talk.


from Simple Talk https://ift.tt/2sFyMXG
via

Friday, December 13, 2019

Debugging in Unity

Inevitably, when you are developing a game, you will need to debug your Unity project, and you’ll do this multiple times throughout development. Sometimes you may run into an issue that isn’t easily found by replaying the game numerous times. There are times where you’ll need tools to uncover a project’s issues faster. Fortunately, Unity has provided some helpful debugging tools to make squashing bugs a little easier. In addition, Visual Studio tools can be used alongside Unity for access to more debugging options.

A project showcasing many of the debugging options available to you is soon to follow. Many of the tools are some variation of displaying a message in the debug console. These messages can be plain text, warnings, or errors. There are also commands that draw debug lines in Unity’s Scene window as well as code that distinguishes if an exe of your game is a development build or not. All this will be utilized in a scene consisting of two capsules and some text.

Project Creation

Upon opening Unity Hub, create a new project, as shown in Figure 1.

Figure 1: Creating a new project

A new window opens that displays all the project templates available. All the debugging tools shown here will work in any project, but the example to follow will be in 3D. Give your project a name and location and click the Create button shown in Figure 2.

Figure 2: Project creation

Once the project has been created, you’ll need to create two capsule objects. This can be done in the Hierarchy menu by clicking Create 3D Object Capsule, as shown in Figure 3.

Figure 3: Creating capsule objects

Set the position of the two capsules to whatever you’d like, so long as the positions are noticeably different. The figure below put both capsules’ Z position at -5.6 and Y position at 0. The first capsule’s X position is at -2.9, and the second capsule’s X position is at 3.1. Figure 4 shows how the scene will look.

Figure 4: The current scene

Some text will be displayed whenever the game runs from a development build. If it is not a development build, then the text will be hidden. To create this text, use the same create menu as before and navigate to 3D Object-3D Text. Position the text wherever you wish and set the message by going to the Text Mesh component under the Inspector window and editing Text. Figure 5 shows some example text.

Figure 5: Entering text

Once everything is in place, create a new script by going into the Assets window, right-clicking, and selecting Create C# Script as shown in Figure 6.

Figure 6: Creating a C# script

Give the script a name, then double click it to open Visual Studio.

Debug Messages and More

One of the most common ways to debug a game is to print messages to the debug console. The messages can contain any info you wish such as a string, integer value, boolean, or a combination of variable types. The most basic of these messages is Debug.Log, which prints a message of your choice. In the example below, Debug.Log should be placed within the Start method, and it will print “Let the games begin” to Unity’s debug console.

Debug.Log("Let the games begin");

The next two functions are similar to Debug.Log. In fact, they all begin with “Debug.Log.” These two commands are Debug.LogError and Debug.LogWarning. You may be able to tell what these commands do. LogError will log a custom error message to Unity’s console, while LogWarning prints a warning message to the console. Once again, these two functions will be put to use in the Start method. An error message will print “I am error” to the console and a warning message saying “I’m warning you.”

Debug.LogError(“I am error”);

Debug.LogWarning(“I’m warning you!”);

Debugging means more than printing messages; you can tell Unity to pause the game by using Debug.Break. This is useful whenever you need to pause the game at specific points but can’t manually pause it yourself. For example, if you want to make sure a projectile fired from an object is moving at the correct trajectory, you may wish to use Debug.Break to pause the game so you can analyze that trajectory and make any necessary corrections in code. Add the code under the Debug.Log statements.

Debug.Break();

Going back to message printing, you have Debug.Assert. Like Debug.LogError, it also prints an error message. But there is one key difference – it only prints if an assigned boolean is false. In this example, a boolean has been declared and is used in Debug.Assert. The boolean was given the attribute SerializeField to make it visible in the Unity editor. This was done so you can set the boolean to true or false and see how Debug.Assert works more clearly.

Debug.Assert(assertionBool, 
    "I print to the screen if asssertionBool is false.");

Finally, there’s Debug.LogException, which prints out whatever exception message is given to Unity’s console. There aren’t any real surprises here, as it behaves like printing an exception message would in any other C# project. In scenario taking place in the Start function, the program tried to convert a string into an integer, which of course won’t work if the string has anything but numbers. The exception is caught and displayed in the Unity console. Note: you’ll need to add using System; above the class for this code to work correctly.

try
        {
            // something that will throw an exception
            string someString = "This is some string";
            Debug.Log("Breakpoint activate");
            int someNum = Convert.ToInt32(someString);
        }
        catch (Exception ex)
        {
            Debug.LogException(ex);        
        }

Once finished, the Start method should appear like the one in Figure 7.

Figure 7: The complete Start method.

Other functions print messages to the console, including LogFormat and LogWarningFormat, but they’re very similar to the functions already shown. These are the functions you’ll want to know when it comes to printing information to the Unity console. If you want to see how all these work now, save the code and return to the Unity editor. Attach the script to any object you wish. The example in Figure 8 attaches the script to the Main Camera object.

Figure 8: Attaching MyScript to an object

Set the Assertion Bool value to whatever you wish, then run the project. Nothing will happen in-game of course, but you can view the debug messages either by clicking on the console text in the lower right of the editor or by navigating to Window General Console shown in Figure 9. You may also notice that the project is currently paused, signified by the state of the pause button near the top of the editor. This is thanks to Debug.Break doing its work.

Figure 9: Unity debug console

Drawing Lines

The next two debug functions, Debug.DrawLine and Debug.DrawRay, draw lines in Unity’s Scene window while the game is running. What’s the difference? DrawLine, as the name implies, draws a line from point A to point B. In this project, the line will be drawn starting at one capsule object and ending at the other. DrawRay, on the other hand, draws out a ray using a starting point and extending out a certain direction. You would typically use DrawRay to better visualize where a raycast (an invisible line) is going. For instance, in many shooters, it’s not a physical bullet that comes out of the gun but instead, a raycast being fired. Developers will use little tricks, such as the appearance of a muzzle flash. This will look like an actual bullet leaves the gun, but there’s usually no object being shot out. From there, the game determines if you hit something based on if that raycast collided with an object.

Before you can try out anything, you’ll first need a couple of new variables. Below the declaration for assertionBool, enter the following:

[SerializeField]
private Transform firstTransform;
[SerializeField]
private Transform secondTransform;

These variables will hold the Transform data of the two capsule objects. Transforms include the position data of an object, which is what you’ll need for DrawLine. In the Update function you’ll write:

Debug.DrawLine(firstTransform.position, 
    secondTransform.position, Color.red);

As you can see, the line begins at firstTransform‘s, or the first capsule’s, position and goes to the second capsule’s position. The color of the line has also been set to red, though it can be whatever color you’d like. In addition, you can add a fourth parameter specifying how long you wish the line to be drawn in seconds. In this case, the code is in the Update method and doesn’t require a time since it will be drawn every frame. The same thing can be done in Debug.DrawRay.

As mentioned before, Unity will need a direction for drawing the ray. This will be done by creating a new variable of type Vector3 and defining the direction and, while you’re at it, how long the line will be. Once done, you can input that into DrawRay along with the starting position and a color. The example sets the starting position to the second capsule. It can be whatever object you wish including the camera object itself if you give it this as input for its first parameter.

Vector3 forward = 
    transform.TransformDirection(Vector3.forward) * 10;
Debug.DrawRay(secondTransform.position, forward, Color.blue);

Figure 10 shows how the script looks with the new code (the Start method is collapsed in the below figure):

Figure 10: Debug.DrawLine and Debug.DrawRay

You can see how this looks in the editor by saving your code. Then back in Unity, make sure to fill in the First Transform and Second Transform fields in the MyScript component you attached to your object. In this example shown in Figure 11, the script was attached to Main Camera.

Figure 11: Setting First Transform and Second Transform

Run the project and have a look at the Scene window. You should see two lines: one red line between the two capsule objects, and a blue line coming from your object of choice, as shown in Figure 12.

Figure 12: The debug line and ray as seen in the Scene window

Development Builds

There’s not much to be said about development builds as it relates to code, but there is one useful debug boolean that should be highlighted. Remember that text object created during the project creation phase? The text can appear or disappear based on if the build is a development build.

First, add a new variable declaration. This variable will be connected to the text object in Unity once the code is modified.

[SerializeField]
private GameObject devBuildText;

To get this to work, Debug.isDebugBuild will be put to use. Go back to the Start method and add the following code at the beginning:

if (Debug.isDebugBuild)

devBuildText.SetActive(true);

else

devBuildText.SetActive(false);

To properly test this will require running the game as an exe file. But there’s an issue. Once you run the project, there’s no way to close out of the game except via Alt-Tab or Task Manager. In the Update method, a simple if statement will be added. This will check if the escape key has been pressed at any point during the game’s runtime. If it has, then it will close the application. The code can be placed anywhere in the Update method and looks like this:

if (Input.GetKeyDown(KeyCode.Escape))
        Application.Quit();

This is all that’s needed to disable an object based on if the exe is a development build or not. To see this in practice will require saving the code and returning to the Unity editor once more. In the MyScript component, you’ll need to fill the Dev Build Text field by dragging your text object from the Hierarchy window into it, as shown in Figure 13.

Figure 13: Setting Dev Build Text

Running the project from the editor will cause the text to remain visible. To better see the effect in action, go to the project’s build settings by navigating to File Build Settings. The following window appears, as shown in Figure 14.

Figure 14: Build settings

You should see a checkbox for Development Build. Leave that unchecked if you want the text object to vanish in the exe. All you need to do is click the Build and Run button, choose a location, then let Unity build an exe. Once it’s finished, the exe should run automatically, and you’ll notice the text is nowhere to be seen.

Ticking the box to mark this as a development build will, of course, reveal the text, but there are also a few helpful items you get as a result. For starters, you ordinarily can only use Unity’s Profiler, a tool that tracks performance statistics in your game such as frame rate and CPU usage, in the editor. By marking this exe as a development build, you’ll be able to use the Profiler on your exe. There’s even an option in the build settings shown in Figure 15 that automatically connects the Profiler for you upon build completion. Of course, the Unity editor will still need to be open to do any of this.

Figure 15: Activating Development Build and Autoconnect Profiler

But wait, there’s still more! You may have noticed after running your development build exe that some error messages showed up in the exe. They’re the same ones you created yourself earlier. Development builds also have a console that can print out messages, but unfortunately, the functionality appears to be limited to just error messages. Still, this can be useful as you playtest your game. If you click the error message, more information appears including the exact script and line of code the error occurred in.

Debugging Using Breakpoints in Visual Studio

You also have the option to use breakpoints in Visual Studio for Unity project debugging. This would be similar to the Debug.Break function introduced earlier, but you get the perks of using Visual Studio’s breakpoints such as seeing current variable values. To add a breakpoint, select a line of code and press F9. In Figure 16, the Debug.Break function in the Start method has been commented out to test out Visual Studio breakpoints. Debug.Log was added to the try method, and the breakpoint was set on the line with Debug.Log.

Figure 16: Setting a breakpoint

To see this in action, save the code, then select Attach to Unity in the top menu, as shown in Figure 17.

Figure 17: Attaching Visual Studio to Unity

Once Visual Studio is ready, run the project in the Unity editor. If done correctly, Unity will immediately pause the game at the point the breakpoint is reached. This would be the time to have a look at Visual Studio and gather whatever information you’re looking for in the Autos window shown in Figure 18. When you’re done looking, hit the Continue button in Visual Studio to resume the game in Unity.

Figure 18: Checking out the values of variables in the Visual Studio debugger

Breakpoints can also be used with development builds, though there are a few extra steps to do so. First, you must make sure that you have Script Debugging selected. Doing so will cause a new option to appear. This option is Wait for Managed Debugger, and you’ll want that selected too, as shown in Figure 19.

Figure 19: Activating Script Debugging and Wait For Managed Debugger

Build and run the project like before. Before launching the game, Unity should allow you a moment to attach whatever debugger you wish. Once it gives you the prompt, head over to Visual Studio, then navigate to Debug Attach Unity Debugger, as shown in Figure 20.

Figure 20: Navigating to Attach Unity Debugger

A window appears asking you to select the Unity instance. You should see two options in this window shown in Figure 21. Select the option of type Player and click the OK button. This is you telling Visual Studio you wish to attach the debugger to the exe.

Figure 21: Selecting the Unity instance

Once again, wait for Visual Studio to be ready. When ready, you can select OK in Unity’s pop up box to start the game. Like last time, the game pauses at the breakpoint allowing you to see information like variable values. Since the breakpoint occurs in the Start method, you may be presented with a blank screen in the exe because Unity was not quite finished rendering everything out. Press the Continue button in Visual Studio to resume the project as usual.

Conclusion

As nice as it would be for all code to work flawlessly the first time, the fact is that dream rarely becomes a reality. Debugging is an inevitability in the life of a programmer. For the Unity developer, there are a handful of tools provided to make bug-squashing easier, ranging from simple custom messages to visualizing raycasts. Utilizing development builds can also make development easier, even coming with its own console so you can see any errors that pop up. You can also get crafty with development builds by creating custom tools that appear in development builds. These allow you to do whatever tasks you wish, such as skipping levels or tinkering with variables in real-time.


The post Debugging in Unity appeared first on Simple Talk.


from Simple Talk https://ift.tt/34jiy3B
via

ASP.NET Core with GitOps: Orchestrating Your Containers with Kubernetes

The series so far:

In the previous tutorial, you learned how to write and deploy your Infrastructure as Code using AWS CloudFormation. This allowed you to launch several EC2 instances that run your Docker image.

The next step towards automatization is to have an orchestration system for your containers for deploying, scaling and managing them. For this series, you will be using AWS EKS (Elastic Kubernetes Service), but there are alternatives – even inside AWS- which will be presented during this article.

Understanding Kubernetes and EKS

Kubernetes is an open-source system designed by Google; as stated on their website, it is a “portable, extensible, open-source platform for managing containerized workloads and services.” This means that you can use Kubernetes to deploy and handle your containers (in this case, Docker containers) automatically.

Kubernetes works by having multiple nodes – basically, machines, whether they are virtual or physical – which handle running the pods – a container, or perhaps a group of containers. In this series, a node will be represented by an EC2 instance, while each pod will be a Docker container.

While bringing a lot of benefits to your infrastructure, running a Kubernetes cluster proves to be quite difficult. One of the services that can ease your work is Amazon’s Elastic Kubernetes Service. It has alternatives on the other big cloud providers – Google Kubernetes Engine (GKE) and Azure Kubernetes Service (AKS). Choosing between them can depend on multiple factors, such as the current knowledge of your team, costs, and where your infrastructure is currently deployed. If you are already running a large number of servers, databases, and VMs on Azure, for example, switching to Google Cloud Platform just because of Kubernetes would not make much sense.

The biggest drawback of EKS is probably its cost – as opposed to its competitors, which provide free services. It requires $0.2/hour/cluster, in addition to the costs of running the rest of your infrastructure, such as your EC2 instances and your databases.

What About Elastic Container Service (ECS)?

As mentioned earlier, there are alternatives to Kubernetes even inside AWS. ECS is an orchestration service that is native to AWS, provides better integration with other services from the platform, and is free of charge. You still pay for your instances and other services, but the orchestration capabilities are provided for free.

You can find many comparisons between ECS and EKS, and the choice should be made based on your organization’s needs; you will find ECS to be easier to learn, and you might find that it solves your problems, so you don’t have to dive into Kubernetes. One of the GitHub Actions most popular pipelines is deploying your application to ECS, so you can have your container orchestration ready faster than you think.

However, since this series is aiming to teach GitOps principles and practices, rather than platform-native solutions, the rest of the tutorial will focus on EKS.

Installing kubectl

Kubectl is a command-line interface (CLI) used for working with Kubernetes clusters. Even though you are using EKS, you need Kubectl to configure the cluster, set the image that is going to be deployed, and debug the process.

To install kubectl on your system, you can check out the guide on the Kubernetes website. After you finish the installation, verify the major and minor versions by running kubectl version. These are important when creating the EKS cluster, as the cluster and kubectl version must be within one minor version of each other.

You might also get the following message after checking the version: “The connection to the server localhost:8080 was refused – did you specify the right host or port?”. This happens because kubectl defaults the connection to localhost:8080; you will get to change this later when connecting to the EKS cluster.

Creating an EKS Cluster

The first step towards having Kubernetes deploy and manage your containers is to create an EKS cluster in your Infrastructure as Code. Most of the other resources will remain unchanged: you still need an Auto Scaling Group, a Launch Configuration and their underlying infrastructure. The main change will happen in the Launch Configuration, where instead of running your Docker container manually, you will ask the EKS cluster to handle that for you.

The EKS cluster requires an IAM role to be able to manage the resources. You can choose to add the role in your IaC file, but since it’s more of a “static” resource, creating it manually from the AWS console is not wrong. To do this, search for IAM in the Find services box:

Select IAM, likely the first option. Then, from the left side of the screen, choose Roles and click the Create role button:

From the list of services that appears, search for EKS and click it, then click the Next: Permissions button.

You should see the policies that are attached to the role:

Continue to click the Next buttons until you are asked to choose a role name. Pick something that will be intuitive, such as eks-console-access, and click the Create role button.

You can then search for the role in the table that opens up by using the name you just picked, and you should see a page with the details of your role:

Copy the Role ARN value for later use. It will be needed when creating the EKS cluster.

One more policy should be attached to the role. Click Attach policies and search for the AmazonSSMFullAccess policy. It will be needed for pulling the image ID later. Select the policy and click Attach policy.

Now the three policies should be attached to the role.

It is now time to open your infrastructure.yaml file (from the previous article) and make the necessary modifications. You will create the EKS and get the nodes to attach to it. As in the previous tutorial, this can be a process of trial and error, but a good starting point is AWS’s template. It is very generic, but it is the best way to learn precisely what is needed, and you can adapt it to your own needs.

To understand the changes that are going to be made to the infrastructure file, you need to understand resource tagging. Generally, tags allow you to manage and search for your resources more efficiently. In the case of EKS, however, tags are necessary for your nodes to attach to the cluster.

Because you are creating an EKS cluster, change the Description in the top of the file:

Description: Creating an EKS cluster with multiple EC2 instances.

Next, a new security group needs to be created for the EKS. This is done to be able to manage the cluster independently from the nodes, as well as to avoid future circular dependencies in the infrastructure:

EksSecurityGroup:
    Type: AWS::EC2::SecurityGroup
    Properties:
      VpcId: !Ref VPC
      GroupDescription: Default security group for EKS.
      SecurityGroupIngress:
        - IpProtocol: tcp
          FromPort: 1025
          ToPort: 65535
          CidrIp: 0.0.0.0/0
        - IpProtocol: tcp
          FromPort: 443
          ToPort: 443
          CidrIp: 0.0.0.0/0
      SecurityGroupEgress:
        - IpProtocol: tcp
          FromPort: 1025
          ToPort: 65535
          CidrIp: 0.0.0.0/0

This security group allows communication on port 443, as well as any port between 1025 and 65535. You can find more information about which ports are necessary and recommended for your cluster in the AWS documentation.

Next, you can create the EKS cluster. This requires the ARN of the role you created earlier, the security group, as well as a list of subnets where your worker nodes will be hosted. The latest version supported on AWS right now is 1.14, but you can use any of the other supported versions.

EKS:
    Type: AWS::EKS::Cluster
    Properties:
      Version: '1.14'
      RoleArn: arn:aws:iam::358599436160:role/eks-console-access
      ResourcesVpcConfig:
        SecurityGroupIds:
          - !Ref EksSecurityGroup
        SubnetIds:
          - !Ref Subnet1
          - !Ref Subnet2

Now that you have the cluster ready, you can tag the related resources so that the nodes can attach to the cluster. The security group used by the nodes (MainSecurityGroup, in this case), as well as the Auto Scaling Group and the instances inside it, need a tag with the key kubernetes.io/cluster/{eks-id} and the value owned. Replace the MainSecurityGroup from your file with this code:

MainSecurityGroup:
    Type: AWS::EC2::SecurityGroup
    Properties:
      GroupDescription: Security group for the API instances.
      VpcId: !Ref VPC
      SecurityGroupIngress:
        - IpProtocol: "-1"
          FromPort: 0
          ToPort: 65535
          CidrIp: 0.0.0.0/0
      SecurityGroupEgress:
        - IpProtocol: "-1"
          FromPort: 0
          ToPort: 65535
          CidrIp: 0.0.0.0/0
      Tags:
        - Key: 
              !Sub 
                  - "kubernetes.io/cluster/${EksId}"
                  - EksId: !Ref EKS
          Value: 'owned'

Replace the AutoScalingGroup in your file with this code:

AutoScalingGroup:
    DependsOn: EKS
    Type: AWS::AutoScaling::AutoScalingGroup
    Properties:
      VPCZoneIdentifier:
       - !Ref Subnet1
       - !Ref Subnet2
      LaunchConfigurationName:
        Ref: LaunchConfiguration
      DesiredCapacity: 3
      MinSize: 2
      MaxSize: 4
      Tags:
        - Key: 
              !Sub 
                  - "kubernetes.io/cluster/${EksId}"
                  - EksId: !Ref EKS
          Value: 'owned'
          PropagateAtLaunch: 'true'

For the Auto Scaling Group, you can also see the PropagateAtLaunch property being set to the tag. This will ensure that the tag will also be applied to any instance inside the group.

Although you already have an IAM role for the cluster, creating another one for the launch configuration and for accessing the cluster through the console can be a good idea. This role would need other policies than the one you created earlier:

InstanceRole:
    Type: AWS::IAM::Role
    Properties:
      AssumeRolePolicyDocument:
        Version: '2012-10-17'
        Statement:
        - Effect: Allow
          Principal:
            Service:
            - ec2.amazonaws.com
          Action:
          - sts:AssumeRole
      Path: "/"
      ManagedPolicyArns:
        - arn:aws:iam::aws:policy/AmazonEKSWorkerNodePolicy
        - arn:aws:iam::aws:policy/AmazonEKS_CNI_Policy
        - arn:aws:iam::aws:policy/AmazonEC2ContainerRegistryReadOnly
  InstanceProfile:
    Type: AWS::IAM::InstanceProfile
    Properties:
      Path: "/"
      Roles:
        - !Ref InstanceRole

The image ID is also changed, as AWS provides a list of image IDs that are required to be used when working with EKS. You can find the list here. You should use it to find the right ID for your situation, as they are divided by Kubernetes versions, as well as AWS regions. Be sure to match the version of kubectl that you installed and the version specified in the EKS section of the file. After finding the right image for you, it is possible to pull the latest version from AWS automatically. To do this, create a parameter (add to the Parameter section) in the file with the image ID name as the default value:

AmiId:
    Description: The AMI to use for the EKS nodes.
    Type: 'AWS::SSM::Parameter::Value<AWS::EC2::Image::Id>'
    Default: '/aws/service/eks/optimized-ami/1.14/amazon-linux-2/recommended/image_id'

The final step is to link the cluster to the Launch Configuration; you need to specify the AMI and execute a Shell script instead of running the Docker container. Replace the LaunchConfigration section with this code:

LaunchConfiguration:
    DependsOn: EKS
    Type: AWS::AutoScaling::LaunchConfiguration
    Properties:
      IamInstanceProfile: !Ref InstanceProfile
      UserData:
        Fn::Base64: 
          !Sub 
            - |
                #!/bin/bash
                set -o xtrace
                /etc/eks/bootstrap.sh ${EksId}
                /opt/aws/bin/cfn-signal --exit-code $? \
                        --stack  ${AWS::StackName} \
                        --resource AutoScalingGroup  \
                        --region ${AWS::Region}
            - EksId: !Ref EKS
       ImageId: !Ref AmiId
      BlockDeviceMappings:
        - DeviceName: /dev/xvda
          Ebs:
            VolumeSize: 8
            VolumeType: gp2
            DeleteOnTermination: true
      SecurityGroups:
      - Ref: MainSecurityGroup
      InstanceType: t2.micro

The bootstrap.sh script is used to add the instances into the cluster; the next script, /opt/aws/bin/cfn-signal will signal when the instances are created and ready to be used.

Once you finish this, you can delete the LoadBalancer, Listener, ListenerRule and TargetGroup sections from your file. They no longer provide any value: the EKS cluster will take the role of a load balancer. You can find the final version of the file here.

Because of the IAM role that you added to the stack, you need to let CloudFormation know that it is allowed to create such resources. To do this, add the --capabilities flag to your update or create command from the previous article to create the stack. Run this in the command or terminal window replacing the Docker <username> and <password>:

aws cloudformation create-stack --stack-name dotnet-docker --template-body file://infrastructure/infrastructure.yaml --parameters ParameterKey=DockerUsername,ParameterValue=<username> ParameterKey=DockerPassword,ParameterValue=<password> --capabilities CAPABILITY_IAM

Updating or recreating the stack will take some time at this point, because of the EKS. Once it is finished, you should see the three instances being created in your EC2 dashboard. However, none of them is running any application at this point, as you have not told the cluster what image to run.

Managing the Containers

In your AWS Console, go to the CloudFormation dashboard, select your stack and go to the Resources tab. You need two values from here – the ARN of the role that was created from the file, and the ID of the cluster.

For the ARN, search for the InstanceRole resource and click the link in the Physical ID column:

The summary page for the role will open, and you can copy the ARN from there:


For the cluster, just search for the EKS resource and copy the Physical ID column:

Before being able to interact with the cluster from EKS, you need to create a file that will tell AWS you are allowed to do so. Create a file called aws-auth-cm.yaml and paste the following content into it. Replace <ARN> with the value copied earlier.

apiVersion: v1
kind: ConfigMap
metadata:
  name: aws-auth
  namespace: kube-system
data:
  mapRoles: |
    - rolearn: <ARN>
      username: system:node:
      groups:
        - system:bootstrappers
        - system:nodes

The first step for interacting with the cluster via CLI is to run the following command, to tell AWS which cluster you are going to work with. Replace <region> with the AWS region you are working in, such as eu-central-1, and <eks-id> with the physical ID of your cluster.

aws eks --region <region> update-kubeconfig --name <eks-id>

You should receive an output similar to this:

If you receive an error like “Invalid choice: ‘eks’”, it is because your awscli version is outdated. Update your package and make sure your version is at least 1.15.32.

Next, you will need to apply the AWS authentication file to the cluster, so you have access to its resources:

kubectl apply -f aws-auth-cm.yaml

This should output:

Note that the path to the aws executable must be in your PATH variable for this command to work if you are running Windows.

From this point, you can start managing your cluster. A good start is to check if the nodes were created correctly. If you followed the tutorial, you should see three nodes after running the command:

kubectl get nodes

It should output something similar to this:

If you cannot see any nodes, several things could have gone wrong:

  • Run sudo kubectl version and make sure the client and server versions are the same (or one minor version apart);
  • Make sure you are pulling the correct AMI for the version you are using;
  • Check the aws-auth-cm.yaml file and make sure you have the correct role ARN; also check the indentation of the file, because you will not receive any errors;

The next step is to create a deployment file. The deployment file tells the cluster what image to deploy, how many containers it should create, and what method to use when updating them. The file creates a rolling update, meaning that new pods are added gradually, as old ones are destroyed, allowing your application to continue serving requests. You can read more about all the options here.

The file looks like the code below. Be sure to replace <username> with your own Docker username:

apiVersion: apps/v1
kind: Deployment
metadata:
  name: dotnet-api
  labels:
    app: dotnet-api
  namespace: default
spec:
  replicas: 3
  selector:
    matchLabels:
      app: dotnet-api
  strategy:
    rollingUpdate:
      maxSurge: 25%
      maxUnavailable: 25%
    type: RollingUpdate
  template:
    metadata:
      labels:
        app: dotnet-api
    spec:
      containers:
      - image: docker.io/<username>/dotnet-api
        imagePullPolicy: Always
        name: dotnet-api
        ports:
        - containerPort: 80
          protocol: TCP

If you wish to deploy another image, you will change the -image line. Make sure the containerPort is also the one on which you expect your application to use.

Save this to a file called cluster-deployment.yaml and apply it to the cluster:

kubectl apply -f cluster-deployment.yaml

This command will create three pods, one running on each node. You can check this by running either one of the following commands:e

kubectl get deployments
kubectl get pods

You are now ready to expose your application through a cluster load balancer:

kubectl expose deployment dotnet-api --type=LoadBalancer --port=80 --target-port=80

To get the load balancer’s IP, run:

kubectl get svc

Copy the External-IP value from the output:

It might take a couple of minutes for the application to deploy, but you can append the standard/api/test to the external IP to test that everything is working as intended. If the app is running, you’ll see this message:

If at any point, you need to update the application served by the cluster, you can update the Docker image and then run the following command replacing your Docker <username>:

kubectl set image deployment/dotnet-api dotnet-api=docker.io/<username>/dotnet-api:latest

Debugging the Cluster

Working with Kubernetes can be a tedious process, with many things going wrong along the way.

One of the most common problems is the nodes not attaching to the cluster. This is most likely due to the wrong configuration in the infrastructure: check the launch configuration’s AMI, the Kubernetes version from EKS, and make sure the resources are correctly tagged.

If the nodes and pods are created, but the application is not running, the describe command can reveal a lot of information. You can run it on the pods, as well as the svc, to discover any issues, such as scheduling, or the image not being pulled:

kubectl describe pods
kubectl describe svc

Cleaning Up

Before deleting the stack, you need to delete the deployment and the svc. Since the deployment creates a load balancer, it will prevent you from deleting the stack as long as it exists. The command order is:

kubectl delete deployment dotnet-api
kubectl delete svc dotnet-api   
aws cloudformation delete-stack --stack-name dotnet-docker

What is Next?

With Kubernetes, you are now able to easily manage a large number of containers with just a few commands. You can scale up or down, update the application that is being served, and diagnose any problems that appear along the way.

The next and final tutorial will teach you how to automate this process by using a CI/CD pipeline: any new commit to the master branch will result in the Docker image being pushed to the remote hub, and then updated in your cluster.


The post ASP.NET Core with GitOps: Orchestrating Your Containers with Kubernetes appeared first on Simple Talk.


from Simple Talk https://ift.tt/38xKBzv
via