Saturday, May 29, 2021

SQL Server performance tuning: Nine best practices

SQL Server is a powerful and feature-rich database management platform that can support a wide range of applications, but if queries are not performing well or workloads are running into deadlocks, latency issues, and other disruptions in service, no one will care about how good the platform is. Their only concern will be application performance. This article describes nine best practices for SQL Server performance tuning.

The best way to ensure that SQL Server can meet its performance requirements is to implement a robust performance tuning strategy that takes into account all aspects of the SQL Server environment. Not only does this include indexes and queries, which are often the primary targets of tuning efforts, but also the hardware infrastructure, server and database settings, log and data files, and any other components that support the environment.

In this article, I provide nine best practices for carrying out performance tuning in a SQL Server environment. Each best practice is in itself a broad enough topic to warrant its own article (or series of articles or even a book or two). For this reason, these best practices—or guidelines— should be thought of as a starting point only, with the understanding that you should delve more deeply into each topic to gain a clearer understanding of what’s involved. The guidelines are meant only to launch you on your way to effective performance tuning and provide you with a foundation for getting started.

1. Plan hardware based on performance requirements.

Performance issues can often be attributed to the hardware infrastructure that supports your SQL Server environment. The better you plan your infrastructure, the more likely you are to prevent hardware-related performance issues, which can occur with any of the following resources:

  • Compute. SQL Server is a resource-intensive application that requires enough processing and memory power to manage the data and drive its workloads, whether transactional, analytical, business intelligence, bulk loads, or a fluctuating mix. When processors or memory can’t keep up, applications grow less responsive and might even stop working.
  • Storage. SQL Server requires storage solutions that can handle the anticipated amounts of data while supporting the different ways in which data is being accessed. In today’s market, organizations can choose from a wide range of storage options, but only some are practical for SQL Server. Whatever organizations choose, their storage solutions must be able to deliver the necessary input/output operations per second (IOPS) while keeping latency rates to a minimum.
  • Network. Performance issues can also arise if the network can’t keep up with workload demands. SQL Server might be running fine, with the queries optimized for performance, but network bottlenecks can cause long response times that slow down applications and even lead to time-outs.

When you’re planning a SQL Server implementation, you must ensure that your infrastructure can deliver the performance necessary to support all your workloads. If you’ve already implemented SQL Server and are experiencing performance issues, you should evaluate your existing hardware to determine whether it might be the source of your problems.

2. Think performance when setting up your SQL Server instance.

As with hardware, you should be thinking about performance from the start, and that includes when you’re first setting up your SQL Server instances. For example, you’ll likely want to deploy instances for different environments, such as development and production, or install SQL Server on a machine dedicated specifically for that instance.

SQL Server also includes configurable settings that you can modify to meet specific workload requirements. A good example of this is the server memory options, which let you configure the minimum and maximum amounts of server memory, as well as index creation memory and minimum memory per query. For example, you might be running several SQL Server instances on a server or cluster and want to keep them from competing with each other, in which case, you might lower the maximum memory on each instance. SQL Server provides plenty of other options as well, such as those related to parallelism and deadlock priority.

You must be careful when changing configurations. For instance, you might specify a high number of maximum worker threads, thinking it will improve performance, only to find it has brought an application to a crawl. Or you might implement backup compression and then realize that the process is using valuable CPU resources and impacting concurrent operations. You should also tread carefully when setting trace flags. Although they can be useful for troubleshooting performance, they can also disrupt operations, which is why you should thoroughly test any changes you make before implementing them into production.

3. Consider performance when configuring your databases.

SQL Server also provides various ways to address performance at the database level. For example, you can locate your log and data files on different physical drives, which can eliminate contention between files while accommodating different access patterns. In addition, you might find it useful to adjust the Autogrowth and Maxsize file settings for these files, depending on your workloads.

SQL Server also lets you configure settings at the database level, just like you can at the server level. For example, you can enable or disable the Auto Create Statistics and Auto Update Statistics options, as well as set up asynchronous statistics updates. You can also change the database compatibility level, which can be useful after you’ve updated SQL Server to a newer version.

When addressing performance issues at the database level, you’re not limited to user databases and their properties. You might also be able to boost performance by optimizing the tempdb system database, which can impact performance in unexpected ways, such as causing metadata contention or object allocation contention. One way to optimize the database is to locate its files on disks separate from the user databases or the underlying operating system. Other approaches include adjusting the number of tempdb data files or their sizes.

4. Design your databases with performance in mind.

A proper database design is essential to ensuring data integrity, but it can also play an important role in performance. For example, a normalized database can improve performance by reducing the amount of redundant data, which can simplify write operations and, in some cases, read operations, particularly if only one table is involved. In some cases, however, your queries might benefit from a little denormalization if used judiciously.

When designing a database, also be sure to choose the most appropriate data types for your data, such as using char instead of varchar for string values that are all two characters. You should also consider the type of data you actually store in SQL Server. For example, it’s often better to store the image path in a database than the image itself. The appropriate use of foreign keys and other constraints can also benefit performance.

In addition to tables, you should also take into account how other database objects can impact performance. For instance, you can often avoid complex queries by putting those queries in views and then indexing the views (keeping in mind best indexing practices). Another example is the stored procedure, which can often deliver better performance than a comparable query. However, be sure to follow best practices when creating your stored procedures, such as including the SET NOCOUNT ON clause or not using the sp_ prefix when naming the procedures.

5. Build indexes to improve performance, not make it worse.

Some organizations, especially those without experienced DBAs, are often tempted to keep adding indexes to their tables in the hope of improving performance, only to discover that performance has steadily worsened. Proper indexing calls for a much more subtle approach, one that takes into account the data itself and the types of queries being performed.

The guidelines for proper indexing are quite extensive, far too many to cover here, but here are a few considerations to bear in mind:

  • Base indexes on the columns that are being queried, especially those in joins and query predicates.
  • When creating an index on multiple columns, base the column order on how the columns are queried.
  • Don’t create indexes on small tables unless you can clearly demonstrate their benefits.
  • Don’t index a column that has relatively few unique values.
  • Check indexes regularly for fragmentation, then rebuild or reorganize them as necessary.
  • Identify unused or underutilized indexes and remove them to avoid unnecessary overhead.
  • Sort indexes based on how the data is being queried.
  • Verify that your queries are using the indexes as expected.
  • Use covering indexes or filtered indexes where appropriate, keeping in mind the types of queries you’re supporting.

These are only some of the considerations to take into account when creating indexes on your tables and views. Proper indexing must be approached very carefully, or it can seriously undermine performance, rather than helping it along.

6. Create queries to maximize performance.

One of the most important steps you can take to improve SQL Server performance is to optimize your T-SQL queries, an undertaking so complex and nuanced that entire books have been written on the subject. The diligent database developer needs to take into account a number of considerations, including the following:

  • Retrieve only the fields you need and avoid using SELECT * in your queries.
  • Include the schema name when calling a database object.
  • Include the SET NOCOUNT ON clause in your queries unless you need to know the number of rows affected by a query.
  • Avoid implicit conversions that cause the query engine to convert data unnecessarily.
  • Reduce the number of queries per session, where possible, and keep transactions short.
  • Understand the differences between temporary tables, table variables, and common table expressions, and know when to use one over the other.
  • Use joins instead of correlated subqueries.

These are but a sampling of the many guidelines to keep in mind when optimizing your T-SQL queries. In addition, your scripts should undergo careful code reviews and be fully tested before being implemented into production. Developers should also modify their queries in small increments rather than make sweeping changes all at once, so they have a clear understanding of what worked and what did not.

7. Keep your SQL Server environment up-to-date.

This best practice might be one that seems to go without saying, but the importance of keeping hardware, software, and firmware current cannot be overstated. Where possible, you should consider updating to a more recent version of SQL Server to take advantage of new performance-related features. For example, Microsoft introduced memory-optimized tempdb metadata in SQL Server 2019, which can improve performance for workloads that rely heavily on the tempdb database.

Even if you decide not to upgrade to a newer SQL Server release, you should still regularly update your SQL Server instances and the underlying Windows operating system to benefit from any recent performance enhancements. In addition, you should consider updating any hardware that might be starting to drag performance down. Even if you don’t replace the hardware, you should certainly keep the supporting software and firmware up-to-date.

8. Leverage SQL Server tools to optimize performance

SQL Server offers a variety of tools to help improve performance. Anyone trying to optimize a SQL Server environment should take advantage of these tools where it makes sense, especially since they’re included with the licensing fees. Here are some of the tools that SQL Server provides:

  • The Microsoft Database Engine Tuning Advisor (DTA) will analyze your databases and provide recommendations for how to optimize query performance. You can use the tool to troubleshoot a specific query, tune a set of queries across multiple databases, manage storage space and perform what-if analysis of design changes.
  • SQL Server Query Store lets you capture a history of queries, execution plans, and runtime statistics, which you can then review to gain insight into database usage patterns and query plan changes. Query Store can help you identify and fix query performance regressions caused by plan changes, as well as identify and tune resource-consuming queries.
  • SQL Server Extended Events is a lightweight performance monitoring system that lets you collect the data needed to identify and troubleshoot performance problems. When creating an extended events session, you can specify which events to track and how to store the event data. In this way, you can collect exactly the information you need about your SQL Server environment and then view the information in a format that best suits your needs.
  • SQL Server Management Studio (SSMS) includes several options for viewing details about a query’s execution. You can display a query’s actual execution plan, which contains runtime information such as resource usage metrics or runtime warnings, or you can use the Live Query Statistics feature to view real-time data about the query execution process. SSMS also let you view client statistics about queries and their related network packets.
  • SQL Server provides a rich assortment of dynamic management views (DMVs), many of which can help identify performance issues. For example, you can use the sys.dm_os_wait_stats DMV to view the waits encountered by executed threads, which can help you diagnose performance issues with SQL Server and specific queries. SQL Server offers both server-scoped and database-scoped DMVs.

The better you understand how to use the tools that SQL Server provides, the more effectively you can identify and address performance issues. Be aware, however, that some tools or features might not be available to older SQL Server or SSMS editions. In addition, the tools mentioned here are not the only ones available. For example, you can download Microsoft’s Database Experiment Assistant (DEA), an A/B testing solution for SQL Server upgrades.

It’s definitely worth digging around to see what other tools and features might help you address performance issues. Even the error logs can sometimes be useful in identifying potential performance problems.

9. Monitor, monitor, monitor.

Ongoing monitoring is essential to delivering consistent performance across all SQL Server databases and instances. But it’s not enough to simply collect telemetry from your systems. You must also be able to use the collected data to diagnose performance issues and get at their root cause. A monitoring solution can alert you to potential issues, help you identify bottlenecks, and reveal trends that might point to performance problems occurring over a specific period of time.

There are no hard-and-fast rules that dictate exactly what you should monitor, and certainly you should design your monitoring strategy to meet your specific circumstances. That said, there are areas that typically warrant your attention. For example, you’ll likely want to monitor index fill factors, fragmentation, and usage. You might also benefit from monitoring metrics such as CPU, memory, I/O, and buffer cache usage, as well as metrics related to the log and data files. You should also consider tracking metrics specific to your queries.

To properly monitor you SQL Server environment, you will need a monitoring solution that can track the metrics you require, without impacting application performance or database operations. The solution should be able to track all relevant metrics, generate timely notifications, and provide you with the insights you need to understand and resolve your performance issues quickly and efficiently. You might consider Microsoft’s System Monitor (a.k.a. Performance Monitor), which is available for free, but many administrators prefer a solution that offers more robust features, such as Redgate’s SQL Monitor.

Performance tuning as an ongoing effort

Performance turning is not a one-off operation that you perform early on and forget about until everything crashes. It is an ongoing effort that requires careful attention to all aspects of the SQL Server environment throughout its lifespan. Performance tuning includes the infrastructure that hosts the environment, the queries that access the data, the indexes that support the queries, the server and database settings that impact performance, and everything in between.

When tuning the environment, however, you should proceed with caution, making changes in manageable steps and thoroughly testing those changes before implementing them into production. Above all, performance tuning should not be treated as an afterthought, but rather as an integral part of your management and optimization efforts that begins when first setting up your SQL Server environment and continues until the environment is put out of commission.


The post SQL Server performance tuning: Nine best practices appeared first on Simple Talk.


from Simple Talk https://ift.tt/3c41Uvg
via

Monday, May 24, 2021

Using Log Analytics to Connect to Power BI

Log Analytics is a basic tool for the entire Azure environment, I wrote about it before.

The possibility to access log analytics data from a tool for analysis, such as Power BI, only increases its importance. There are some options to make this access and we expect these options to improve very soon.

Using Notebooks in Azure Data Studio

That’s an interesting option, not related to Power BI: We can use notebooks in Azure Data Studio to connect to Log Analytics and create notebooks to analyse the logs.

The other options are turning this one less important, but still has its space. I wrote about this before.

Export Kusto to M/Using Web Connector

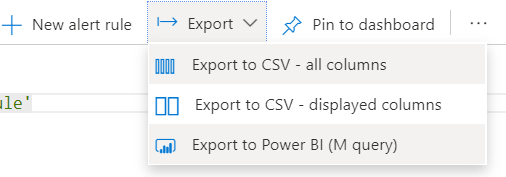
These are a small variation of the same method. Log Analytics included in an export option on the query UI to export Kusto queries to M.

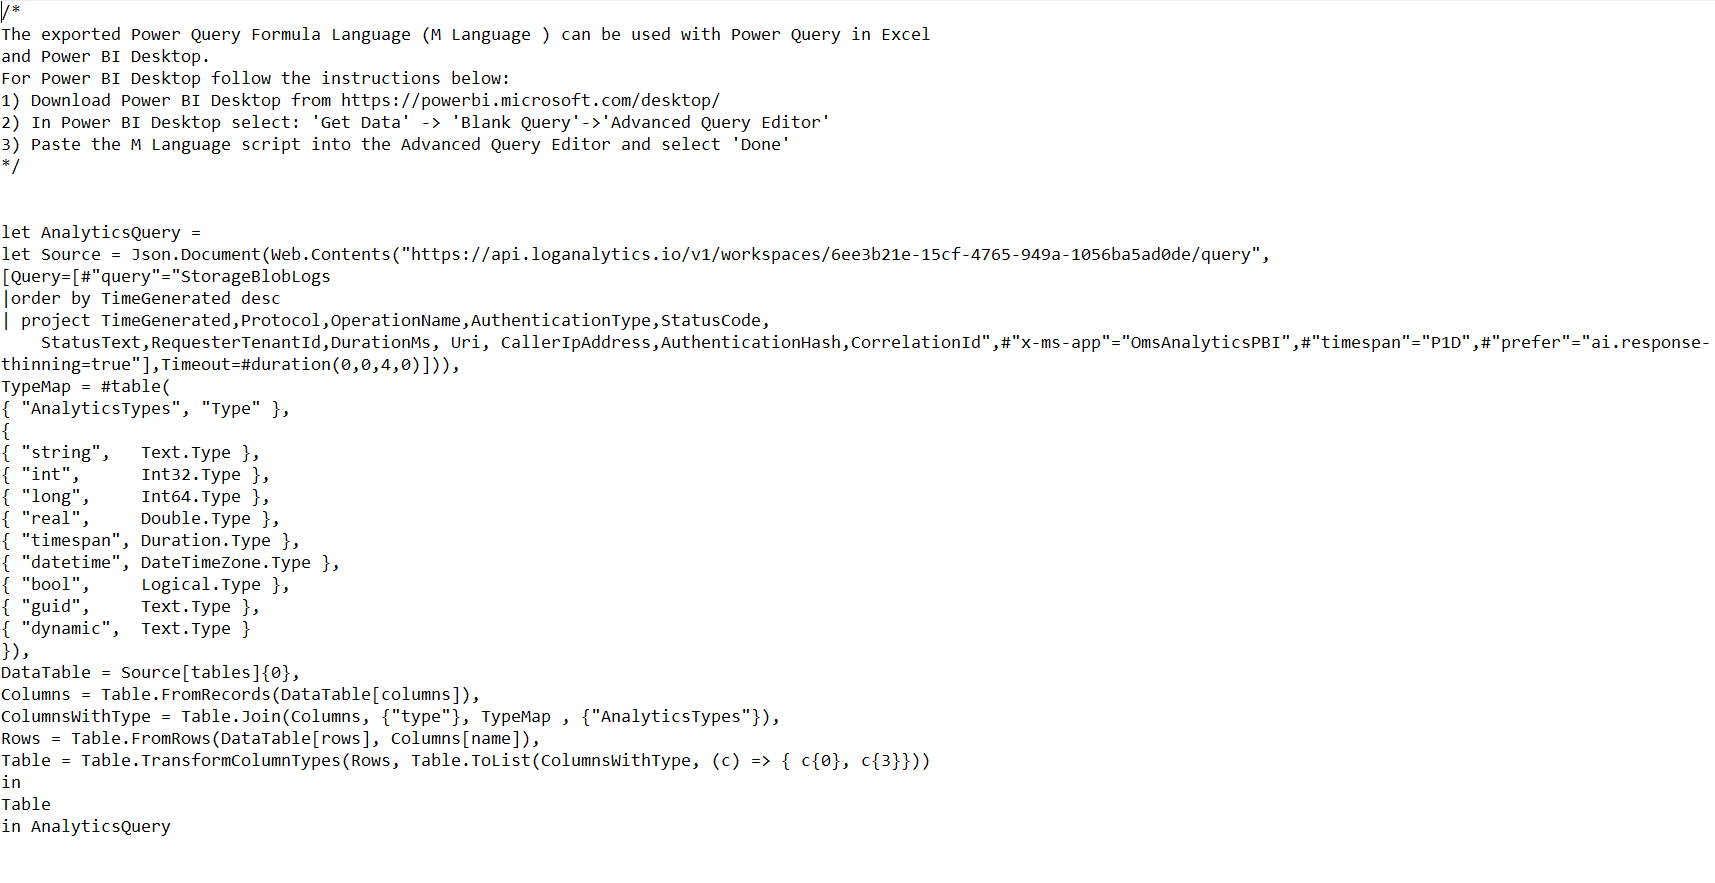
Once we use the export option, a file is downloaded containing the query. We can create a blank query in Power Query and copy the content of the file, the query will work.

The exported queries also work as an example of how to use the web connector to query log analytics.

The use of the web connector is not difficult, but complex and the Power Query UI doesn’t fully generate the code. The best way to use this feature is really use the export query from Log Analytics.

There is an article about this from Microsoft.

The Web Connector only allows for Import mode. This means the data need refresh to be updated and this is a limited solution.

Use Kusto/Data Explorer Connector

Although the complexity, in my opinion this is one of the best options possible, because it allows direct query and has the flexibility to load a table and allow us to transform the data further in Power BI.

John White wrote a great article about this option, but although the comments in the article help solving the problems, the details change a lot and deserve a small review.

The Basic Concepts

Log Analytics has, in its core, the same structure than an ADX cluster. Connecting to Log Analytics is like connecting to an ADX cluster.

The article on https://docs.microsoft.com/en-us/azure/data-explorer/query-monitor-data explains how we can connect to Log Analytics from an ADX client tool. One of the most important information to get from this link is the format of the URL.

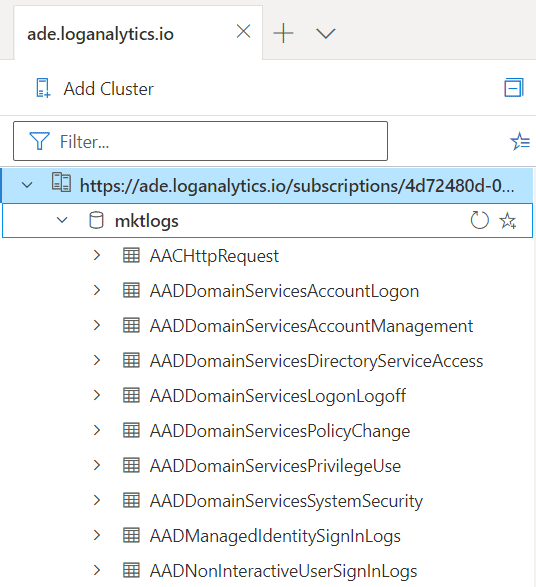
ADX has an online free client we can use to connect to clusters. You can access it on https://dataexplorer.azure.com

There are some issues with the authentication token which are not completely explained, or we are not completely sure about. If you get an error when connecting to the Log Analytics, and this may happen, the solution is simple: Make a connection first to the helper cluster – https://help.kusto.windows.net – and only after that connect to your log analytics.

The explanation – not confirmed – is the helper cluster will generate a token valid to connect to ADX clusters and this token can be used to connect to log analytics. A directly connection to log analytics doesn’t do the same.

Using in Power BI

Changes on the Data Explorer connector makes it not so simple as explained by John on his article, we can’t just use the UI to make the connection to Log Analytics.

There are different ways to achieve the result we would like, the connection. However, the result is to achieve the code below on the Power Query. In my opinion, the best solution is to start from a blank query.

= Kusto.Contents(“https://ift.tt/2RzN9cT;, “Mktlogs”, “AppServiceHTTPLogs”, [MaxRows=null, MaxSize=null, NoTruncate=null, AdditionalSetStatements=null])

There are some important details to highlight in relation to this code:

  • We can’t use the UI to access directly the log analytics address. The result will be “Wrong login, wrong tenant”. We need to use the UI to access the helper cluster and then change the address of the cluster.
  • The default source generated by the UI, AzureDataExplorer.Contents, will not work. We need to replace it by Kusto.Contents
  • Regular Power Query navigation will not work to access the data, because it sends a wrong message to the Log Analytics API. We need to include the query, which can be only the table name, directly on the source statement, as in the statement above.

Discovering the Schema

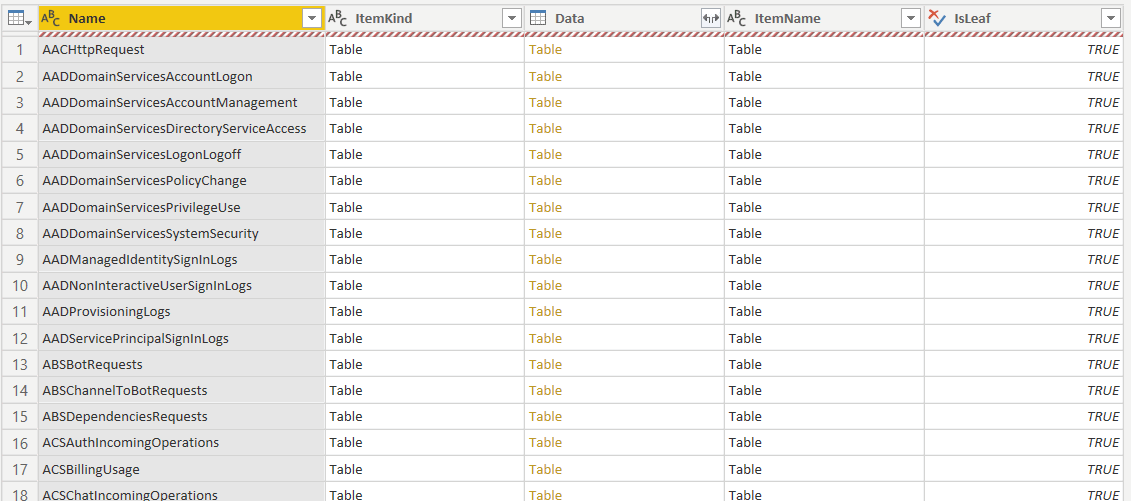
If you need to discover the available tables in your Log Analytics database, you can use the same expression replacing the table name by Null . You will retrieve a list of available tables. However, you can’t proceed with navigation, you need to choose your table and change the code.

Conclusion

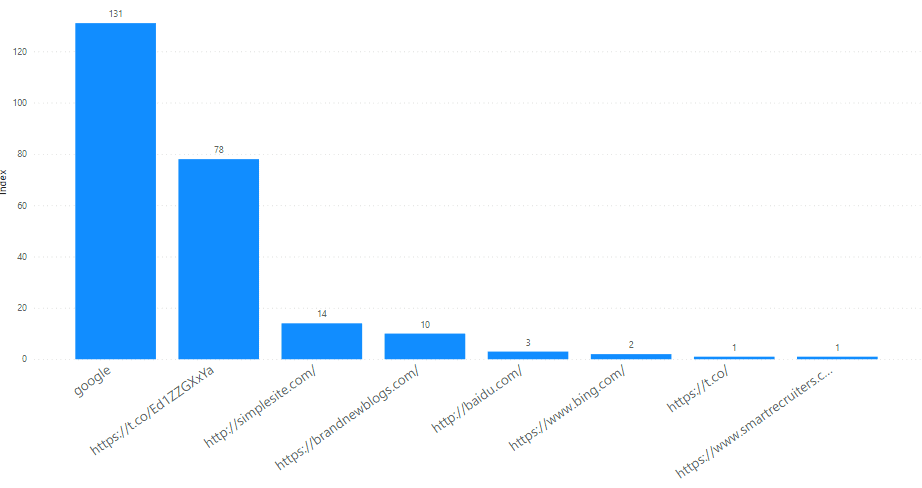
Once the access and model are stablished, the amount of possible analysis we can make about any Azure and even on-premise services is huge. For example, on the image below is a small report made about access to my blog.


The post Using Log Analytics to Connect to Power BI appeared first on Simple Talk.


from Simple Talk https://ift.tt/3oJPii2
via

Thursday, May 20, 2021

DBA in training: SQL Server high availability options

The series so far:

  1. DBA in training: So, you want to be a DBA...
  2. DBA in training: Preparing for interviews
  3. DBA in training: Know your environment(s)
  4. DBA in training: Security
  5. DBA in training: Backups, SLAs, and restore strategies
  6. DBA in training: Know your server’s limits 
  7. DBA in training: SQL Server under the hood
  8. DBA in training: SQL Server high availability options

In previous articles in this series, I have stated that the job of the DBA is to make the right data available to the right people as quickly as possible.

Here is where we delve more into the word “available” and take it up a notch. SQL Server offers several options for high availability, and understanding the advantages and caveats of each one will give you the best chance of ensuring the availability of data in any scenario. Let’s discuss the options for high availability in general terms and find out where to go to get more information as you need it.

Due to the breadth of this article and keeping with the idea of just learning the basics, I am not going to cover Azure here except to say that Azure either has compatibility with these features in most of its offerings uses them in background processes.

Backups – The Foundation

This series has already covered understanding backup strategies and SLAs. This is the foundation of making the right data available. Having a tried and tested backup and restore strategy is your protection against a host of issues, from data entry errors to unintentional deletes to database corruption. No high availability solution should ever take the place of your backups. But restores take time – and businesses may sometimes require less downtime than a restore can provide.

On other occasions, backups and restores cannot perform a business need. Say, for instance, that you have a situation where you have a third-party database that performs poorly for you when you try to report against it. It is, in fact, almost unusable for that purpose – but reporting against that data is something that must happen. You can’t modify the database (i.e., apply indexing or tune stored procedures) without voiding your warranty, and the business doesn’t want to take that risk. They do, however, need queries to work faster than they currently are.

Your data needs to be more readily available to your business. What choices do you have to make your data more performant and accessible to your business users?

One option comes immediately to mind: replication.

Replication – Object-Level Availability

Replication, simply defined, is a process where schema and data from a database are copied from one location to another location (or locations). It can be used to copy parts of a database or as a solution to the scenario I’ve just described. Replication allows you to keep your third-party database in pristine condition while modifying the copied schema and data. In this example, the third-party database could be reserved for data entry, while the most critical data is replicated to another server that is used for reporting. Those replicated tables can then be indexed and optimized to your heart’s content. Replication can offer advantages over other options such as an availability group that I’ll describe later; the schema doesn’t have to be exactly the same on both sides if you know how to do it which I will explain.

How Replication Works

Replication has three components: a publisher (source database), a distributor (the database in the middle, in charge of getting the data to one or more destinations), and a subscriber (the destination database). Inside the publisher are articles, which are groups of database object(s) that you assemble to be replicated over together. The articles can have one or more subscriptions, or destinations where the articles are copied.

To make the magic happen, SQL Server has two agents that it uses. The snapshot agent assembles the metadata of the schema and data of the objects to be replicated and keeps track of the synchronizations in the distribution database. There is also a log reader agent which monitors the transaction log of the database for any changes which will need to be copied to the subscriber(s). When you start replication on a publication, SQL Server uses the snapshot agent to create the snapshot of the schema so that an identical copy can be made on the other side. Once that process is complete, it sends over the data using a utility called the bulk copy program utility, or BCP. When the process is finished, there is an exact copy of all the articles on all of the subscribers.

You have options with replication. Not all options are supported across all editions. If you have questions about whether the option you want is available in your edition of SQL Server, this should help. Options for replication are:

  1. Snapshot replication – SQL Server will take a snapshot of your data (either immediately or at a specified time of day) and send it over. This one-time process is a great choice for data that doesn’t often change and/or isn’t needed in real-time since it can be done on a schedule or as needed, allowing you to comply with business requirements or to avoid maintenance windows. Since snapshot replication isn’t an ongoing process, it is also more economical for SQL Server to do compared to the other replication options you have.
  2. Transactional replication – This is SQL Server copying the data over in “real-time”. (For the purposes of this article, “real-time” will be defined by factors such as how fast your network is, how much replication you have going on at a time, etc.) This choice is for data which needs to be as close to real-time as possible

There are two types of subscriptions in transactional replication: push subscriptions, where SQL Server “pushes” the changes the log reader finds over to the subscriber without the subscriber needing to request it. The distribution agent runs at the distributor, freeing up the subscriber.

The other kind of subscription is known as a pull subscription. In this case, the distribution agent runs on the subscriber. With pull subscriptions, the subscriber will request for the changes to be brought over. Because of these differences, pull subscriptions should not be expected to be as close to real-time as a push publication (although they can be pretty close). They are typically used when there is more than one subscriber when you want to minimize resource contention at the distributor, and you need the data sooner rather than later but not necessarily immediately. Push subscriptions are also commonly used with merge replication (the next option).

  1. Merge replication – This is the choice when there is no primary key on the table to be replicated, but it still needs to be copied over in real-time. You may also consider merge replication if you have subscribers updating data, and you want that data copied to the publisher and/or other subscribers.

Merge replication works a bit differently than transactional and snapshot replication. In merge replication, data is updated using a series of insert, delete and update triggers, and by assigning a unique identifier to every row of data being copied. Another set of triggers capture the schema changes. Instead of using the log reader agent, a merge agent coordinates data movement. Merge replication can be tricky to set up and troubleshoot, and conflicts are not uncommon. When possible, I recommend that you go with a snapshot or transactional replication instead.

  1. Peer-to-peer – This type of replication goes back and forth between two or more servers in real-time. Updates on any one server are copied over to the others. This option is only available to Enterprise edition users. If you use this choice, the schema and object names must remain identical on all nodes, taking this choice off the list for the reporting scenario examined earlier. Publications cannot be filtered, a consideration for very large tables. There are quite a few restrictions on this type of replication, so if you are considering it, you might start learning about them here. Peer-to-peer replication does present some latency and conflict/data loss possibilities, so it should be tested thoroughly before using in production.

I explain, step by step, how to set up transactional replication here. Snapshot replication is just as easy. TechBrothersIT does a walkthrough of setting up snapshot replication over here. For peer-to-peer and merge replication, I like SQL Shack’s walkthrough.

The Gotchas of Replication

You’ve probably heard that replication is complicated. You may have even been afraid to try it. The truth is that although it can be a little complicated, it is a well documented and stable option for you to consider. While it is true that in previous versions (especially versions prior to SQL Server 2005), replication could be difficult to work with, I have worked with it since SQL Server 2008r2 with success. I have encountered scenarios when I had to stagger the times when snapshot publications fired off so they wouldn’t be competing with each other for resources. Once in a while, I have had to reinitialize a hung publication. Neither issue was particularly difficult to resolve. On the other hand, I am always surprised by replication’s resiliency. I have had to bounce a server where replication was happening before, during patching or other situations that called for it. (Spoiler alert: Nothing happened. I didn’t need to do anything special. The log reader agent simply picked up where it left off, and we all lived happily ever after.) I have had to do database restores or database snapshot rollbacks with replicated databases, which require replication to be completely blown away and recreated. There wasn’t so much as a blip on the radar, just some hurry-up-and-wait for it to complete. I have even automated replication with success. In general, replication issues and their fixes are out there for the Googling and have rarely been a problem.

That is not to say there are no catches or things you might need to know upfront. For one thing, let’s go back to our indexing scenario.

At some point, you will need to reinitialize replication or even blow it away and recreate it. Any time the process is restarted, the objects and data on the other side are also deleted and will be repopulated from scratch. That means any indexing, permissions, triggers, etc., you may have put on the subscriber side will be lost unless they are backed up in some form. The fix is to do just that. Keep backup .sql files to recreate your indexes, triggers and permissions. You even have the option in the GUI to tell SQL Server to run your scripts after it is done making the publication, or you can choose to do it yourself, either manually or in an Agent job.

Any indexed views on the subscriber dependent on replicated tables will need to be taken down prior to reinitializing or restarting replication and put back afterwards. Again, having a backup .sql script to do this is very helpful.

It is important to remember that if you reinitialize or blow away/restart replication on a publication, all the data is dropped and repopulated. All the data. Unless you are using peer-to-peer replication, you can filter the publication to remedy that. One common way is to filter on the date – for example, maybe the business specifies that you only need the last six months of data. However, if you ever have to blow that publication away and restart it, you will have to remember to adjust that filter, because the date will be hardcoded (you will have saved backup scripts of your publications, so reapplying them and adjusting the filter will be a breeze). I have tried applying a dynamic filter to publications in the past, but with no success. Adjusting filter dates is easy to forget, but the good news is that no matter what, at least the old filter date will hold, and all the data from the beginning of time won’t come over.

Monitoring replication is essential but not as easy to do as you would think. Some monitoring tools offer the ability to alert if something is wrong with replication, but they usually have to be combined with home-grown checks to ensure that all is well. Checks can be written to check row counts on publisher and subscriber tables to ensure they are concurrent. Alternatively, you could query the distributor for latency and alert on that. Microsoft has some TSQL to help get you started. I also highly recommend taking a look at Kendra Little’s approach.

Replication can be a great option for making your data more available. It can also help reserve your third-party databases for data entry and keep your vendors happy. It is a well-vetted, stable process – but you do have to understand what you are doing and where it can cause issues. Properly applied, though, it is a good tool to have in your toolbelt.

So, replication is one alternative for copying parts of a database to one or more places. But what if you want to copy an entire instance of SQL Server? This is where you might consider a failover clustered instance. Failover clustered instances (FCIs) are built on top of a Windows Server Failover Cluster (WSFC). We will discuss the WFFCs in some depth, since its internals govern the other technologies that are built on top of it.

Let’s talk about it is and how it works.

Windows Server Failover Clustering – Server-Level Availability

Microsoft defines Windows server failover clustering like this:

A failover cluster is a group of independent computers that work together to increase the availability and scalability of clustered roles (formerly called clustered applications and services). The clustered servers (called nodes) are connected by physical cables and by software. If one or more of the cluster nodes fail, other nodes begin to provide service (a process known as failover). In addition, the clustered roles are proactively monitored to verify that they are working properly. If they are not working, they are restarted or moved to another node.

Simply put, a Windows Server Failover Cluster (WSFC) are a set of servers that can seamlessly take up for each other in the case of a problem. If one goes down, another picks up where the other left off. It has a mechanism to automatically detect problems and failover when it needs to. The amount of downtime perceived by the end-user depends on many factors and should be tested to ensure it complies with service level agreements established with the business. Windows server failover clusters can be used as the foundation for failover cluster instances and availability groups for SQL Server, but it can also be utilized for other things, such as distributed file systems. Because this is configured at the OS level, your networking or Infrastructure teams will most likely set this up for you, but if you want to learn more (or find yourself having to do it), this will get you started.

How WSFC Works

WSFC shares storage between its nodes. Only one node will own the service or instance at a time. How many nodes you are allowed to have in total depends on the edition and release of your server.

So, how does it know how or when to failover? Failover works through a mechanism called heartbeats, very similar to how heartbeats work in the human body. A doctor can listen to a patient’s heart. If it is beating within a certain range of beats per minute, the heart is functioning normally. If, however, the doctor doesn’t hear a heartbeat within a certain length of time, the person is either dead or in the process of dying.

With a WSFC, if a heartbeat from the active server is not detected for six consecutive heartbeats, Windows knows there is a problem and will try to restart it. If that is unsuccessful, the server is presumed to be down, and another server steps takes over.

So, you may wonder, one server is down. Say you have three total nodes. How does the WSFC know when it’s getting low on nodes? Is there any warning? The answer is yes. WSFC uses a thing called quorum to track if the WSFC has enough nodes to be operational. Usually, a quorum is over half the nodes. Quorum is the rule for the number of failures that can happen while the failover cluster remains operational. Because it ensures that only one node runs at a time, it also helps prevent a nasty consequence called the split-brain scenario, in which two nodes start acting independently of each other and trying to write data to the same place.

When a node goes down, Windows will try to restart it. If that fails, a failover happens. The other nodes check in with something called a vote. Generally speaking, it is a good practice to have an odd number of nodes. If you don’t, you may also have something called a witness, to help with maintaining quorum. If quorum is maintained, the cluster is viable. Windows will figure out which node it wants to make primary and will failover. Microsoft gives an in-depth explanation of quorum and witnesses here.

The Gotchas of WSFCs

The main thing to know about using WSFCs is that you likely won’t have access to them. If you do, understand that the steps to set one up have to be followed very carefully. I highly recommend you practice it on a cluster of test servers before you try it in production because there are many steps, and they are not all obvious. You must do the validation checks in the setup if you want Microsoft support and clear them, so don’t skip them.

There are many requirements when setting up a WSFC, but I’ll touch on a few of the more important ones. Matching hardware on all nodes is no longer necessary (although it is still considered a good practice). However, the hardware on all nodes must be compatible and pass the validation checks. In addition, the nodes must be able to handle the workload of what is going to fail over to it. This sounds like common sense but may not be intuitive. A public network is required for client access to a clustered instance. Ensure the “All clients to connect through the network box” is checked on the Cluster Network Properties.

WSFCs are a solid option for instance-level failovers. They are not simple, but they are effective. But what if you need only specific databases on an instance and don’t want the whole instance itself to come over? That is where Failover Cluster Instances comes in.

Failover Cluster Instances (FCIs) – SQL Server Instance-Level Availability

FCIs are SQL Server instances that sit on top of two or more nodes of a Windows Server failover cluster. The instance can only be running on one node can run at a time. The FCI is run and governed by the same technology that runs the WSFC we discussed above. This will provide instance-level copies over two or more nodes in the cluster. As with WSFCs, failure detection is triggered by six missed consecutive heartbeats or unresponsive within six interval checks. The length of the intervals in the interval checks is configurable through the Failover Cluster Manager.

The Gotchas of FCIs

Because the storage in FCIs is shared, the schema and objects in a failover clustered instance must be identical – no adding indexes or filtering data, and no picking and choosing what you are bringing over.

Patching and upgrades require a couple of extra steps. This will help get you started. In-place and rolling upgrades are supported.

Don’t use FCIs with SSRS or SSIS. SSRS offers a scale-out, load-balanced solution that works well. For SSIS, Microsoft recommends installing it as a stand-alone service on each node of the cluster.

If you haven’t worked with PowerShell before, get ready to. You’ll need it for setup and also for easier troubleshooting. This brings us to troubleshooting. It can be a little tricky to understand what is happening when issues occur. DBATools has a set of cmdlets to help.

Now, we’ve covered high availability at the object, server, and instance levels. What about entire selected databases?

Availability Groups (AGs) – Database-Level Availability

A long time ago, Microsoft introduced an availability option called database mirroring, in which a copy of changes on one database were copied to another server in a different location.

Think of availability groups as mirroring on steroids.

Now, instead of one copy of database(s) going to one place, you can have multiple copies of database(s) going to multiple places (depending on the edition and release you have of SQL Server). How many of those copies (or replicas) you can read depends on what editions and releases of SQL Server you are running. Availability groups has become the de facto mode for database-level high availability; mirroring is now deprecated.

How Availability Groups Work

Availability groups are built on top of failover cluster instances and use the same basic mechanisms with a couple of twists. The readable secondaries will use snapshot isolation, (meaning transaction-level concurrency ensured by the creation of a version store in tempdb). Once the failover cluster is built, the AGs are configured. Now, however, you get options as to the type of failover you want. You can choose automatic failover with no data loss, a planned manual failover (again, no data loss) or a forced failover (with data loss). You can also specify how quickly your data needs to be sent to the replicas. Choose synchronous commit if your replicas are geographically close. If the replicas are far apart, asynchronous commits are the better option.

You even have choices as to the type of AG you want to use.

  1. You can opt for a basic availability group if you are on SQL Server Standard edition, which supports a single database with no readable access to the secondary. However, you cannot upgrade to Always On AGs from a basic availability group if you upgrade to Enterprise Edition. You will have to drop this first.
  2. You can choose Always On Availability Groups (or Availability Groups (AGs)), which is what I will be speaking to for the rest of this section.
  3. You can choose Read-Scale Availability Groups, which are a special type of AG used for a specific purpose. You don’t use these for high availability or disaster recovery, but for offloading read workloads to your secondary(ies). These AGs don’t require the WSFC, although that is not the definition of them. You can learn more about those here.
  4. Finally, there are Distributed AGs, which are an availability group of availability groups. These are quite advanced. Learn more about them here. Denny Cherry also does a nice writeup on distributed availability groups, their use in disaster recovery, their setup and gotchas.

AGs offer you the flexibility to offload backups to secondaries and can even, in some cases, fix corruption (NB: Be careful offloading your backups, and don’t count on your AG to fix corruption. Ever.). Still, it’s good to know.

Unlike WSFCs, you are most likely going to be the person to set up an availability group. This will help walk you through the setup of an AlwaysOn availability group.

The Gotchas of AGs

Put succinctly: AGs are a complicated technology. The more complicated the tech, the more gotchas. And with AGs, there are many of them.

One thing to consider carefully is the databases you want to include. Very large databases can be problematic because they take forever to populate, or seed. In fact, seeding your replicas could well be your biggest logistical challenge on setup. Be sure that the log and data file paths are the same on both sides. If you use automatic seeding, know that if backups are going on during seeding, it can cause blocking. One alternative in your toolbelt to avoid these possible headaches might be to pick an off-hours time, stop activity on the databases in the group, take a backup of them, restore the backups to the replicas, then start the AG and let everyone back in. Otherwise, the blank database(s) can be created on the replicas and seeded, and you will need to wait until that is done.

Cross-database and distributed transactions are not supported on AGs until SQL Server 2016 SP2, so if you are not on that version, you will need to upgrade if you have those in place and want to use availability groups.

Monitoring and troubleshooting AGs can be tricky and is best done with a combination of PowerShell, the built-in dashboard, and the DMVs provided by Microsoft. This is a nice list of the Microsoft-supplied DMVs. DBATools (which I linked earlier) also has a list of its AG resources here. Microsoft also provides a list of its PowerShell resources. Some monitoring tools, such as Redgate’s SQL Monitor have availability group monitoring built right in.

It’s important to understand that although availability groups are built on top of failover cluster instances, they are a separate entity from them. Don’t use the failover cluster manager to manage your availability groups.

It is possible (although quite complicated) to use replication with availability groups. You cannot use peer-to-peer replication on an AG. If you use replication on an AG, the publisher goes on the primary replica. However, if you remove the server from the availability group for some reason, you have to tear down replication, so this is something to keep in mind. That, and the fact that you are adding a layer of complexity to an already complex process, so troubleshooting becomes that much more complicated.

There are outside factors that can cause an availability group to go down (at least temporarily). Server-level snapshot backups that quiesce the databases in an AG can cause the availability group to go down. Memory dumps can cause failover, as can excessive I/O. You may find that different circumstances cause you to increase the health check timeout on the failover cluster manager, but if you do that, you won’t know about failovers as quickly – which can be an issue for troubleshooting.

In short, availability groups are another choice to consider when you want to copy entire databases and downtime must be minimal, but the flexibility and options they offer come with complexity and potential problems. Be sure to practice using them in a test environment before trying it for real.

SQL Server high availability options

Database administrators have a number of choices to consider to make the data they manage highly available to the businesses they serve. Understanding when and why to choose one option over another, practicing that technology until they are comfortable with it, and having troubleshooting measures in place will offer the best guarantee of success in ensuring your data is available as quickly as possible.


The post DBA in training: SQL Server high availability options appeared first on Simple Talk.


from Simple Talk https://ift.tt/3tWoqwo
via

Tuesday, May 18, 2021

Azure Static Web Apps: Bring Your Own Function (BYOF)

Azure technologies evolve so fast sometimes we lose track of what’s happening. One day, a simple technology is created, on the next day, it becomes something huge, in a blink of an eye. I’m not even sure if my recollection of the story will be correct.

The launch of the GA version of Static Web Apps, on this last May 12, brought a very interesting new feature and made me get out my data-silo to study and write about it.

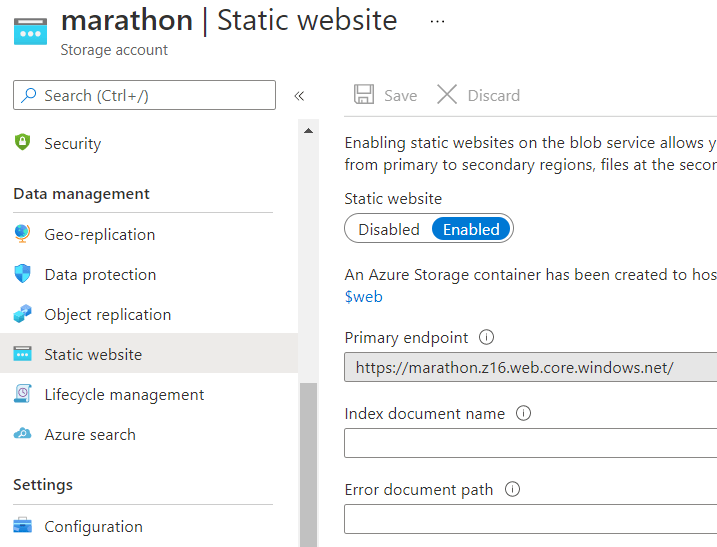
The first time I heard about static web sites was in Microsoft Build last year, MS Build 2020. It was (and still is) a feature linked to storage accounts. When enabled, it creates a special container called $web and exposes it as a website with no server technology, only client-side development.


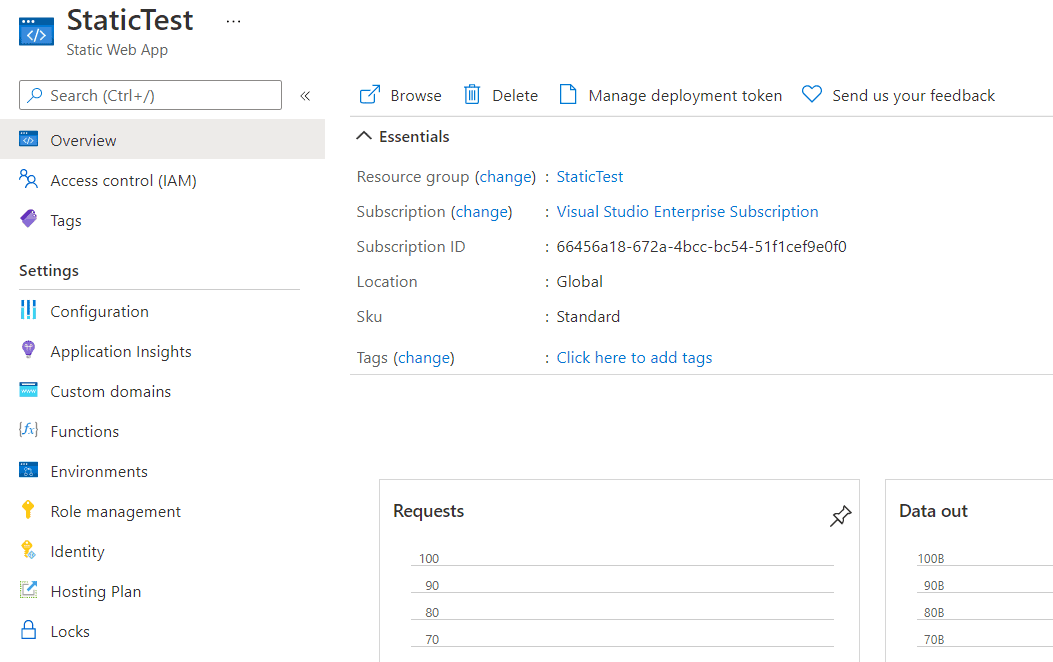
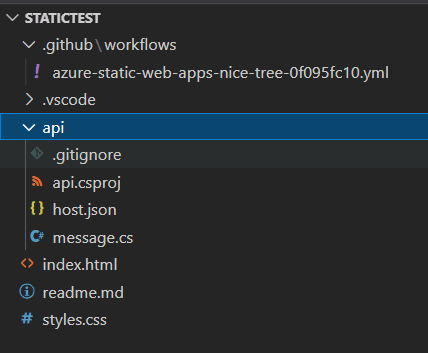
This was already very good, but Microsoft decided to go beyond and create the Static Web App. A Static Web App is a site with client code but can also include API’s. It’s directly linked with github actions that will define the deployment for the static site content and the API functions in many different languages.

In a static web app the storage is underneath. We don’t need to take care of it. The API’s are deployed using Azure Functions architecture, but not visible for us on the portal, only accessible to the static web app. The Azure Function architecture is used underneath with docker, but we don’t need to mind too much about this.

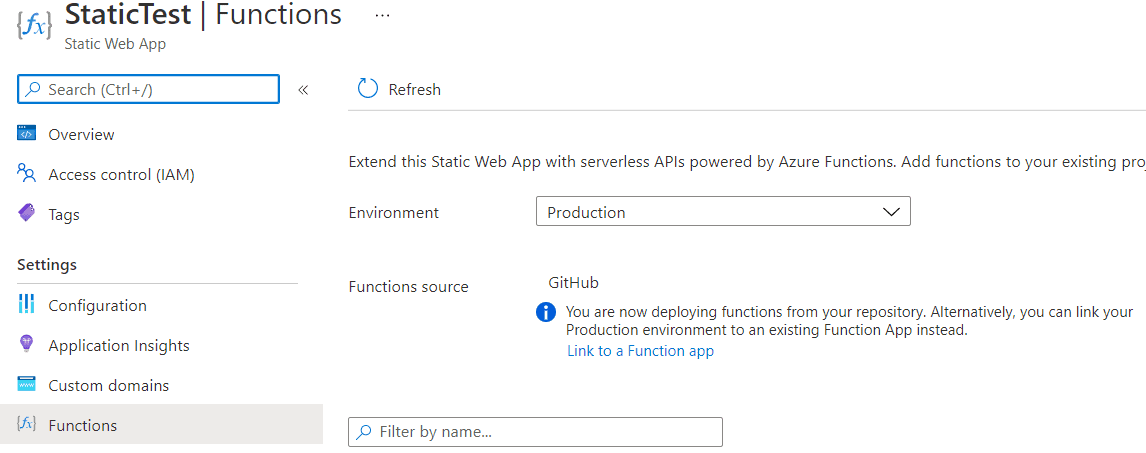
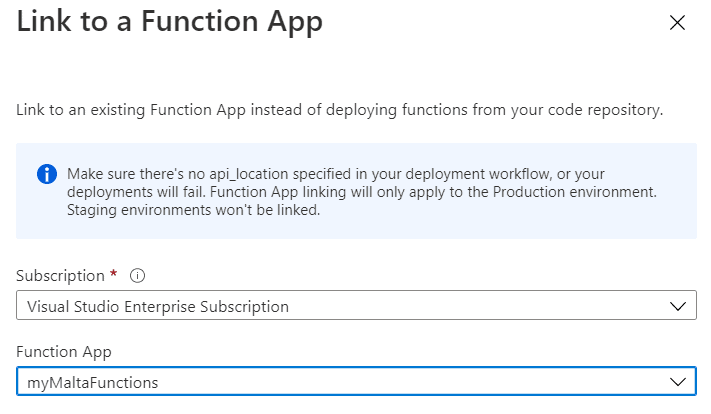
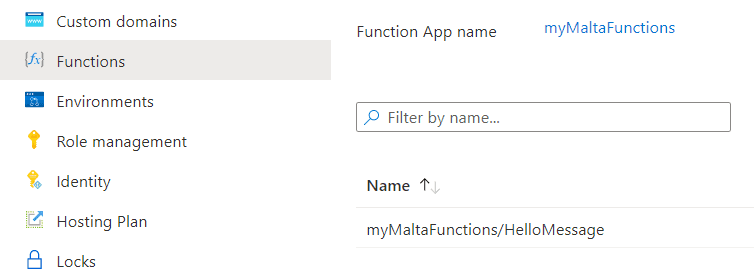
New Feature: We can map existing Azure Functions from any of our subscriptions to the API path (usually /API) inside the static web app.


Static Web Site

On a static website, you can implement any client-side framework as long it has no server-side dependency. These frameworks can make calls azure functions without many problems.

However, the front-end application is in one domain, the azure function is in a different domain. This brings security configuration details such as CORS. Both pieces, front-end and functions, are independently managed.

Static Web Apps – Before

The SWA allowed us to create API’s together the App and the deployment tasks would handle them. Internally, it uses the Azure Functions architecture, but we don’t need to handle them.

The API’s will be in the same web domain, as if they are inside a folder such as “/API”, but internally the Static Web Apps system is handling them using docker and we don’t need to know too much about it.


However, the API’s created inside a static web app can’t be accessed outside the App. They don’t become real Azure Functions and can’t even be shared between different Apps

You still can access Azure Functions, but under the same limitations as in a static web site


Static Web Apps – Now

The new feature is simple: Bring Your Own Azure Function (BYOF ?)

The Static Web App will host the static files and the existing Azure Functions will be mapped as if they were a folder inside the Static Web App


Here are the advantages:

  • The functions can be re-used in many Apps and different scenarios
  • The function is called in the same domain context, simplifying the management of CORS, sessions, cookies and so on
  • Following the micro-services architecture, the Azure Functions are not tied with the UI

Limitations:

  • It only works on standard plan, not on the free plan
  • We can link only a single function app, we can’t mix different function apps
  • At this moment, it only works in production environment

Where you can Start

Conclusion

We have one new method to deploy static web apps, breaking the front-end from the back-end. The new method has new advantages to offer.


The post Azure Static Web Apps: Bring Your Own Function (BYOF) appeared first on Simple Talk.


from Simple Talk https://ift.tt/3eTAI4h
via

Thursday, May 13, 2021

PASS Data Community Summit 2021

I began attending PASS Summit in 2003. I had no idea that it would change the course of my career and, well, life. Becoming part of the community I found through PASS inspired me to take my career to the next level by presenting and writing. It also led to some wonderful friendships and lots of adventures.

Like many of you, I was sad to hear the news about the end of the PASS organization a few months ago. I thought there would never be any large conference for our community again. Fortunately, Redgate has stepped up to host the new PASS Data Platform Community Summit, November 8 – 10. The new name reflects the legacy of PASS while focusing on our diverse, global community. (Sign up here for updates)

This new event will be virtual this year, and it’s free. With no costs for travel or the conference, we hope that folks who could never attend before will take this opportunity to gain new skills and connect with other data professionals from around the world.

While retaining many of best things about PASS, we are changing things up. We are making an extra effort to be inclusive and global. The top speakers you’d expect to see will present exciting and informative sessions, but more new speakers will get the chance present as well. We’re planning new formats for sessions and new ways to promote networking and community engagement even though it’s a virtual event. Anyone from around the world will be able to attend with no travel expenses or conference fee. This is truly world-class training –  available for anyone.

If you are interested in presenting at this event, you find can more information here. You’ll be notified when the call for speakers opens if signed up for notifications about the event. We expect it will start in just a few weeks. A committee made up of experts from the community has been assembled to review submissions and come up with the best program possible. We encourage everyone to submit once the CFS is open, and there will be opportunities even for those brand new to speaking.

I’m excited about everything this year’s conference has to offer and look forward to opening the call for speakers soon.


Commentary Competition

Enjoyed the topic? Have a relevant anecdote? Disagree with the author? Leave your two cents on this post in the comments below, and our favourite response will win a $50 Amazon gift card. The competition closes two weeks from the date of publication, and the winner will be announced in the next Simple Talk newsletter.


The post PASS Data Community Summit 2021 appeared first on Simple Talk.


from Simple Talk https://ift.tt/3hkLfat
via

Wednesday, May 12, 2021

Oracle Sequences: RAC

The series so far:

  1. Oracle sequences: The basics
  2. Oracle sequences: RAC

In my first article on Sequences, I reviewed the fundamental reason why Oracle Corp. introduced the mechanism (i.e. synthetic/surrogate keys) and the mechanical threats (cache size and index contention) that still had to be addressed by the developer/DBA. In this article, I’ll spend most of my time explaining how the problems can get worse (and be addressed) as you move from single-instance Oracle to multi-instance Oracle (RAC). I’ll end the article by mentioning the newer features of sequences that appeared in the upgrades from 12c to 19c, emphasizing one RAC scalability feature.

NOTE: Literally minutes after I had emailed the final draft of this article to the Simple Talk editor, a question came up on the Oracle-L list server asking why duplicate values were appearing from a sequence with scale and extend enabled  when the queries accessing it were running parallel. The answer arrived shortly afterwards: this is due to (unpublished) bug 31423645, fixed in Oracle 19.11 with back-ports possible for earlier versions of Oracle.”

RAC

Whenever you move from single-instance to multi-instance, the fundamental problem is how to avoid excessive competition between instances for “popular” data blocks. This generic issue turns into two specific issues for sequences:

  • Refreshing the sequence “cache” updates a specific row in table sys.seq$.
  • Every session that’s inserting consecutive values into an index will be trying to access the same “right-hand / high-value” index leaf block.

There is another issue with sequences and RAC, though, that has to be considered before worrying about possible hot spots. How do the instances co-ordinate their use of sequence values and avoid the risk of two instances using the same value? There are two solutions: the default noorder mechanism where each instance behaves as if it doesn’t know about the other instances. The other is the order option, where the instances continuously negotiate through the use of global enqueues to determine which instance should be responsible for the sequence at any moment.

Default Mechanism (noorder)

Imagine you have created a sequence with the basic command

create sequence s1 cache 5000;

As demonstrated in the previous article, Oracle creates a row in the seq$ table with highwater = 1 and cache = 5000. The first instance to call for s1.nextval reads this row into its global memory area and returns the value 1 to the calling session, updating the table to set the table’s highwater to 5001. (Note: I have said that the “instance” is calling for a value, more accurately, I should say a session in the instance.)

What happens when the next instance calls for s1.nextval? It will do what any instance normally does; it will read the current values of the row from seq$ and say “the current high value is 5001, the cache size is 5000; I will update seq$.highwater to 10,001 and return the value 5001 to the session”. If a third instance then calls for s1.nextval, the same procedure takes place – it reads the current state of the row, updates the highwater to 15,001, and returns 10,001 to the user session.

Any of the three instances could be the first to exhaust its cache – when it does, it will read the seq$ row again, update the highwater by 5,000 and return the value that used to be the highwater. If this is the first instance, its call to nextval will jump from 5,000 to 15,001.

The upshot of this noorder mechanism is that each instance will be working its way through a different range of numbers, and there will be no overlaps between instances. If you had sessions that logged on to the database once per second to issue a call to nextval (and they ended up connecting through a different instance each time), then the values returned would appear to be fairly randomly scattered over a range dictated by “number of instances x cache size.” Uniqueness would be guaranteed, but ordering would not.

What does this do for the two hot spots, though? I chose a cache size of 5,000 rather than leaving it to default to 20 so that there would be a reasonably large gap between instances that would help to address both points. As it stands, the seq$ block for the sequence’s row would move between instances to be updated at a fairly low frequency. The instances will spend most of their time inserting key values into leaf blocks that are spaced a few blocks apart in the index with intermittent collisions each time an instance refreshes its cache. To a very large degree, optimizing a sequence in a RAC system simply means setting a big enough cache size – in some cases cache 1e6 would be a perfectly reasonable setting.

This isn’t a complete solution to all the performance problems, and I’ll have more to say about that after a brief diversion into sequences created with the non-default order option.

Sequences with ORDER

If you’re running single-instance Oracle, then your sequence values are always generated in order. Some of the values may get lost, some of them may be used out of order by the sessions that acquired them, but there is only one source for “the next value.” That value is generated by the instance as “the previous value” plus “the increment,” so the values are always generated in order.

As noted above, in multi-instance Oracle, the instances will, by default, have separate non-overlapping caches that will be out of synch with each other by an amount relating to the cache size. When you view the sequence from a global perspective, there’s no guarantee that values will be generated in order – and that’s where the RAC-specific order option comes into play.

If you declare a sequence with the order option, Oracle adopts a strategy of using a single “cache” for the values and introduces a mechanism for making sure that only one instance at a time can access and modify that cache. Oracle does this by taking advantage of its Global Enqueue services. Whenever a session issues a call to nextval, the instance acquires an exclusive SV lock (global enqueue) on the sequence cache, effectively saying, “who’s got the most up to date information about this sequence – I want control”. The one instance holding the SV lock in exclusive mode is then the only instance that can increment the cached value and, if necessary, update the seq$ table by incrementing the highwater. This means that the sequence numbers will, once again, be generated in order.

The immediate penalty you pay for invoking the order option is that you serialize the generation of values. The rate at which you can generate sequence numbers is dictated by the rate at which the Global Enqueue Server processes (LCK0/LMD) can manage to move the SV lock for the sequence between the instances. Unless your sequence is only supposed to supply values at a fairly low rate, you probably don’t want to use this option – it doesn’t scale.

It is an odd detail that while the sequence information is passed between instances through the SV enqueue, the enqueue statistics (v$enqueue_stat) won’t show any gets on the SV enqueue. (The system wait events (v$system_event) will report waits for enq: SV - contention, but the individual sessions (v$session_event) will show these waits only as events in waitclass other.)

Performance Impact

All the performance issues that appear in single-instance Oracle reappear in multi-instance Oracle but tend to get worse because of the need for the instances to co-ordinate their activity through the Global Cache Service or Global Enqueue Service (or both).

In particular, when an instance needs to update seq$, it may need to call the Global Cache service to get exclusive access (gc current get) to the block that it needs to update. Similarly, if the sequence is being used to generate a unique key, then the instance may also need to call the global cache service to get exclusive access to the relevant index leaf block, and the “right-hand/high-value” problem that appears in single-instance Oracle can become a disaster area in multi-instance Oracle.

The possible threats are made a little more subtle, though, by the choice between declaring the sequence as order or noorder. There are 4 combinations to consider:

Noorder / cache N
Order / cache N
Noorder / nocache
Order / nocache

To give you some idea of the effect of the different options, I set up a 3-node RAC system and ran a simple PL/SQL block on each node to do 1,000 single-row inserts of sequence.nextval with a 1/100 second sleep between inserts. I then tested each of the 4 options above (with N = 5000 for the cache tests). The actual work done for the inserts was tiny (less than 1 second CPU); the excess wait time due to RAC-related wait events was as follows (in order of excess time lost):

Clearly, cache is better than nocache, and noorder is better than order. A large cache with noorder is by far the most efficient option. The overheads of global enqueue management for ordering are significant, as are the overheads of maintaining the seq$ table.

There are defects to this specific test, of course. First, it’s running VMs, so the virtual interconnect speeds are slower than they would be on big dedicated hardware; secondly, I haven’t included any indexes in this test, and the different patterns of index contention could be significant; finally, I’m only using one session per instance to do the inserts while production systems are likely to see different patterns of contention between sessions that are running on the same instance.

There are too many possible variations in the patterns of activity that different applications might have, so it’s not sensible for me to create and report tests for all of them. Just remember that you need to think about how your application will be working, then design a couple of models to work out the most appropriate strategy for your circumstances. I will, however, make a few general comments on how the different options may affect the performance of your production system based on my initial statement about the two critical points: refreshing the sequence cache and inserting into the sequence-based unique index.

Noorder / Cache N

Refreshing the cache: an instance that reaches its high water and needs to refresh its cache will have to acquire the relevant seq$ block in exclusive mode. For low cache values (e.g. the default 20), this may happen very frequently and introduce significant waits for “gc” (global cache) events. For large values (e.g. the 5,000 in my test), this may be sufficiently rare that any “gc” waits are insignificant compared to the rest of the workload.

Inserting into the index: imagine two instances and a sequence with a cache size of 5,000 where node 1 has been busier than Node 2. Node 1 is currently inserting values in the range 25,001 to 30,000 and has just reached 28,567. Node 2 is inserting values in the range 5,001 to 10,000 and has just reached 9,999. The two instances are inserting into different index leaf blocks, so there’s no contention. After one more insert, Node 2 needs to refresh its cache, so it now starts to insert values in the range 30,001 to 35,000, but Node 1 is currently inserting a few values just a little larger than 28,567. The two nodes will be inserting into the same high-value leaf block for a little while until that leaf block splits and probably leaves Node 1 inserting into one leaf block and Node 2 inserting into the one just above it. For a couple of seconds, there might be a fierce battle for ownership between the two instances, and you’re likely to see waits for various “gc” events for the index, including “gc cr block busy”, “gc buffer busy release” and “gc buffer busy acquire”. I’ll comment on the workaround, or damage limitation mechanism, for this behaviour on my way to the section on 12c enhancements.

Order / Cache N

Refreshing the cache: the comments from noorder/cache N regarding “gc” waits still apply, but since only one instance will need to update the seq$ table at any one moment, the impact will be greatly reduced. But this savings has been at the cost of the continuous stream of waits for the SV enqueue.

Inserting into the index: If you don’t do something to avoid the issue, the contention on the right-hand / high-value leaf block on the index will be huge. Every instance will constantly be demanding the block in current mode, and you will see a lot of waits for “gc” events for the index; you may also see several waits for “enq: TX – index contention” as the current high_value block splits. Of course, if you take action to avoid the contention on the high-value index leaf block, you must have done something that stops consecutive values belonging to the same index leaf block, which means they can’t be consecutive anymore. This suggests you didn’t really need the “order” option.

Noorder / NoCache

Refreshing the cache: If there’s no “cache”, the row in seq$ has to be updated on every single call to sequence.nextval. Every instance will request exclusive access to the relevant block and show lots of time lost on various “gc” waits. However, since updating the highwater also results in the dictionary cache (rowcache) being updated, there will also be a lot of time spent waiting on “row cache lock” events.

Inserting into the index: Even though you’ve specified noorder, the effect of the nocache means that the values supplied will be very well ordered with no “cache-size” gap between instances. All the instances will insert into the same high-value leaf block at the same time. There will be “gc” waits on the index as well as on seq$. Given all the waits for seq$ and row cache locks, the extra time lost due to these waits for the index leaf block may not be extreme.

Order / Nocache

Refreshing the cache: As for noorder/nocache, there is no cache, so every call to sequence.nextval is a request to update the seq$ table and invalidate the row cache entry for the sequence on all instances. In fact, I could see no difference between order/nocache and noorder/nocache. Possibly the difference in timing between these two cases in my test was purely one of luck.

Inserting into the index: Again, the argument of noorder/nocache applies.

Performance – further thoughts

From the list of 4 combinations, it should be clear that noorder/cache N with a large cache is the most scalable option, as it separates the (index) activity of the instances and minimizes the contention for updating the seq$ table. However, it still has effects that might need further consideration.

First is the simple observation that you can expect the index to be roughly twice the “packed” size. If you do a test on a single instance inserting into an indexed column the values from 1 to 1,000,000 from one session and the values from 1,000,001 to 2,000,000 from another session, you will find that the lower range of values will result in 50/50 leaf block splits. In contrast, the upper range of values will result in 90/10 splits. If you have N instances doing inserts from a sequence with a large cache, all but the instance using the top-most range of values will be doing 50/50 leaf block splits all the time. The only comment I can make on this is that it isn’t nice, but it’s probably not terribly important.

More significant is that I’ve ignored the effects of multiple sessions in each instance using the sequence for inserts. In a single instance (of a multi-instance RAC), you could have many sessions inserting values that are very similar, and though this won’t generally produce contention between instances, it can produce contention between sessions in the same instance (i.e. buffer busy waits, index ITL waits, etc.). The “single instance” workaround I mentioned in the previous article of adding a factor like (1 + mod(sid, 16)) * 1e10 to the value supplied by the sequence is a positive danger in these circumstances. For example, entries generated by session 99 of instance 1 might end up in the same index leaf block as rows generated by session 99 of instance 2. You need to go one step further for RAC. In addition to adding a factor to spread sessions across multiple leaf blocks, you also need to add a factor that ensures that different instances will stay separated by adding an “instance factor” like (1 + mod(instance,999) * 1e14 as well. And this brings me to 12c Enhancements.

Sequences in 12c

Oracle 12c (12cR2) brings several enhancements to sequences. You can associate a sequence with a table column using the identity mechanism. Alternatively, you can use sequence.nextval as a default value for a column if you’d rather not declare an identity. You can create sequences that can be used “locally” – i.e. they are private to a session. You can restart a sequence. Finally, 12c automates the business of minimizing index contention on RAC by introducing the “scale” option (though it’s not documented in the SQL Reference manual and probably shouldn’t be used until 18c).

Here’s a little script that produces the same pattern of results on 12.2.0.1 and 19c, demonstrating the new automatic scalability option:

create sequence s1;
create sequence s2 scale;
create sequence s3 scale extend;
create sequence s4 maxvalue 1e8 scale;
create sequence s5 maxvalue 1e8 scale extend;
create sequence s6 maxvalue 1e5 scale;
set linesize 48
column nextval format 999,999,999,999,999,999,999,999,999,999,999,999
select
        s1.nextval,
        s2.nextval,
        s3.nextval,
        s4.nextval,
        s5.nextval
from
        dual
/

I’ve declared the first three sequences without a maxvalue (which means the implicit maxvalue is 1e28 – 1) and the next two with an explicit maxvalue of 1e8. I’ve given the final sequence a maxvalue of 1e5, but for reasons that will become clear, I haven’t tried to select it from dual.

All six sequences have supplied the value 1 – with some adjustments – as their first value. Apart from the simple declaration of s1, the results have all been expanded to include a leading six-digit number: 101720. The first three digits are (100 + mod(instance_number,100)), and the next three are mod(sid,1000). This matches exactly the sort of strategy I’ve described above and in the previous article to minimize contention on index leaf blocks (at the cost of seeing 50/50 leaf block splits almost everywhere.)

The significance of the extend option is visible when you compare s2 with s3 or s4 with s5. In the absence of the extend option, the value created by the six-digit prefix has to fall within the defined maxvalue. This means the largest possible “raw” sequence number will be 6 orders of magnitude lower than you expected. (And that’s why I didn’t try selecting s6.nextval from dual – it would have raised Oracle error “ORA-64603: NEXTVAL cannot be instantiated for S6. Widen the sequence by 1 digits or alter sequence with SCALE EXTEND”). If you include the extend option, the prefix is multiplied by enough powers of 10 that your actual specified maxvalue can be reached without raising an error.

It’s a nice thought that your code no longer needs to impose scalability on the use of sequences, but you do still have to do a little design work before you take advantage of this option. If you’ve implemented something like this new “double prefix” in the past to maximize the scalability of your sequences, you will already be familiar with the problem: you need to decide the smallest possible safe maxvalue for a sequence before you create the sequence.

Imagine you actually needed “raw” values up to 1e8 (ca. 6 bytes), then a suitably selected maxvalue with scale and extend would give you a 15 digit number (ca. 9 bytes). If you hadn’t specified a maxvalue, your sequence would become a 28 (or 32, with extend) digit number. This means a typical 15 (or 17) bytes which would leave you storing an extra 6 (or 8) bytes per row, per index entry in the primary key, per row in any child table, and per index entry in any “foreign key index”. This may not matter very much if it avoids a performance threat, but it’s a detail that requires a deliberate choice – you should always try to be aware of consequences, even if you decide to ignore them.

Summary

This article reviewed sequences in light of the basic contention threat that is always present in any multi-instance (RAC) system and identified two hot spots: updates to the seq$ table as a sequence cache is refreshed, and the high-value index leaf block if nothing is done to spread the sequence values used by different instances across different leaf blocks.

It’s shown that the default RAC behaviour of sequences – where every instance gets its own range of values – helps to avoid the index contention, though a large cache size is needed for the best effect. At the same time, it demonstrated that a large cache size minimizes the frequency of updates to, hence competition for, the seq$ table.

The order option decreases scalability as it makes every instance compete for the current high-value index leaf block. It also adds overhead as the sequence information is passed around the instances through the Global Enqueue service.

Even though you can reduce cross-instance contention by setting a large cache size, you will still have some contention between one pair of instances each time an instance refreshes its cache. There will still be contention between sessions within each instance as they compete for the “instance-local” high-value index leaf block. This leads us to the idea of pre-fixing the sequence value with a two-part prefix constructed from the instance number and session number. In 12c (though documented only in 18c), Oracle allows creating a sequence that handles this work with no extra coding required. However, the necessary static declaration does require deciding whether to use some extra space to avoid any risk of running out of sequence values.

I’ve also briefly mentioned a couple of new features in 12c that add a little extra power and convenience to sequences. The next article will start looking at examples of the various ways to use sequences, and how they work might sometimes be surprising.


The post Oracle Sequences: RAC appeared first on Simple Talk.


from Simple Talk https://ift.tt/2RLQ69E
via

Tuesday, May 11, 2021

Power Query: Transforming Desktop Queries in Dataflows

.There are some interesting ways to transform queries from Power BI Desktop to Power BI dataflows in the portal.

The UI can be a bit confusing. I made some mistakes in the middle as well. Let’s see some options to make the conversion.

Leaving Blank Query Blank

  1. Create a new dataflow
  2. Select Blank Query as the source

  1. Select the gateway used to access the on premise servers

It seems strange to select a gateway for a blank query. This makes the UI a bit confusing. However, the gateway will be set for the entire dataflow, not only for the blank query

  1. On Power BI Desktop, copy the query you would like to convert
  2. Use CTRL+V on the keyboard to past the query to the Query Window, inside the dataflow
  3. Click the button Configure Connection to define the credential for the query

Since you already selected the gateway, if the server and database name are configured with the same case as in the gateway, Power BI will recover the authentication information from the gateway automatically.

If the case of server and database name is different, it’s better to edit the code first, ensure the case of the server and database name are correct and define the credential later.

If you left the gateway empty, you may notice the button Configure Credential will not recognize the gateway neither leave you an option to choose it.

After having reach the query editor, if you need to change the gateway it needs to be done on the dataflow level. On the menu, Home -> Options -> Project Options allows you to set the gateway

Blank Query for a single Query

If you would like to convert a single query, you don’t need to get into the query editor. This small secret seems so simple, but it’s not so obvious.

Once you select the Blank Query as source, you can past your query from the Power BI desktop in the code area. Power BI will be responsible to understand what you are pasting and will include the code of your query.

You still need to define the gateway on the option for this on the same screen.

Blank Query for Multiple Queries

This is a combination of the previous methods and there are two ways to do it:

  1. First method: add a dummy blank query and past the desktop queries on the editor later. You have the option to choose the gateway for the blank query or configure the gateway later, on the project options for the dataflow
  2. Second method: create a useful first query, choosing one of your on-premise queries, anyone, and past it on the code area of the first blank query. Then you past the rest on the query area, inside the query editor. You will need to choose the gateway for the first query.

Web Source

The message you receive when migrating one query using web source from the desktop to a dataflow may appear to be different, but it’s very simple: The Web source requires a gateway. You need to have a gateway with the Web source configured so it will work inside a data flow as well.

Functions

When we copy a query using custom M functions, Power BI copy the function as well.

Power BI Desktop organizes the functions in folders and for each function we have one query. We can edit the query visually without touching the function code.

In the dataflow, on the other hand, only the function is copied. Any future edit will need to be made on the function code.

One additional detail: On the desktop, we disable the load of the function query and it works fine. In a dataflow, the function will be imported with Enable Load activated and we probably would like to disable it.

In fact, if we don’t disable it, the query using the functions may become a computed table, making the refresh only available on premium. Once we disable the load of the functions, the table becomes a regular query and the refresh may be allowed.

External Tool

Marcus Wegener (@PowerBIler) created an external tool which exports all queries from a power BI file and allow us to import as a dataflow.

The tool exports the queries as a JSON file. We will be able to use the option Import Model to create a new dataflow on the portal

The external tool is included in the Business Ops tool, which help us to install many very interesting and important external tools in Power BI at once.

There are some differences between the tool and the simple copy and paste, especially in relation to the validation of the query. Anyway, I’m still trying to understand to what scenario each one will be better.

Conclusion

Although everything starts with a Copy/Paste, transferring Power BI queries from desktop to the portal has some tricks and secrets.


The post Power Query: Transforming Desktop Queries in Dataflows appeared first on Simple Talk.


from Simple Talk https://ift.tt/2RKeRTM
via