The first article of this series on Apache Kafka explored very introductory concepts around the event streaming platform, a basic installation, and the construction of a fully functional application made with .NET, including the production and consumption of a topic message via command line.
From a daily life standpoint, it’s challenging to manage Kafka brokers, partitions, topics, producers, and consumers all via command line. An interface would be quite helpful.
There is a ton of available options for managing your Kafka brokers for web UI applications. Perhaps Confluent’s version is one of the most complete, although it is part of a paid combo for mostly enterprise means.
Amongst the myriad of open-source options, Kafdrop stands out for being simple, fast, and easy to use. It is an open-source web project that allows you to view information from Kafka brokers as existing topics, consumers, and even the content of messages sent.
This article explores creating a more flexible test environment to work alongside the .NET app built in the previous article. This way, you’ll have more powerful tools to understand what’s happening with your topics.
Getting Ready
The previous article made use of the wurstmeister Docker images. Because of the maturity of Confluent Docker images, this article will migrate the docker-compose to make use of its images. They’re called confluentinc.
Take a look at the updated content of the docker-compose.yml now:
Listing 1. Updating the docker-compose.yml file
version: '3'
services:
  zookeeper:
    image: confluentinc/cp-zookeeper:latest
    networks:
      - broker-kafka
    environment:
      ZOOKEEPER_CLIENT_PORT: 2181
      ZOOKEEPER_TICK_TIME: 2000
  kafka:
    image: confluentinc/cp-kafka:latest
    networks:
      - broker-kafka
    depends_on:
      - zookeeper
    ports:
      - 9092:9092
    environment:
      KAFKA_BROKER_ID: 1
      KAFKA_ZOOKEEPER_CONNECT: zookeeper:2181
      KAFKA_ADVERTISED_LISTENERS: PLAINTEXT://kafka:29092,PLAINTEXT_HOST://localhost:9092
      KAFKA_LISTENER_SECURITY_PROTOCOL_MAP: PLAINTEXT:PLAINTEXT,PLAINTEXT_HOST:PLAINTEXT
      KAFKA_INTER_BROKER_LISTENER_NAME: PLAINTEXT
      KAFKA_OFFSETS_TOPIC_REPLICATION_FACTOR: 1
  kafdrop:
    image: obsidiandynamics/kafdrop:latest
    networks:
      - broker-kafka
    depends_on:
      - kafka
    ports:
      - 19000:9000
    environment:
      KAFKA_BROKERCONNECT: kafka:29092
networks:
  broker-kafka:
    driver: bridge
The first thing is to update its version. That’s a good way to ensure that your Docker files will also keep versioning through the many changes they may suffer.
You’ll keep the images of Kafka and Zookeeper, although the image sources are different this time. If you’re willing to keep working with the previous ones, that’s ok too. Just make sure to consult the vendor-specific settings that may be required for a broker as such.
The new network called broker-kafka will be responsible for keeping the communication among the three containers.
Finally, at the end of the listing, you get to see the Kafdrop-related container settings, which are set up with a specific port. This is the same port you’ll use later to access the UI. Feel free to change it as you wish.
Before you can rerun the docker-compose commands, you need to make sure that the previous images aren’t running nor installed on your machine. The easiest way is through Docker Desktop. Open it and make sure to delete all the containers from the previous article whether they’re running or not.
Another way to check this out is via command line:
docker-compose ps
Now rerun the docker-compose command to re-download everything and build the images from scratch:
docker-compose up -d
Wait until the command downloads all the images from the internet, as shown in Figure 1.
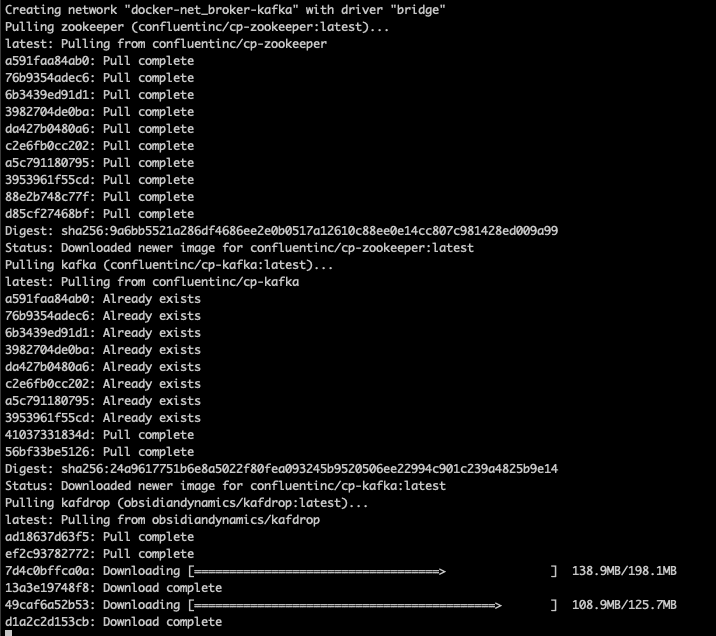
Figure 1. Downloading new Docker images
You may see that the download was successful, and the images started up, as shown in Figure 2.

Figure 2. New images downloaded and started
To check if the network was created, run the following command:
docker network ls
That’ll print the list of networks including the newly created broker-kafka (Figure 3).

Figure 3. Docker network check
To check if the running images include the new Kafdrop, run the command docker ps and compare the results with Figure 4.

Figure 4. Checking the running images via docker ps
Finally, Docker Desktop is the easiest way to check that out. Figure 5 shows how your images should look.
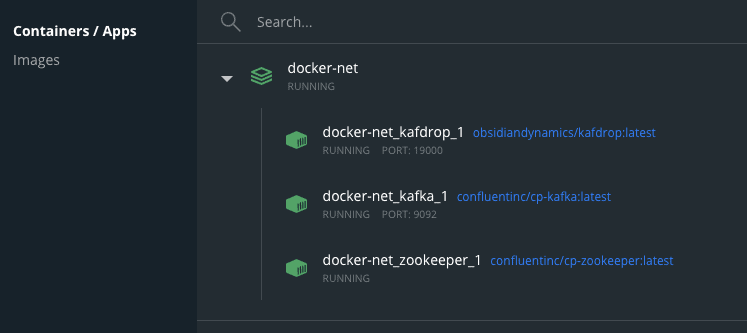
Figure 5. Newly created Docker images on Docker Desktop
That visualization also allows seeing the port in which each image is running. If you click any of the images, Docker Desktop will display the logs of that container live.
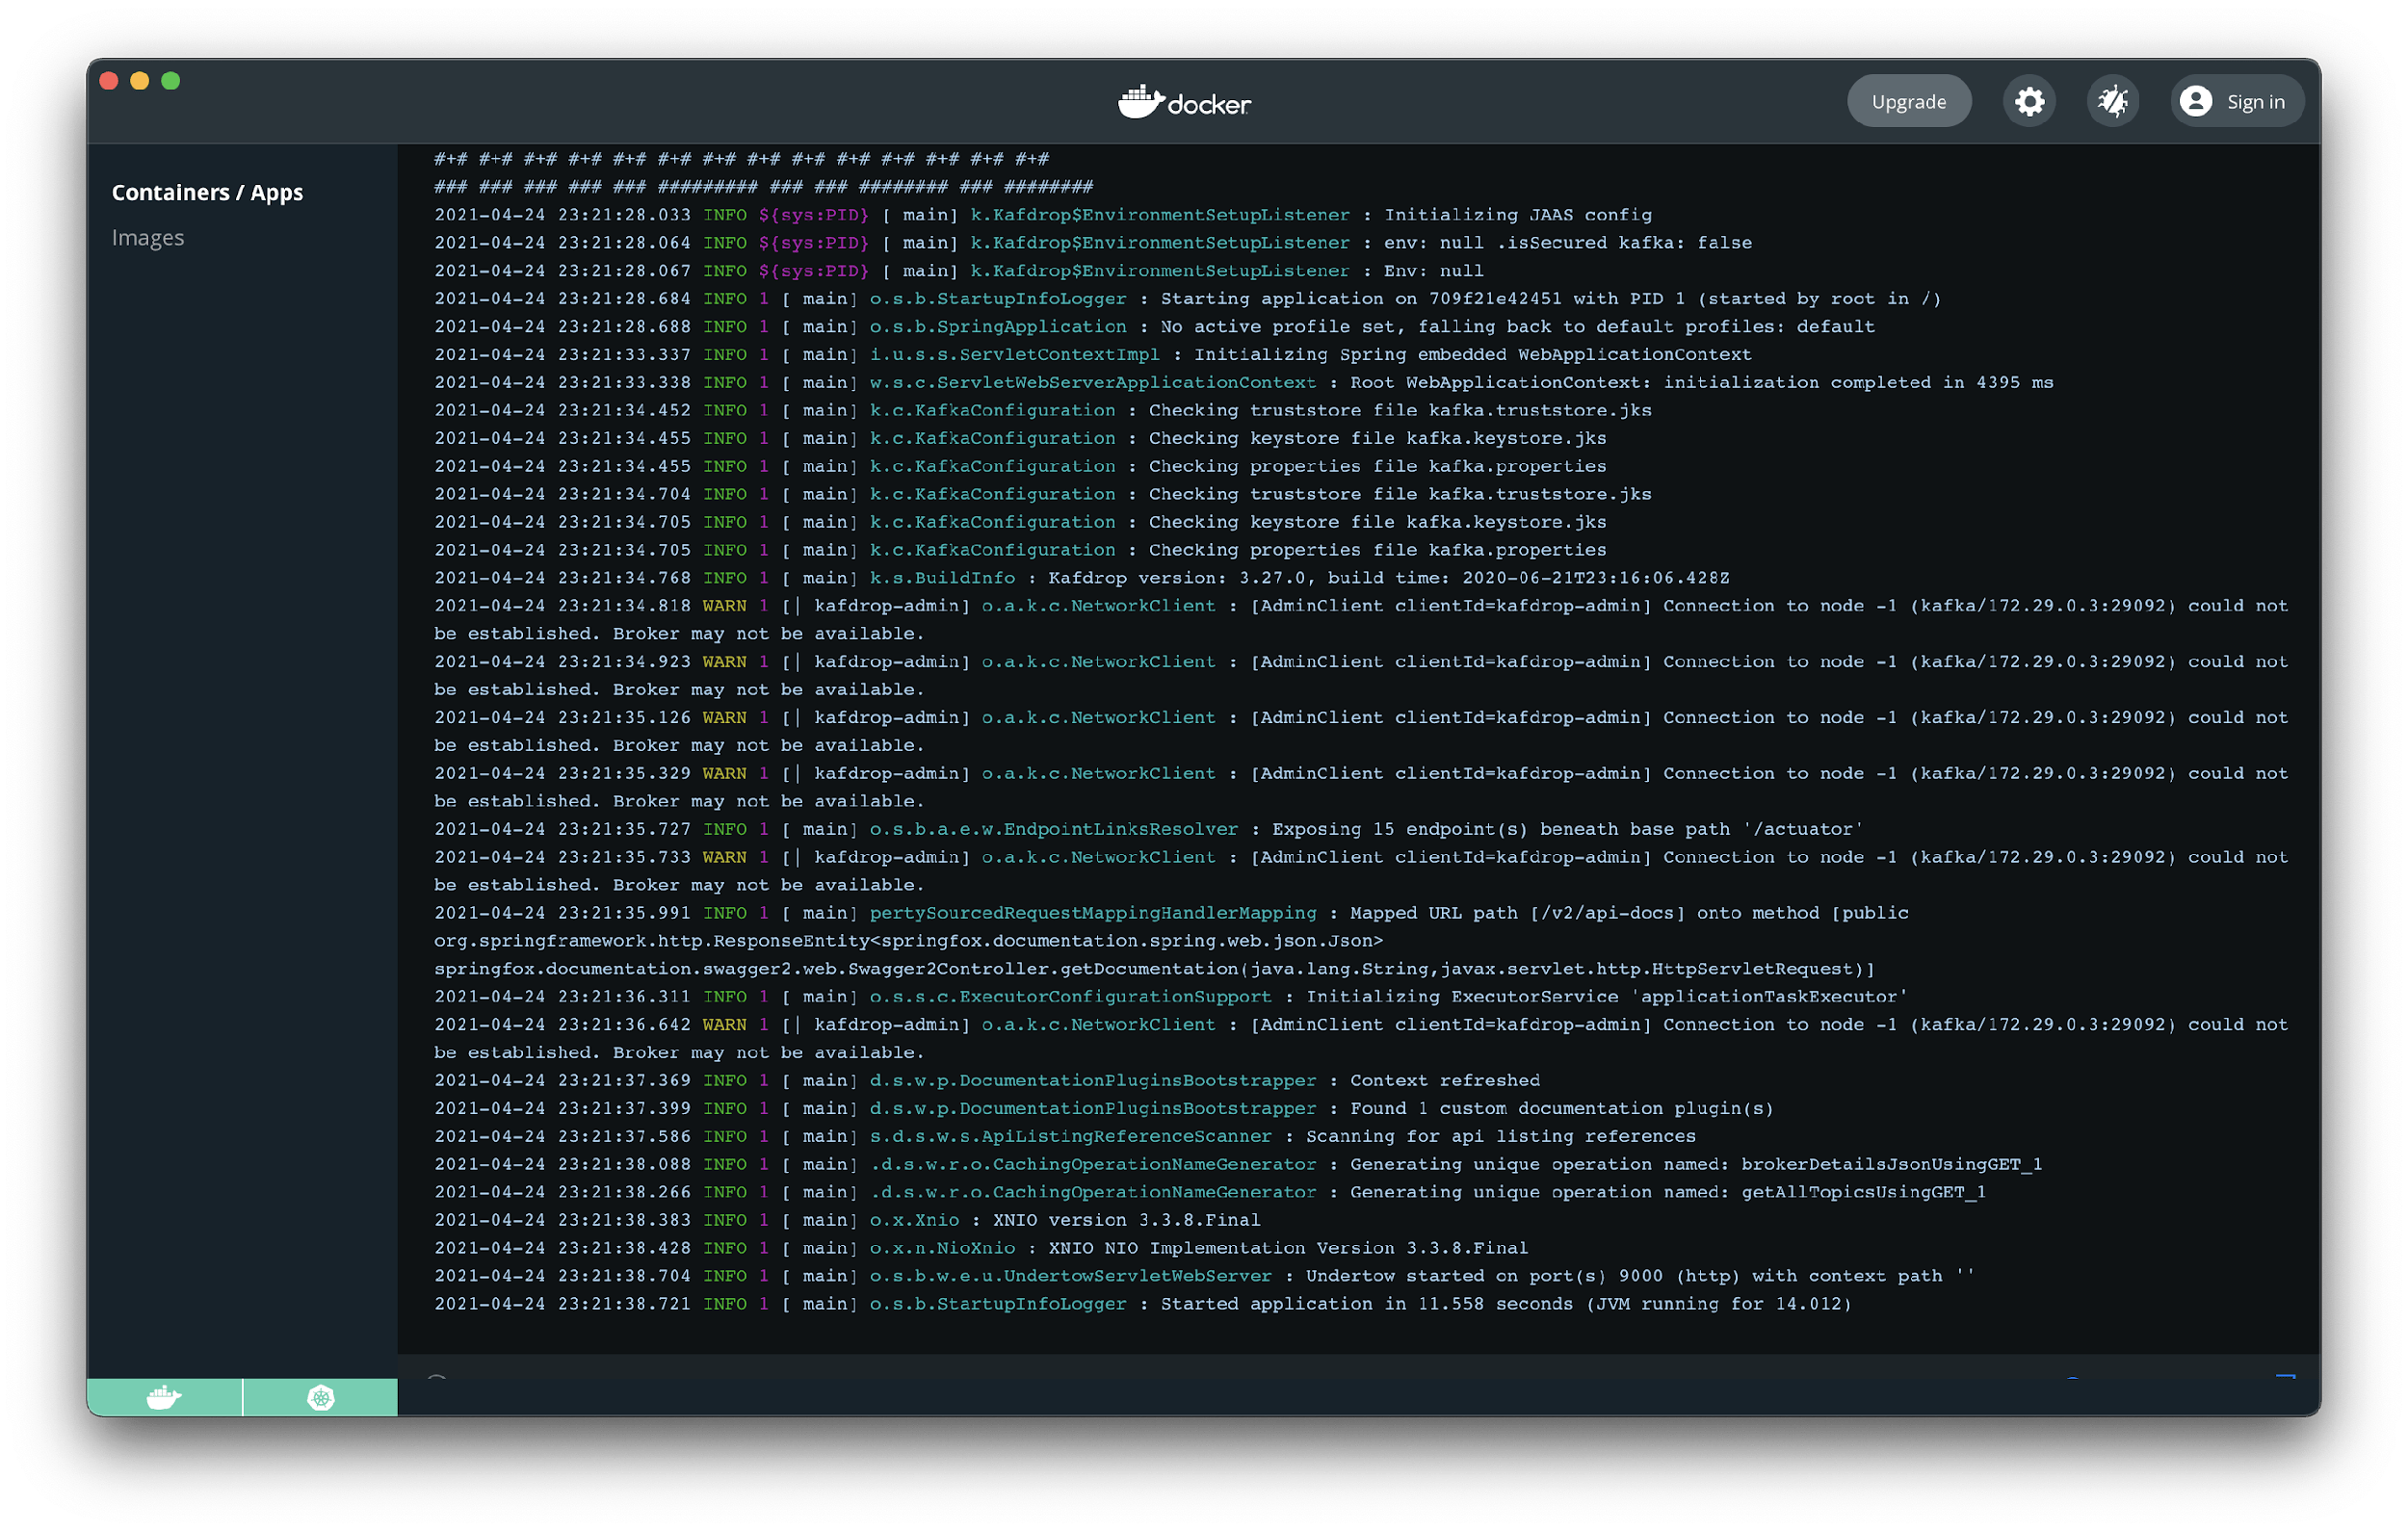
Figure 6. Watching Docker image logs
Exploring Kafdrop
With the configs set, Kafdrop is started at the http://localhost:19000/ address. Figure 7 shows how the interface looks.
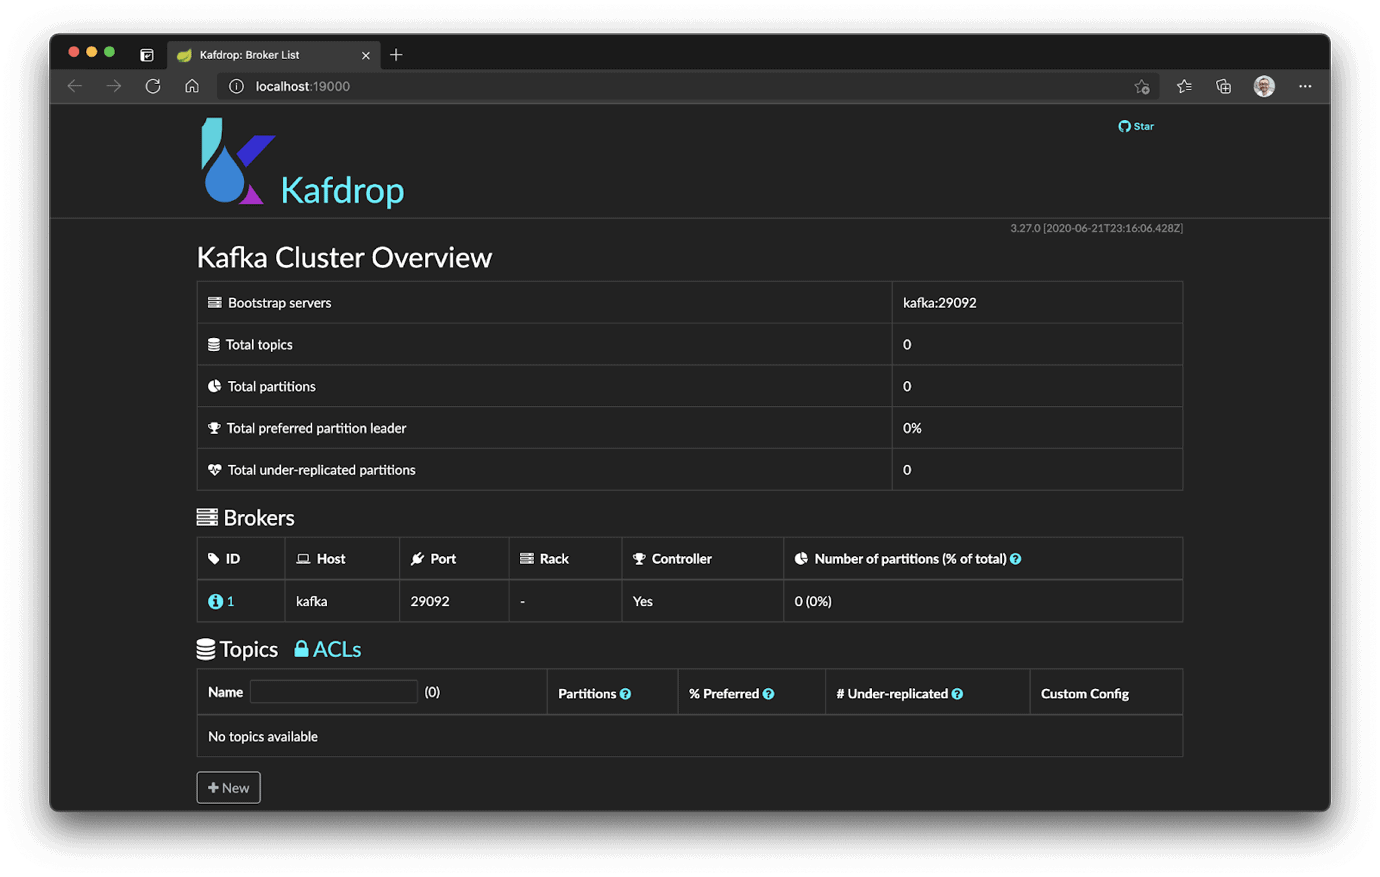
Figure 7. Kafdrop cluster overview
The information is segregated into the broker servers, total topics, and partitions. Kafka is designed to work in a distributed manner, which means that it is usually set up to be within a distributed cluster with more than one bootstrap server. While working locally, however, there’s only one server displayed here.
Also, since the previous Kafka images are removed, there’s no topic available. To change that, start the producer and consumer applications from the previous article.
Go ahead and do that. Once you finish the startup, go back to the Kafdrop page and reload it. You will see a result similar to that shown in Figure 8.
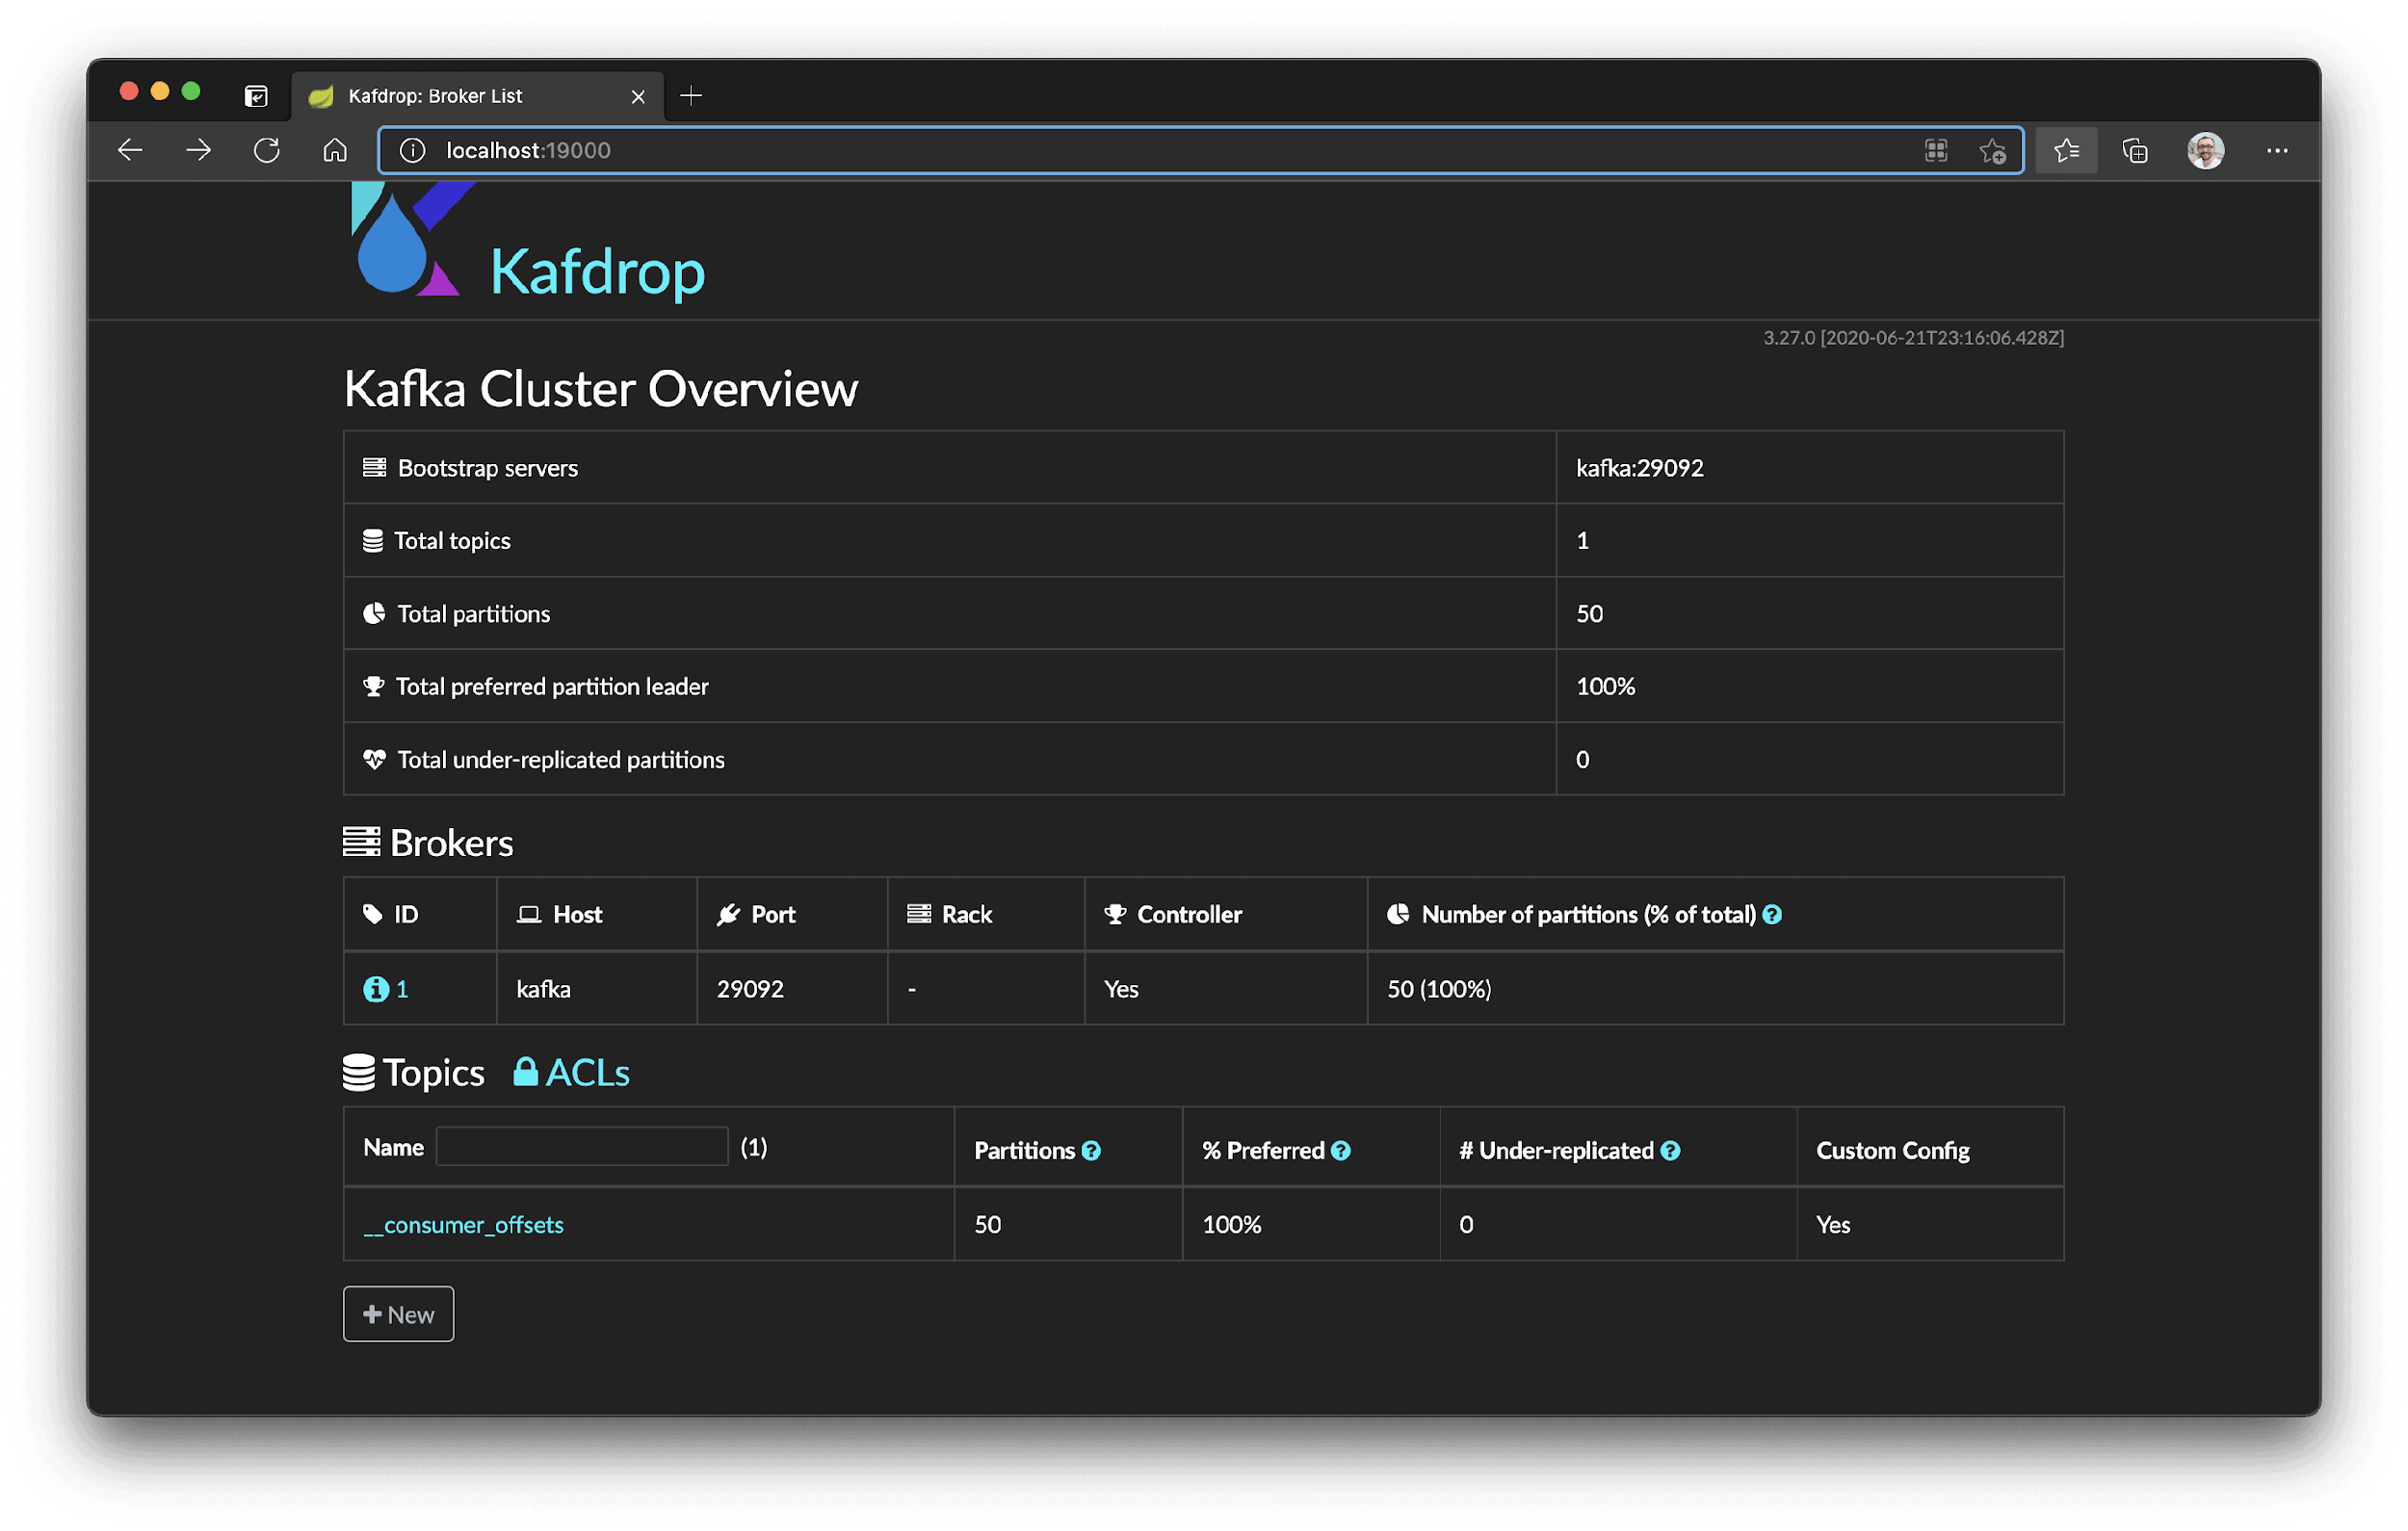
Figure 8. Total topics increased by 1 + __consumer_offsets topic
Since Kafka keeps the state of the messages in storage, the consumer offsets topic is important to keep track of the sequential order in which the messages arrived at the topics.
That’s a way Kafka uses to know where it has stopped from the last time in case the infrastructure that holds the broker shuts down, for example.
This tutorial won’t focus on them, however. As you may guess, besides both producer and consumer are up, the simpletalk_topic is still not visible on the list. That happens because it needs to have some interaction with the topic, such as a new message being sent. That’s when Kafka creates the topic in case it still doesn’t exist.
Send a new message to the topic and see what happens:
curl -H "Content-Length: 0" -X POST "http://localhost:51249/api/kafka?message=Hello,kafka!" -k
The command you enter may be slightly different depending on your setup. The command line window running the Kafka Producer program should tell you what to enter here. When you refresh the Kafdrop page, Figure 9 shows how it must look.
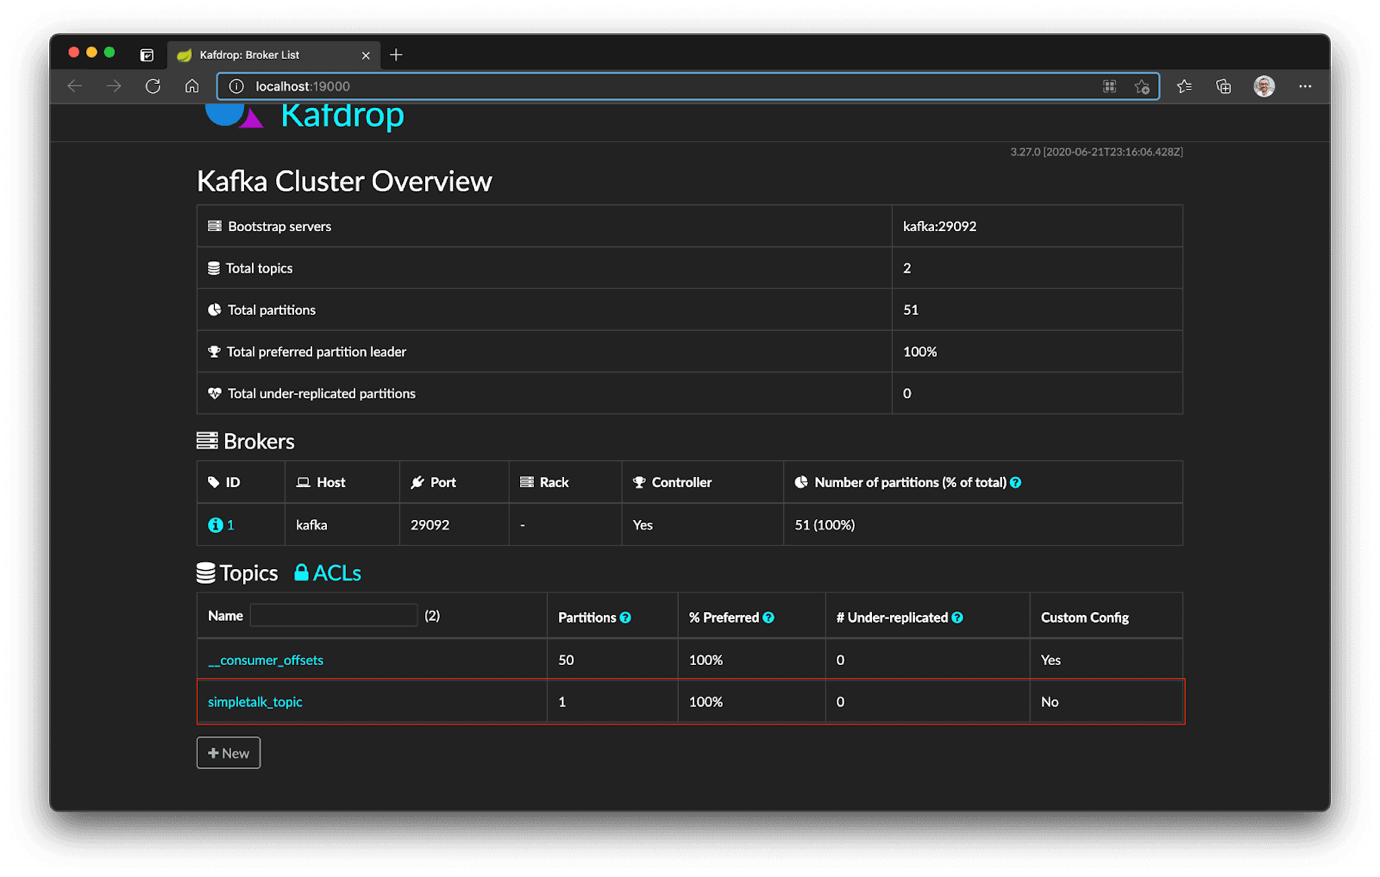
Figure 9. New topic added to the topics list
Nice, isn’t it? If you click the simpletalk_topic link, you’ll be redirected to the page shown in Figure 10.
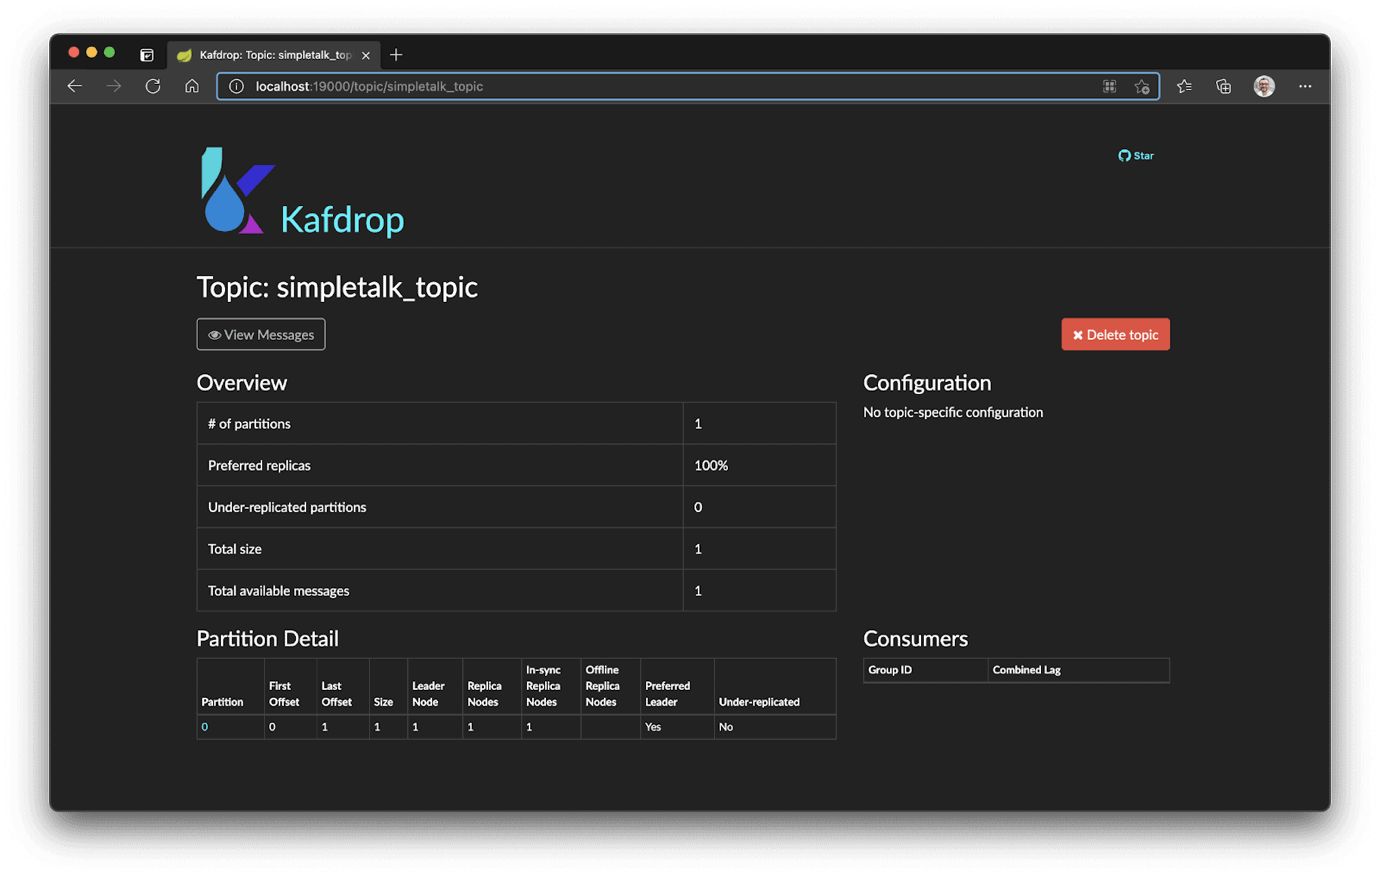
Figure 10. Visualizing simpletalk_topic on Kafdrop
Among the information provided on this page, the most important is related to the number of available messages for the topic. Kafdrop is a great way to visualize problems in a production environment arising from applications that produce and consume from this topic.
If you click the View Messages button on the top of the page, you’ll be redirected to a second page, as shown in Figure 11.
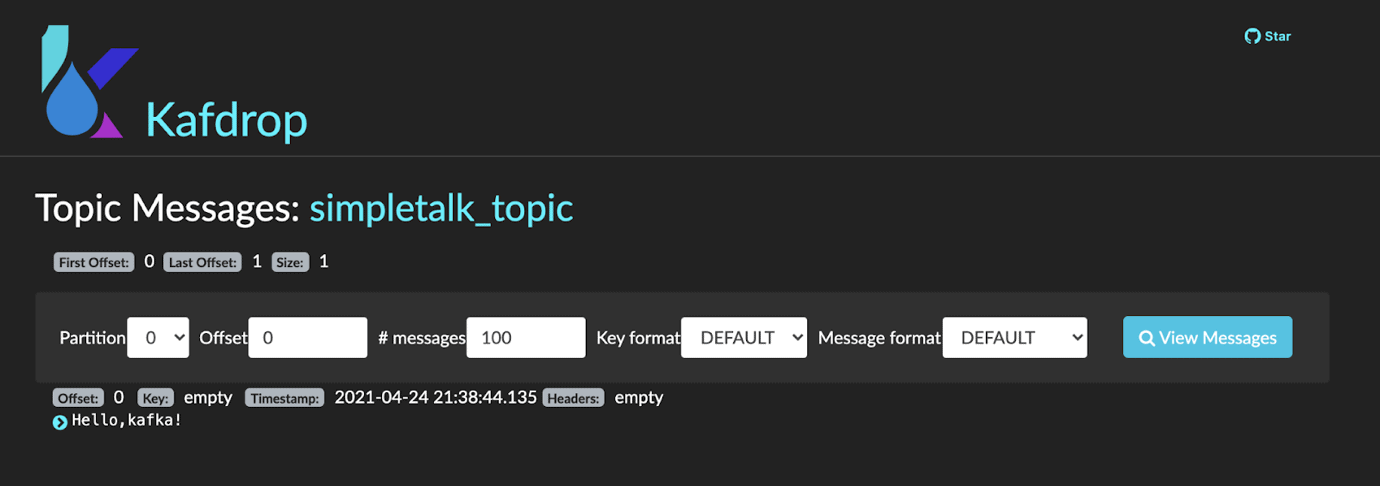
Figure 11. Visualizing the messages of a topic
You may click the View Messages button once more to be able to see the list of messages. Remember that this is just a visualization; it doesn’t mean that a consumer or a group of consumers have consumed the message already.
To see this, make sure that your consumer project has printed the message stating that it has committed the topic consumption. You may need to restart the consumer project to get this to appear. Then, get back to the topic details page, and you may see it as shown below.

Figure 12. Visualizing new consumers attached to a topic
As you see, a new consumer whose group id is “st_consumer_group” is now tied to this topic. If you click it, a more detailed version of the consumer group will show up, as shown in Figure 13.
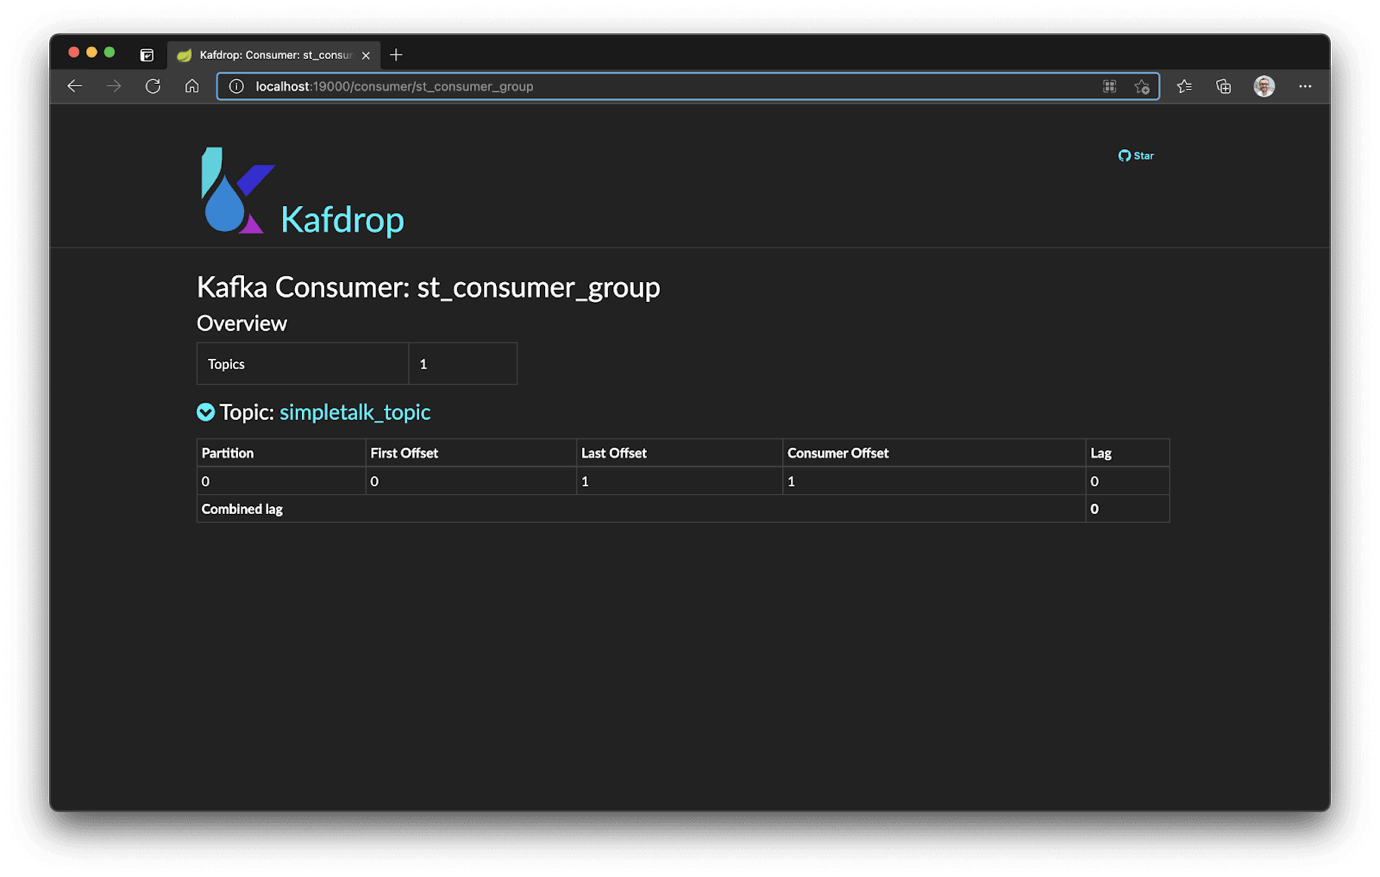
Figure 13. Details about a specific consumer group
The Last Offset column states the current latest offset for the entire topic, regardless of who consumed its messages. The Consumer Offset, in turn, stands for the offset at which the current consumer group is at. The value 1 means that all the published messages were already consumed by this consumer.
If you wish, you’ll be able to create a new topic via Kafdrop by clicking the + New button located on the homepage. This will enable the following screen for you to finalize the creation.
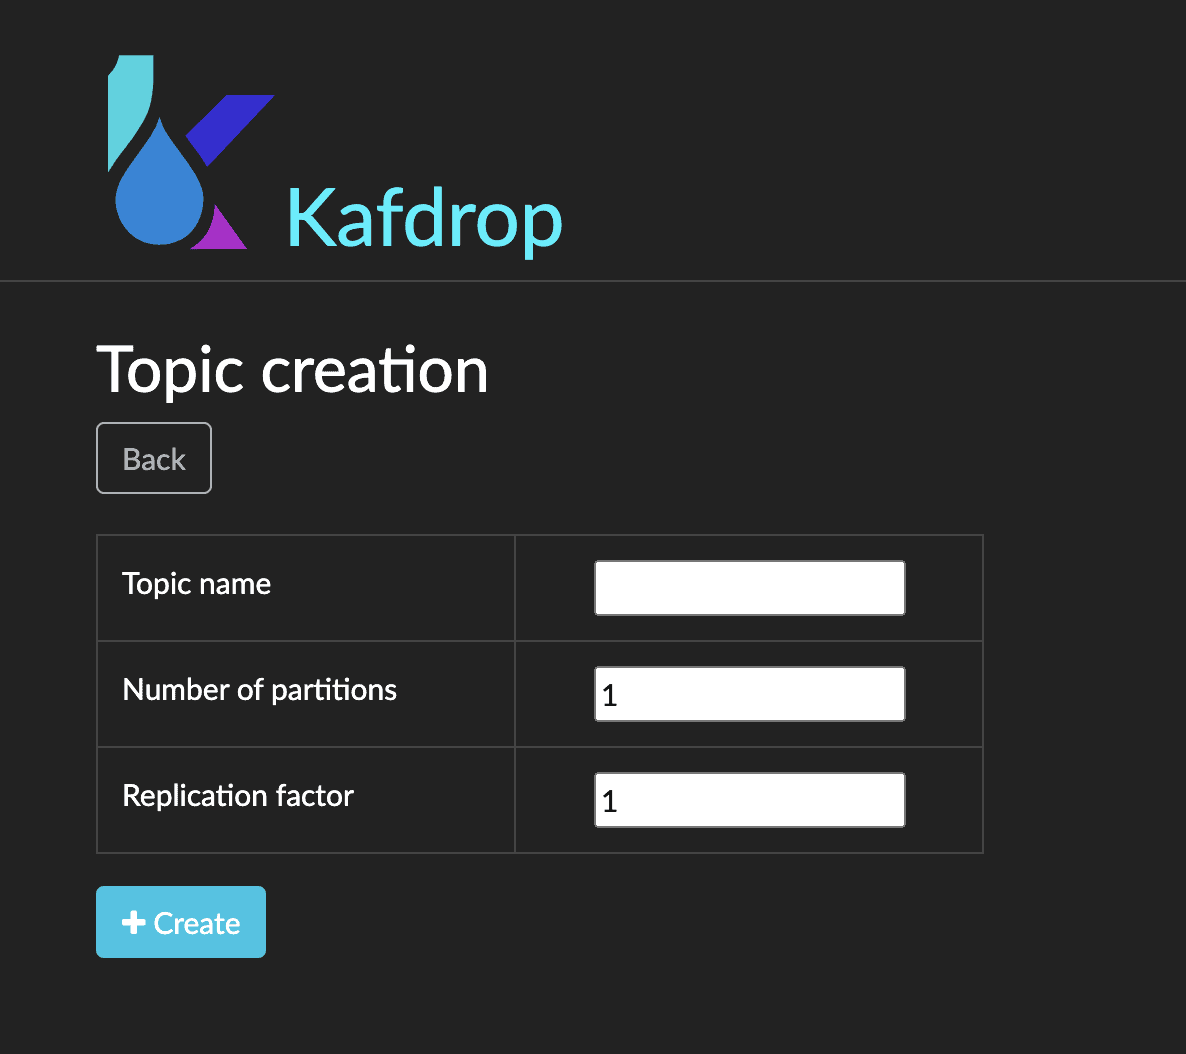
Figure 14. Creating a new topic with Kafdrop
Swagger Integration
If you wish to document your Kafka topics, consumers, etc., in an API-related way, Kafdrop also provides you with integration with Swagger.
Towards the endpoint localhost:19000/v2/api-docs, you’ll be able to see all the Swagger 2.0 Open Specification JSON that you can use to document and run endpoints on your Kafdrop environment. That’s another alternative for those who don’t want to explicitly allow access to Kafdrop UI for all users.
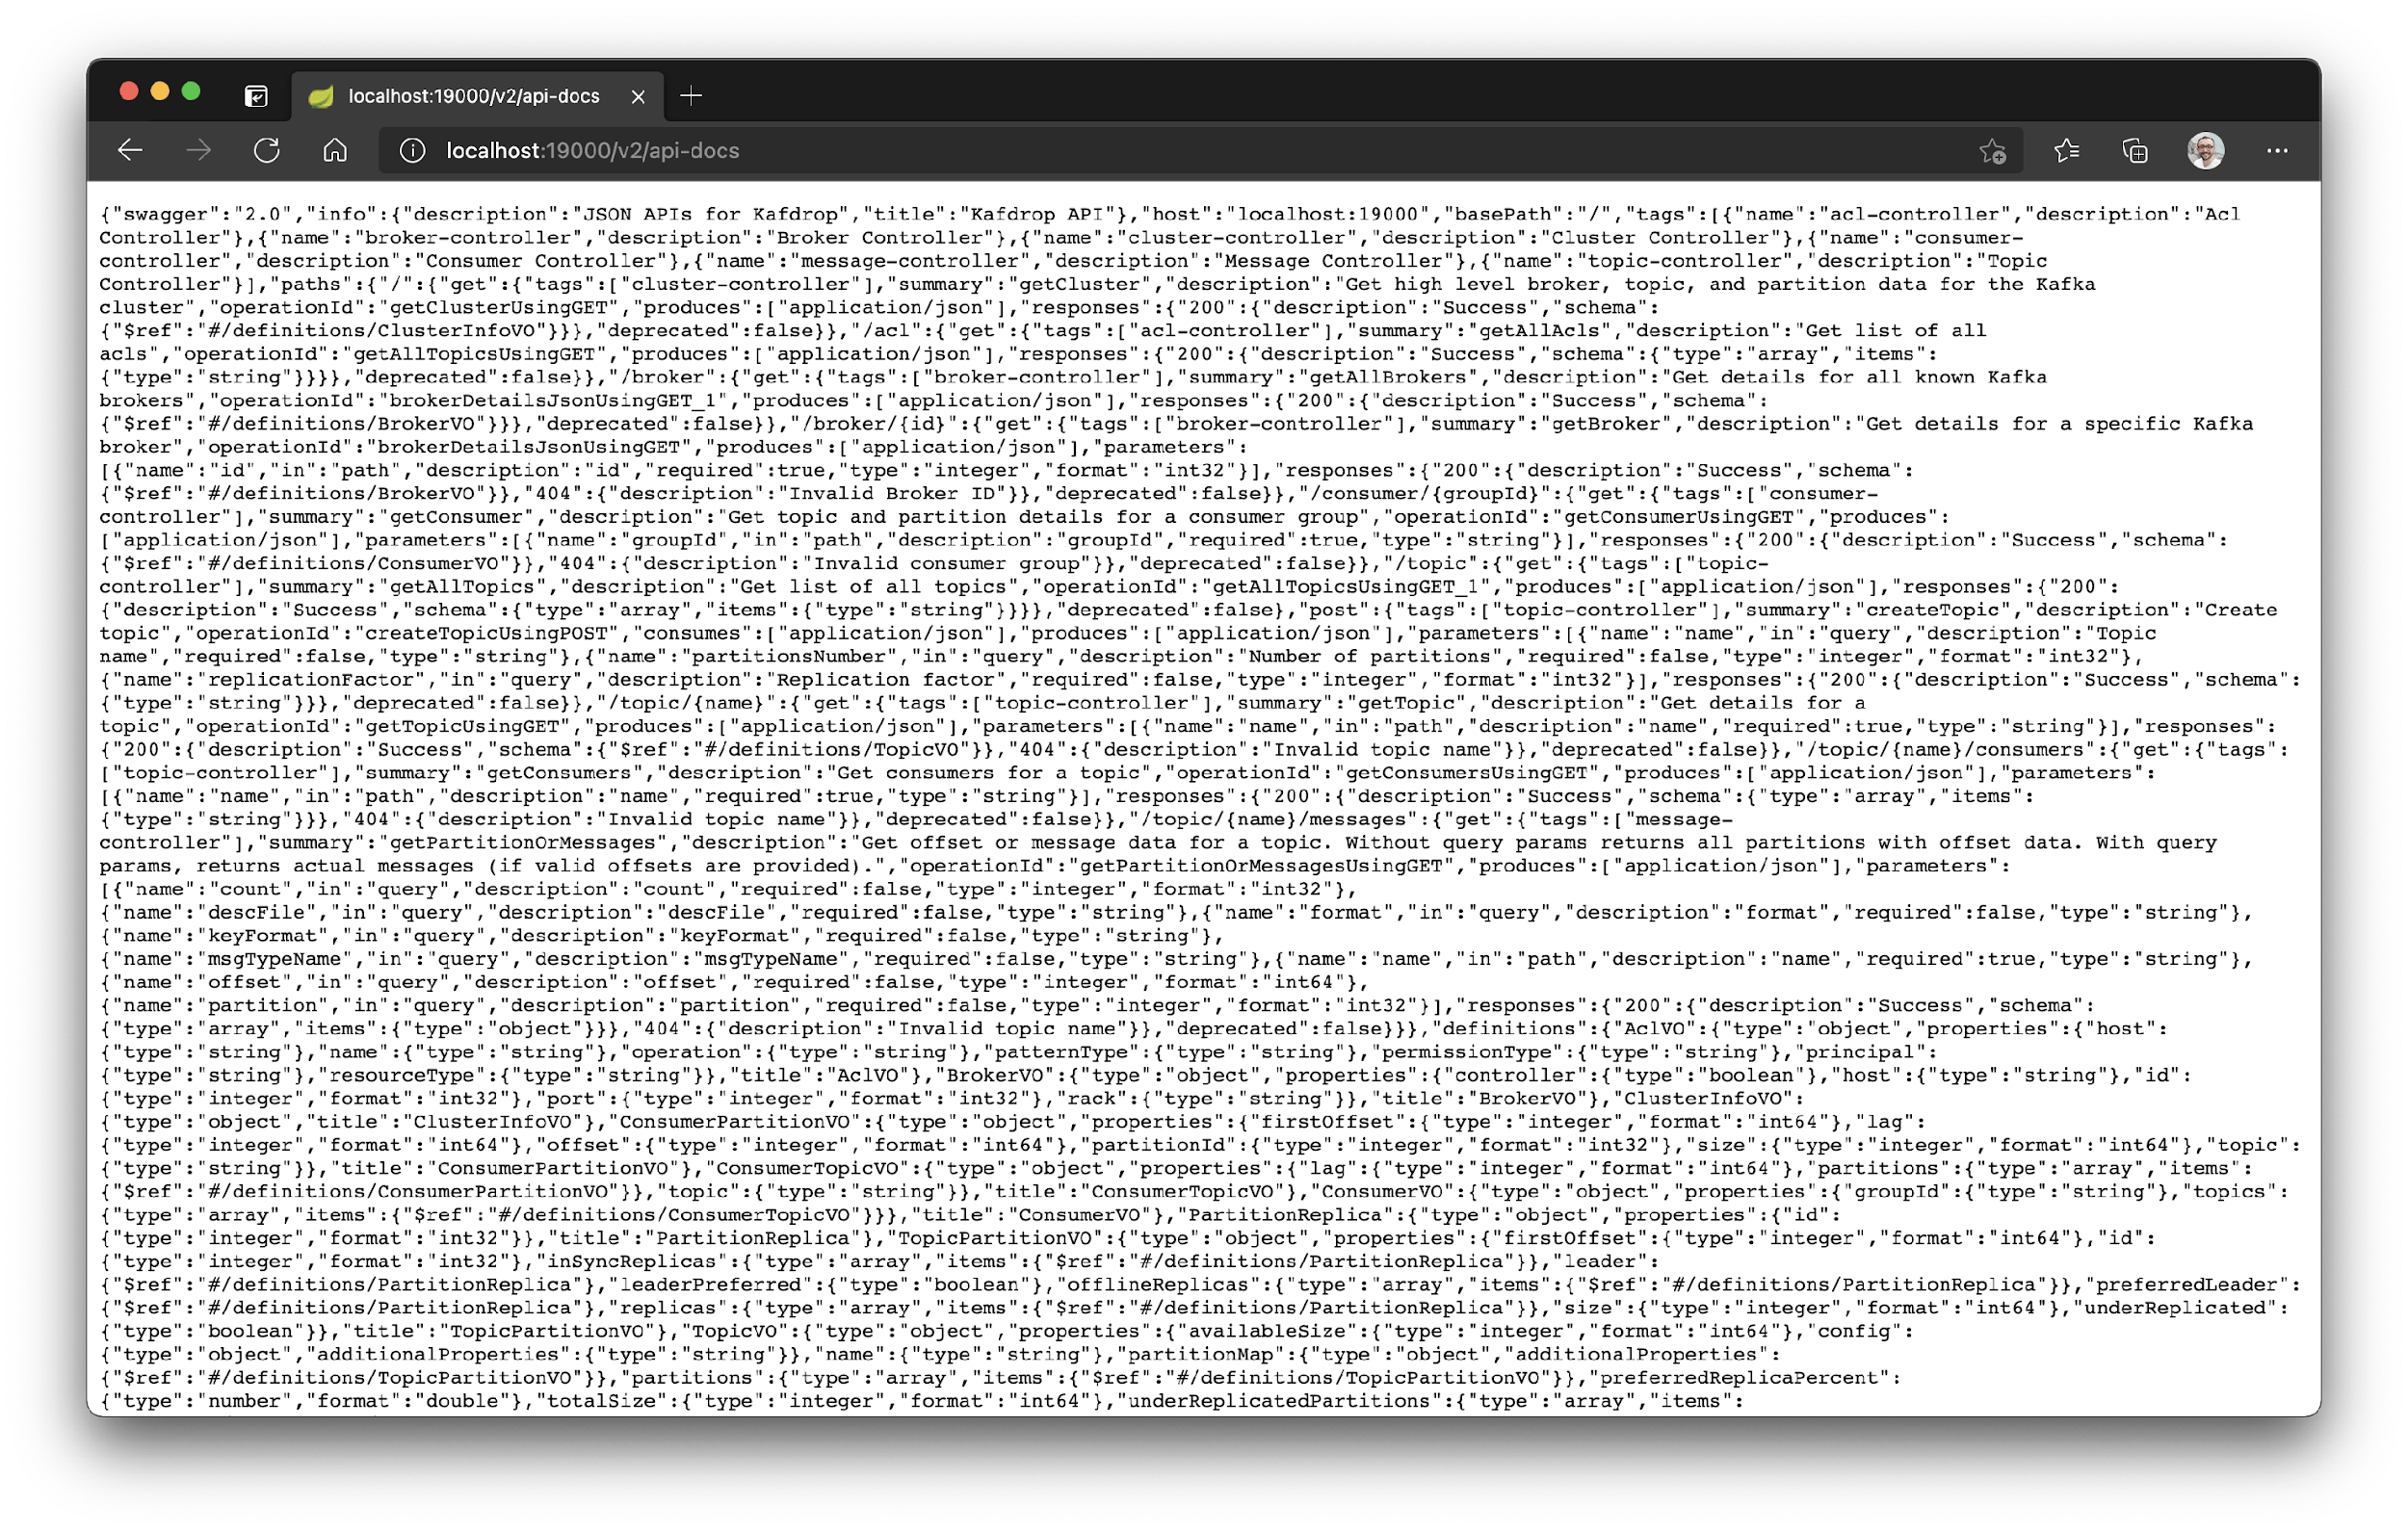
Figure 15. Swagger API docs for Kafdrop
If you’re used to working with micro metrics, and since Kafdrop is made with Spring and Java, it also provides an endpoint for the app metrics at localhost:19000/actuator.
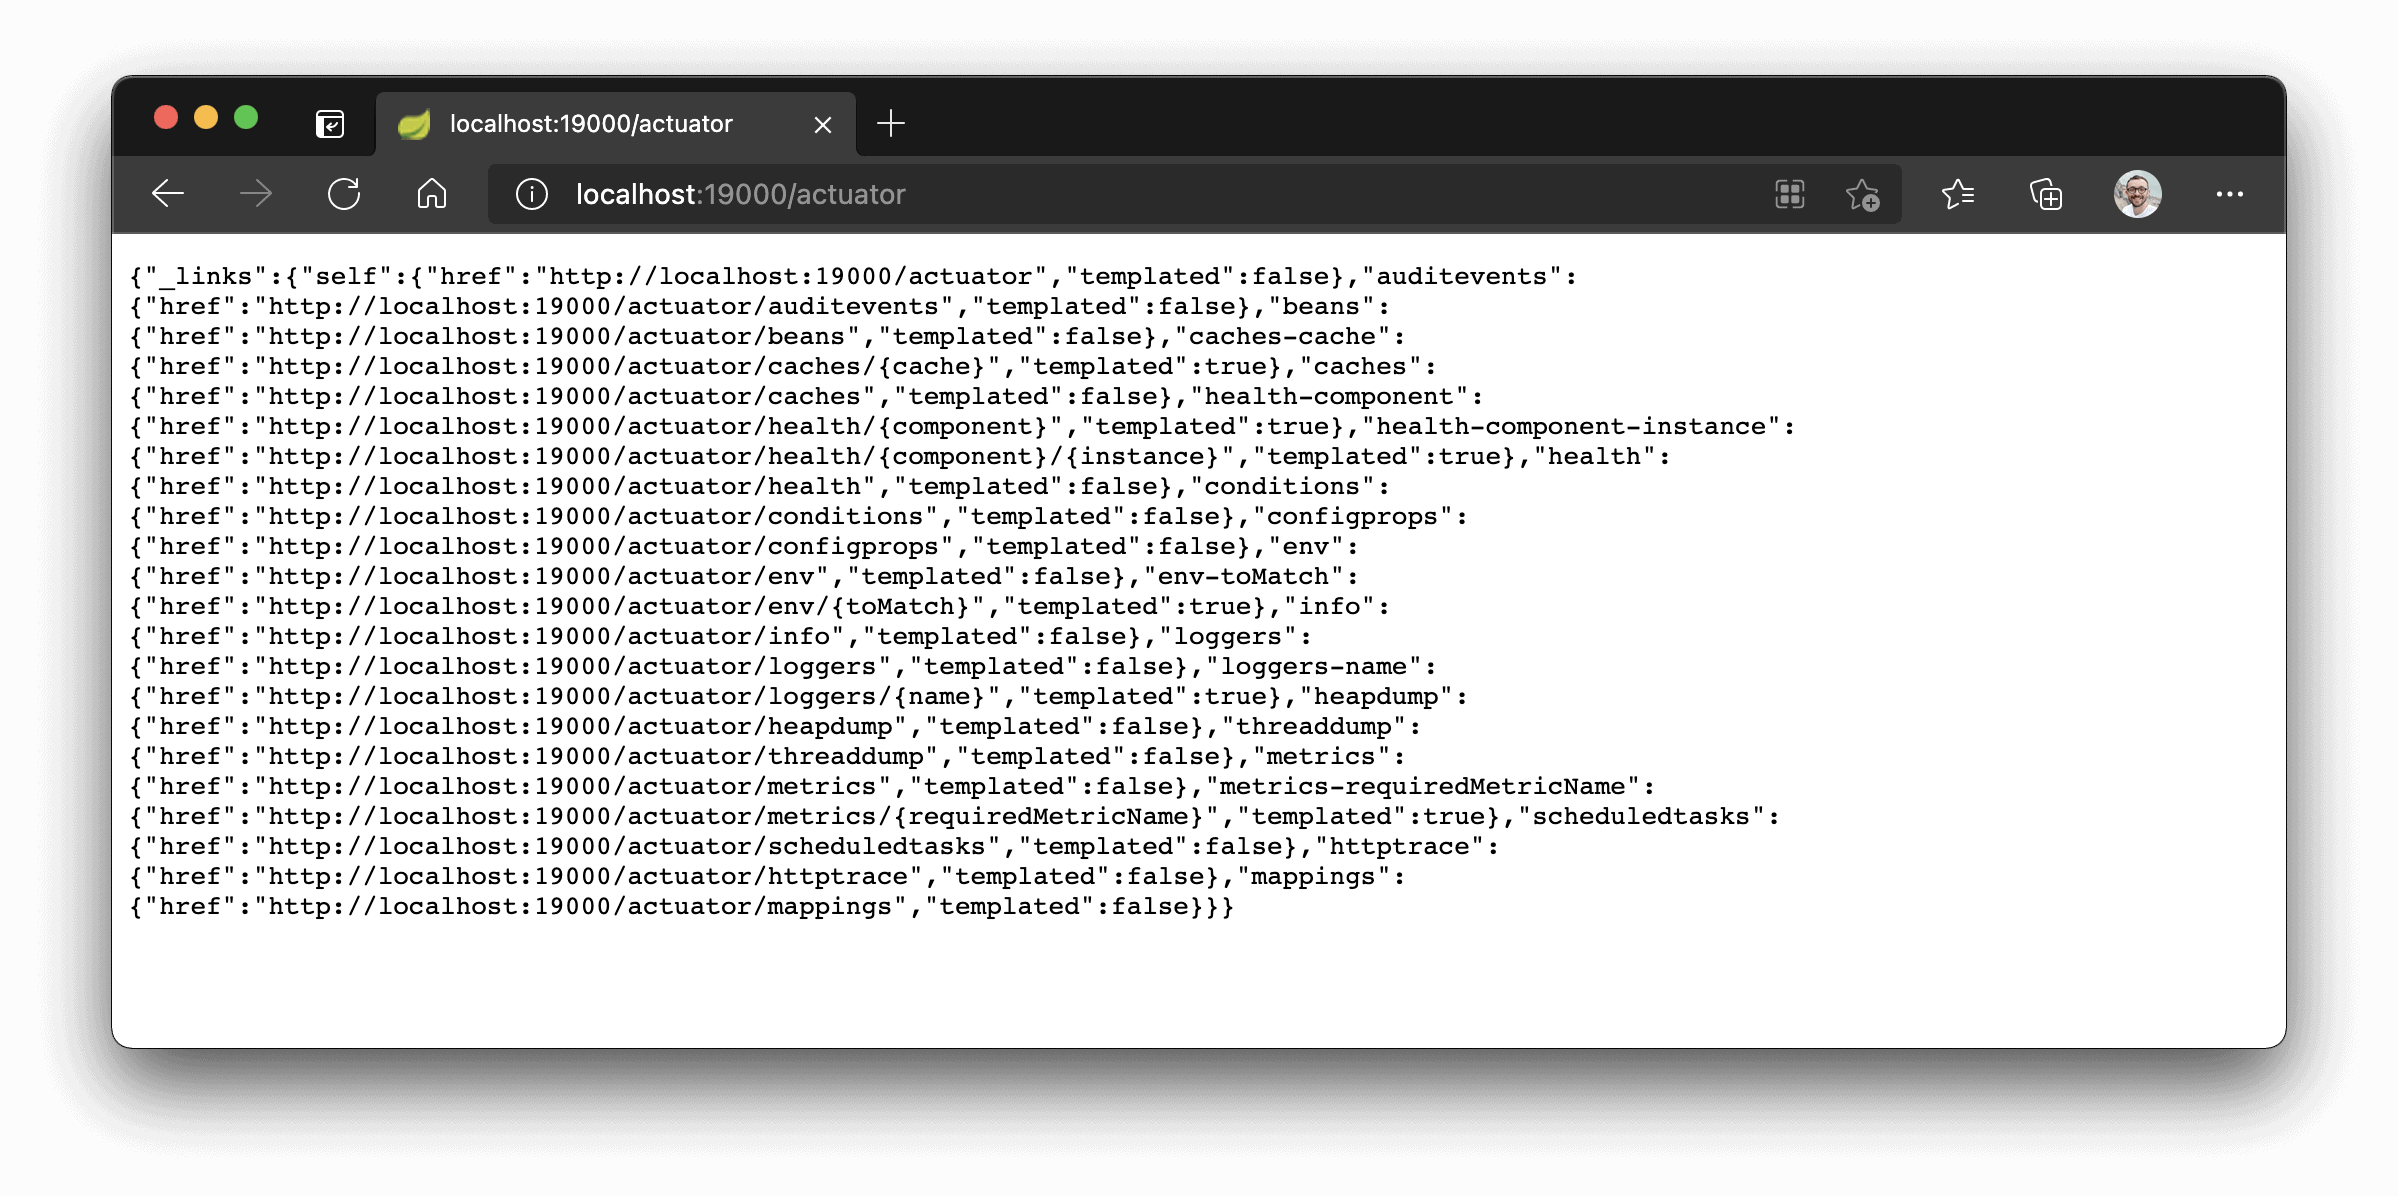
Figure 16. Kafdrop micro metrics via Actuator
That’s very useful when you already have automatic monitor tools that check the health of your infrastructure apps as well as other factors and alarm based on failing scenarios.
Setting Up a Kafka Test Environment with Kafdrop
Kafdrop is a great option for allowing a better-integrated environment not only for testing purposes but also for development and operational activities within your company. With it, you’re able to visualize your entire Kafka cluster, including the topics, consumer groups, messages, offsets, and more.
How about you? Have you used any similar tool in the past? Let me know in the comments about your experience with them.
The post Setting up a Kafka test environment with Kafdrop appeared first on Simple Talk.
from Simple Talk https://ift.tt/3tyTCSg
via
No comments:
Post a Comment