Wednesday, May 31, 2023

The Importance of Tact

The concept of tact is simple. Telling people truths, often harsh truths, without making it seem harsh. Hopefully, it is clear that being truthful is one of the more essential things in life. As a person in technology (and certainly as an editor), we often need to be honest when the truth hurts a bit more than average.

For example, consider the security manager dealing with one of their coworkers who just clicked on a phishing link that caused the company to lose an hour of data (or day or week.) Without more information, it seems clear that the coworker should be escorted off the premises. Well, at least after listening to a 20-hour rant that would take this blog post from a general audience rating to something far closer than a full-on mature rating.

With these extreme consequences in mind, the next step is determining who this security lecture will be directed at. A recent hire, a company veteran, the CIO, maybe even the company’s owner. How you handle this situation requires knowledge of the audience and shovelfuls of tact based on who the perpetrator turns out to be. You probably can’t terminate the owner, but if you are not tactful enough in handling that situation, whoever replaces you will probably be quite tactful when helping you carry your personal effects to the car.

Most of the time, the need is more subtle than this. You might be leading a code review, a design meeting, or tech editing a piece of writing. Letting others know their shortcomings and failures in a way that informs them without crushing them is a delicate balance. For example, coaching a 10-year-old football team (no matter what you think of when you hear football) is far different than coaching a professional team. Even though it is essentially the same game, the necessary skills to be a coach are very different.

On the other hand, there is one person in this world you should not be tactful with. If you want to pause to think of all the funny answers, the webpage will wait as long as you need. Unfortunately, this person who needs the least tact is often the one you are most tactful with, trying to make this person feel better about everything they do.

The person you be the least tactful with is yourself.

If telling your company owner that they were the cause of a million dollars worth of data damage because they clicked on a link that was supposed to help out their private life is hard… telling yourself the same thing is almost impossible. Oh, I was distracted. I thought that was an actual link… everything except that you messed up, and it is your fault, and you must do better.

Most of us have lied to ourselves for so long about so many things we don’t even know the truth. Some of us hold ourselves in such high regard we can’t even see our limitations. Reminding yourself that you aren’t able to do something is one of the most brutal truths we need to tell ourselves.

The post The Importance of Tact appeared first on Simple Talk.


from Simple Talk https://ift.tt/md1ibpP
via

Monday, May 29, 2023

T-SQL Gap-Filling Challenge

A student of mine sent me a T-SQL challenge involving gap-filling of missing dates and balances. I found the challenge interesting and common enough and figured that my readers would probably find it interesting to work on as well.

I’ll present the challenge and three possible solutions, as well as the results of a performance test. AS always, I urge you to try and come up with your own solutions before looking at mine.

If you would like to download the code including the solutions, you can find it in a .zip file here.

The Challenge

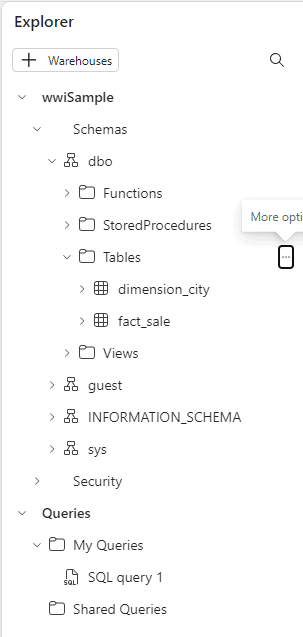
The challenge involves two tables called Workdays and Balances. The Workdays table holds the dates of all workdays going back a few years. The Balances table holds account IDs, dates of workdays when the account balance changed, and the balance on the current date. There’s a foreign key on the date column in the Balances table referencing the date column in the Workdays table.

Use the following code to create the Workdays and Balances tables:

SET NOCOUNT ON;

USE tempdb;

DROP TABLE IF EXISTS dbo.Balances, dbo.Workdays;
GO

CREATE TABLE dbo.Workdays
(
  dt DATE NOT NULL,
  CONSTRAINT PK_Workdays PRIMARY KEY(dt)
);

CREATE TABLE dbo.Balances
(
  accountid INT NOT NULL,
  dt DATE NOT NULL
    CONSTRAINT FK_Balances_Workdays REFERENCES dbo.Workdays,
  balance NUMERIC(12, 2) NOT NULL,
  CONSTRAINT PK_Balances PRIMARY KEY(accountid, dt)
);

Note that the definition of the primary key constraint on Workdays results in a clustered index with dt as the key. Similarly, the definition of the primary key constraint on Balances results in a clustered index with (accountid, dt) as the key.

To generate the sample data for this challenge, you will need a helper function that returns a sequence of integers in a desired range. You can use the GetNums function for this purpose, which you create using the following code:

CREATE OR ALTER FUNCTION dbo.GetNums
      (@low AS BIGINT = 1, @high AS BIGINT)
  RETURNS TABLE
AS
RETURN
  WITH
    L0 AS ( SELECT 1 AS c 
            FROM (VALUES(1),(1),(1),(1),(1),(1),(1),(1),
                        (1),(1),(1),(1),(1),(1),(1),(1)) AS D(c) ),
    L1 AS ( SELECT 1 AS c FROM L0 AS A CROSS JOIN L0 AS B ),
    L2 AS ( SELECT 1 AS c FROM L1 AS A CROSS JOIN L1 AS B ),
    L3 AS ( SELECT 1 AS c FROM L2 AS A CROSS JOIN L2 AS B ),
    Nums AS ( SELECT ROW_NUMBER() 
                       OVER(ORDER BY (SELECT NULL)) AS rownum
              FROM L3 )
  SELECT TOP(@high - @low + 1)
     rownum AS rn,
     @high + 1 - rownum AS op,
     @low - 1 + rownum AS n
  FROM Nums
  ORDER BY rownum;

Alternatively, if you’re using SQL Server 2022 or Azure SQL Database, you can use the built-in GENERATE_SERIES function instead. In my examples I’ll use the GetNums function.

Use the following code to populate the Workdays table with dates in 2013 through 2022 excluding weekends as sample data:

DECLARE @start AS DATE = '20130101', @end AS DATE = '20221231';

INSERT INTO dbo.Workdays(dt)
  SELECT A.dt
  FROM dbo.GetNums(0, DATEDIFF(day, @start, @end)) AS N
    CROSS APPLY (VALUES(DATEADD(day, N.n, @start))) AS A(dt)
  -- exclude Saturday and Sunday
  WHERE DATEDIFF(day, '19000107', dt) % 7 + 1 NOT IN (1, 7);

Normally, dates of holidays would also be excluded from the table, but for our testing purposes we can keep things simple and just exclude weekends.

As for the Balances table; to check the logical correctness of your solutions, you can use the following code, which populates the table with a small set of sample data:

TRUNCATE TABLE dbo.Balances;

INSERT INTO dbo.Balances(accountid, dt, balance)
  VALUES(1, '20220103', 8000.00),
        (1, '20220322', 10000.00),
        (1, '20220607', 15000.00),
        (1, '20221115', 7000.00),
        (1, '20221230', 4000.00),
        (2, '20220118', 12000.00),
        (2, '20220218', 14000.00),
        (2, '20220318', 16000.00),
        (2, '20220418', 18500.00),
        (2, '20220518', 20400.00),
        (2, '20220620', 19000.00),
        (2, '20220718', 21000.00),
        (2, '20220818', 23200.00),
        (2, '20220919', 25500.00),
        (2, '20221018', 23400.00),
        (2, '20221118', 25900.00),
        (2, '20221219', 28000.00);

The task involves developing a stored procedure called GetBalances that accepts a parameter called @accountid representing an account ID. The stored procedure should return a result set with all existing dates and balances for the input account, but also gap-filled with the dates of the missing workdays between the existing minimum and maximum dates for the account, along with the last known balance up to that point. The result should be ordered by the date.

Once you have written your code, you can use the following code to test your solution for correctness with account ID 1 as input:

EXEC dbo.GetBalances @accountid = 1;

With the small set of sample data you should get an output with the following 260 rows, shown here in abbreviated form:

dt         balance
---------- --------
2022-01-03 8000.00
2022-01-04 8000.00
2022-01-05 8000.00
2022-01-06 8000.00
2022-01-07 8000.00
...
2022-03-21 8000.00
2022-03-22 10000.00
2022-03-23 10000.00
2022-03-24 10000.00
2022-03-25 10000.00
2022-03-28 10000.00
...
2022-06-06 10000.00
2022-06-07 15000.00
2022-06-08 15000.00
2022-06-09 15000.00
2022-06-10 15000.00
2022-06-13 15000.00
...
2022-11-14 15000.00
2022-11-15 7000.00
2022-11-16 7000.00
2022-11-17 7000.00
2022-11-18 7000.00
2022-11-21 7000.00
...
2022-12-29 7000.00
2022-12-30 4000.00

Test your solution with account ID 2 as input:

EXEC dbo.GetBalances @accountid = 2;

You should get an output with the following 240 rows, shown here in abbreviated form:

dt         balance
---------- --------
2022-01-18 12000.00
2022-01-19 12000.00
2022-01-20 12000.00
2022-01-21 12000.00
2022-01-24 12000.00
...
2022-02-17 12000.00
2022-02-18 14000.00
2022-02-21 14000.00
2022-02-22 14000.00
2022-02-23 14000.00
2022-02-24 14000.00
...
2022-03-17 14000.00
2022-03-18 16000.00
2022-03-21 16000.00
2022-03-22 16000.00
2022-03-23 16000.00
2022-03-24 16000.00
...
2022-04-15 16000.00
2022-04-18 18500.00
2022-04-19 18500.00
2022-04-20 18500.00
2022-04-21 18500.00
2022-04-22 18500.00
...
2022-05-17 18500.00
2022-05-18 20400.00
2022-05-19 20400.00
2022-05-20 20400.00
2022-05-23 20400.00
2022-05-24 20400.00
...
2022-06-17 20400.00
2022-06-20 19000.00
2022-06-21 19000.00
2022-06-22 19000.00
2022-06-23 19000.00
2022-06-24 19000.00
...
2022-07-15 19000.00
2022-07-18 21000.00
2022-07-19 21000.00
2022-07-20 21000.00
2022-07-21 21000.00
2022-07-22 21000.00
...
2022-08-17 21000.00
2022-08-18 23200.00
2022-08-19 23200.00
2022-08-22 23200.00
2022-08-23 23200.00
2022-08-24 23200.00
...
2022-09-16 23200.00
2022-09-19 25500.00
2022-09-20 25500.00
2022-09-21 25500.00
2022-09-22 25500.00
2022-09-23 25500.00
...
2022-10-17 25500.00
2022-10-18 23400.00
2022-10-19 23400.00
2022-10-20 23400.00
2022-10-21 23400.00
2022-10-24 23400.00
...
2022-11-17 23400.00
2022-11-18 25900.00
2022-11-21 25900.00
2022-11-22 25900.00
2022-11-23 25900.00
2022-11-24 25900.00
...
2022-12-16 25900.00
2022-12-19 28000.00

Performance Testing Technique

To test the performance of your solutions you will need to populate the Balances table with a larger set of sample data. You can use the following code for this purpose:

DECLARE
  @numaccounts AS INT = 100000,
  @maxnumbalances AS INT = 24,
  @maxbalanceval AS INT = 500000,
  @mindate AS DATE = '20220101',
  @maxdate AS DATE = '20221231';

TRUNCATE TABLE dbo.Balances;

INSERT INTO dbo.Balances WITH (TABLOCK) (accountid, dt, balance)
  SELECT 
      A.accountid, 
      B.dt, 
    CAST(ABS(CHECKSUM(NEWID())) % @maxbalanceval AS NUMERIC(12, 2)) 
                                                          AS balance
  FROM (SELECT n AS accountid, 
               ABS(CHECKSUM(NEWID())) % @maxnumbalances + 1 AS numbalances
        FROM dbo.GetNums(1, @numaccounts)) AS A
    CROSS APPLY (SELECT TOP (A.numbalances) W.dt                   
                 FROM dbo.Workdays AS W
                 WHERE W.dt BETWEEN @mindate AND @maxdate
                 ORDER BY CHECKSUM(NEWID())) AS B;

This code sets parameters for the sample data before filling the table. The performance results that I’ll share in this article were based on sample data created with the following parameter values:

  • Number of accounts: 100,000
  • Number of balances per account: random number between 1 and 24
  • Balance dates: chosen randomly from Workdays within the range 2022-01-01 to 2022-12-31

Using the above parameters, the sample data resulted in about 1,250,000 rows in the Balances table. That’s an average of about 12.5 balances per account before gap filling. After gap filling the average number of balances per account was about 200. That’s the average number of rows returned from the stored procedure.

If you need to handle a similar task in your environment, of course you can feel free to alter the input parameters to reflect your needs.

The requirement from our stored procedure is to have a sub-millisecond runtime as it’s expected to be executed very frequently from many concurrent sessions.

If you’re planning to test your solutions from SSMS, you’d probably want to run them in a loop with many iterations, executing the stored procedure with a random input account ID in each iteration. You can measure the total loop execution time and divide it by the number of iterations to get the average duration per proc execution.

Keep in mind though that looping in T-SQL is quite expensive. To account for this, you can measure the time it takes the loop to run without executing the stored procedure and subtract it from the time it takes it to run including the execution of the stored procedure.

Make sure to check “Discard results after execution” in the SSMS Query Options… dialog to eliminate the time it takes SSMS to print the output rows. Your test will still measure the procedure’s execution time including the time it takes SQL Server to transmit the result rows to the SSMS client, just without printing them. Also, make sure to not turn on Include Actual Execution Plan in SSMS.

Based on all of the above, you can use the following code to test your solution proc with 100,000 iterations, and compute the average duration per proc execution in microseconds:

DECLARE 
  @numaccounts AS INT = 100000, 
  @numiterations AS INT = 100000,
  @i AS INT, 
  @curaccountid AS INT,
  @p1 AS DATETIME2, @p2 AS DATETIME2, @p3 AS DATETIME2,
  @duration AS INT;

-- Run loop without proc execution to measure loop overhead
SET @p1 = SYSDATETIME();
SET @i = 1;
WHILE @i <= @numiterations
BEGIN
  SET @curaccountid = ABS(CHECKSUM(NEWID())) % @numaccounts + 1;
  SET @i += 1;
END;
SET @p2 = SYSDATETIME();

-- Run loop with proc execution
SET @i = 1;
WHILE @i <= @numiterations
BEGIN
  SET @curaccountid = ABS(CHECKSUM(NEWID())) % @numaccounts + 1;
  EXEC dbo.GetBalances @accountid = @curaccountid;
  SET @i += 1;
END;

SET @p3 = SYSDATETIME();
-- Compute average proc execution time, accounting for 
-- loop overhead
SET @duration = (DATEDIFF_BIG(microsecond, @p2, @p3) - 
               DATEDIFF_BIG(microsecond, @p1, @p2)) / @numiterations;

PRINT 
  'Average runtime across '
    + CAST(@numiterations AS VARCHAR(10)) + ' executions: '
    + CAST(@duration AS VARCHAR(10)) + ' microseconds.';

If you also want to measure the number of logical reads, you can run an extended events session with the sql_batch_completed event and a filter based on the target session ID. You can divide the total number of reads by the number of iterations in your test to get the average per proc execution.

You can use the following code to create such an extended event session, after replacing the session ID 56 in this example with the session ID of your session:

CREATE EVENT SESSION [Batch Completed for Session] ON SERVER 
ADD EVENT sqlserver.sql_batch_completed(
    WHERE ([sqlserver].[session_id]=(56)));

One thing that a test from SSMS won’t do is emulate a concurrent workload. To achieve this you can use the ostress tool, which allows you to run a test where you indicate the number of concurrent threads and the number of iterations per thread. As an example, the following code tests the solution proc with 100 threads, each iterating 1,000 times, in quiet mode (suppressing the output):

ostress.exe -SYourServerName -E -dtempdb -Q"DECLARE @numaccounts AS INT = 100000; DECLARE @curaccountid AS INT = ABS(CHECKSUM(NEWID())) % @numaccounts + 1; EXEC dbo.GetBalances @accountid = @curaccountid;" -n100 -r1000 -q

Of course, you’ll need to change “YourServerName” with your server’s name. The ostress tool reports the total execution time of the test. You can divide it by (numthreads x numiterations) to get the average proc execution time.

Next, I’ll present three solutions that I came up with, and report their average runtimes based on both the SSMS and the ostress testing techniques, as well their average number of logical reads.

Solution 1, using TOP

Following is my first solution, which relies primarily on the TOP filter:

CREATE OR ALTER PROC dbo.GetBalances
  @accountid AS INT
AS

SET NOCOUNT ON;

SELECT W.dt,
   (SELECT TOP (1) B.balance
    FROM dbo.Balances AS B
    WHERE B.accountid = @accountid
      AND B.dt <= W.dt
    ORDER BY B.dt DESC) AS balance
FROM dbo.Workdays AS W
WHERE W.dt BETWEEN (SELECT MIN(dt) 
                    FROM dbo.Balances 
                    WHERE accountid = @accountid)
               AND (SELECT MAX(dt) 
                    FROM dbo.Balances 
                    WHERE accountid = @accountid)
ORDER BY W.dt;

This is probably the most obvious solution that most people will come up with intuitively.

The code queries the Workdays table (aliased as W), filtering the dates that exist between the minimum and maximum balance dates for the account. In the SELECT list the code returns the current workday date (W.dt), as well as the result of a TOP (1) subquery against Balances (aliased as B) to obtain the last known balance. That’s the most recent balance associated with a balance date (B.dt) that is less than or equal to the current workday date (W.dt). The code finally orders the result by W.dt.

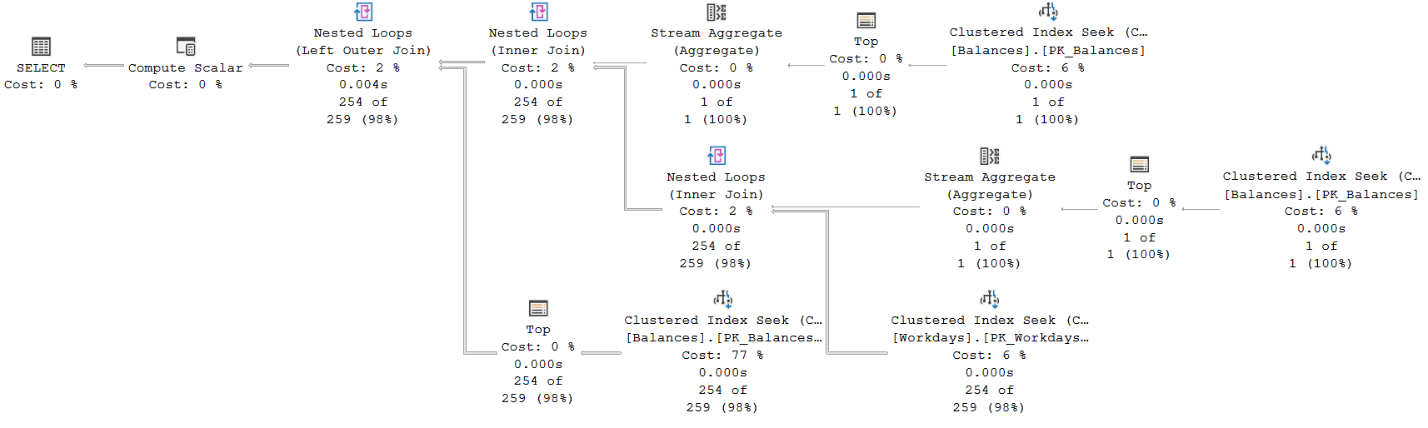
The plan for Solution 1 is shown in Figure 1.

Figure 1: Plan for Solution 1

The top two seeks against the Balances clustered index obtain the minimum and maximum balance dates for the account. Each involves as many logical reads as the depth of the index (3 levels in our case). These two seeks represents a small portion of the cost of the plan (12%).

The bottom right seek against the Workdays clustered index obtains the dates of the workdays between those minimum and maximum. This seek involves just a couple of logical reads since each leaf page holds hundreds of dates, and recall that in our scenario, each account has an average of about 200 qualifying workdays. This seek also represents a small portion of the cost of the plan (6%).

The bulk of the cost of this plan is associated with the bottom left seek against the Balances clustered index (77%). This seek represents the TOP subquery obtaining the last known balance, and is executed per qualifying workday. With an average of 200 qualifying workdays and 3 levels in the index, this seek performs about 600 logical reads across all executions.

Notice that there’s no explicit sorting in the plan since the query ordering request is satisfied by retrieving the data based on index order.

Here are the performance numbers that I got for this solution in average per proc execution:

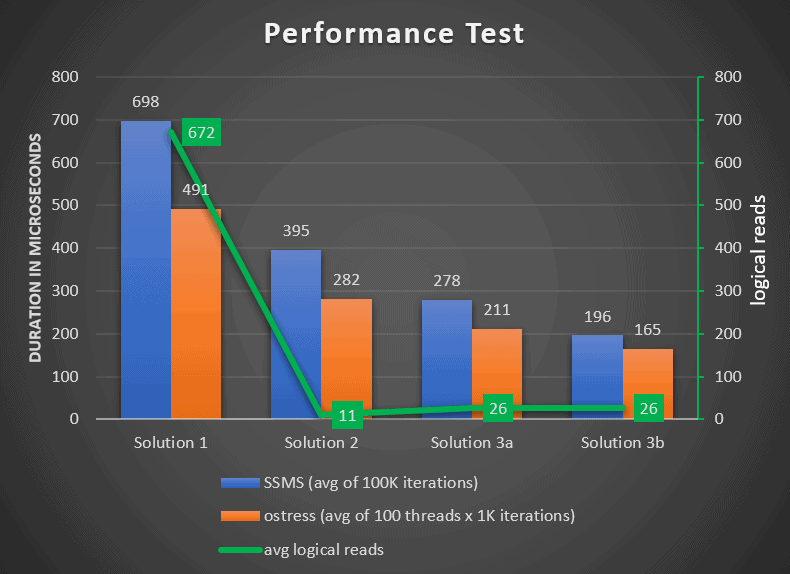
Duration with SSMS test: 698 microseconds

Duration with ostress test: 491 microseconds

Logical reads: 672

Solution 2, using IGNORE NULLS

SQL Server 2022 introduces a number of T-SQL features to support queries involving time-series data. Once specific feature that is relevant to our challenge is the standard NULL treatment clause for offset-window functions (FIRST_VALUE, LAST_VALUE, LAG and LEAD). This feature allows you to specify the IGNORE NULLS clause if you want the function to continue looking for a non-NULL value when the value in the requested position is missing (is NULL). You can find more details about the NULL treatment clause here.

Following is my second solution, which uses the NULL treatment clause:

CREATE OR ALTER PROC dbo.GetBalances
  @accountid AS INT
AS
SET NOCOUNT ON;
SELECT W.dt, 
       LAST_VALUE(B.balance) IGNORE NULLS 
           OVER(ORDER BY W.dt ROWS UNBOUNDED PRECEDING) AS balance
FROM dbo.Workdays AS W
  LEFT OUTER JOIN dbo.Balances AS B
    ON B.accountid = @accountid
    AND W.dt = B.dt
WHERE W.dt BETWEEN (SELECT MIN(dt) 
                    FROM dbo.Balances 
                    WHERE accountid = @accountid)
               AND (SELECT MAX(dt) 
                    FROM dbo.Balances 
                    WHERE accountid = @accountid)
ORDER BY W.dt;
GO

The code performs a left outer join between Workdays and Balances. It matches workday dates that appear between the minimum and maximum balance dates for the account (obtained with subqueries like in Solution 1) with the balance dates for the account. When a match is found, the outer join returns the respective balance on that workday date. When a match isn’t found, the outer join produces a NULL value as the balance.

The SELECT list then computes the last known balance using the LAST_VALUE function with the IGNORE NULLS clause.

Like in Solution 1, this solution’s code returns the data ordered by W.dt.

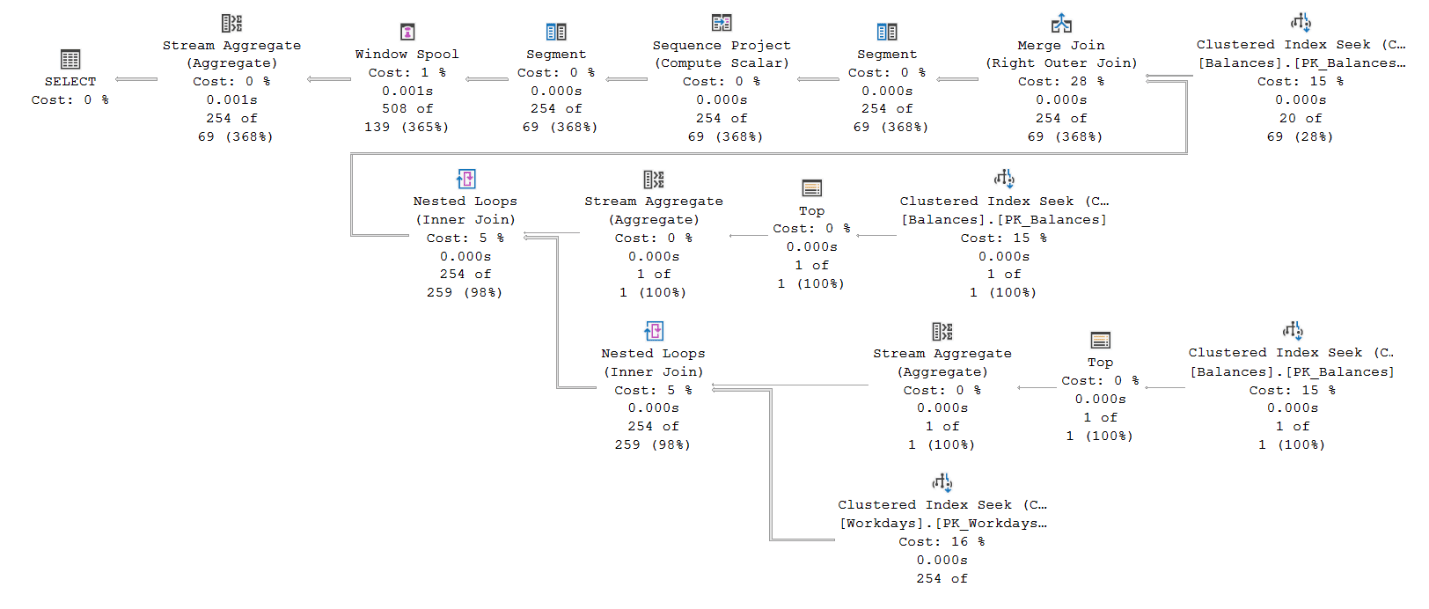
The plan for Solution 2 is shown in Figure 2.

Figure 2: Plan for Solution 2

The topmost seek in the plan against the Balances clustered index retrieves the balances for the account. The cost here is 3 logical reads.

The two seeks in the middle of the plan against the Balances clustered index retrieve the minimum and maximum balance dates for the account. Each costs 3 logical reads.

The bottom seek against the Workdays clustered index retrieves the workday dates in the desired range. It costs a couple of logical reads.

The Merge Join (Right Outer Join) operator merges the workday dates with the respective balance dates based on index order, preserving the workday dates.

Finally, the operators to the left of the Merge Join operator compute the LAST_VALUE function’s result, applying the logic relevant to the IGNORE NULLS option.

Like with Solution 1’s plan, this solution’s plan has no explicit sorting since the query ordering request is satisfied by retrieving the data based on index order.

Here are the performance numbers that I got for this solution in average per proc execution:

Duration with SSMS test: 395 microseconds

Duration with ostress test: 282 microseconds

Logical reads: 11

As you can see, that’s a significant improvement in runtime and a dramatic improvement in I/O footprint compared to Solution 1.

Solutions 3a and 3b, Matching Balance Date Ranges with Workdays

The characteristics of our data are that there are very few balances per account (an average of 12.5), and many more applicable workdays (an average of about 200). With this in mind, a solution that starts with Balances and then looks for matches in Workdays could potentially be quite optimal, as long as it also gets optimized this way. Here’s solution 3a implements this approach:

CREATE OR ALTER PROC dbo.GetBalances
  @accountid AS INT
AS
SET NOCOUNT ON;
WITH C AS
(
  SELECT B.dt, B.balance,
         LEAD(B.dt) OVER(ORDER BY B.dt) AS nextdt
  FROM dbo.Balances AS B
  WHERE accountid = @accountid
)
SELECT ISNULL(W.dt, C.dt) AS dt, C.balance
FROM C
  LEFT OUTER JOIN dbo.Workdays AS W
    ON W.dt >= C.dt AND W.dt < C.nextdt
ORDER BY dt;
GO

The query in the CTE called C uses the LEAD function to create current-next balance date ranges.

The outer query then uses a left outer join between C and Workdays (aliased as W), matching each balance date range with all workday dates that fall into that date range (W.dt >= C.dt AND W.dt < C.nextdt).

The SELECT list returns the first non-NULL value among W.dt and C.dt as the result dt column, and C.balance as the effective balance on that date.

The outer query returns the result ordered by the result column dt.

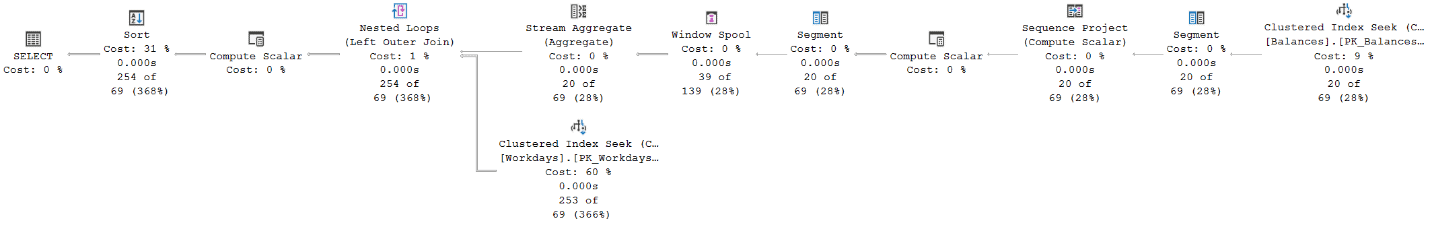
The plan for Solution 3a in Figure 3.

Figure 3: Plan for Solution 3a

The top seek against the clustered index on balances retrieves the balances for the account. This seek costs 3 logical reads. The remaining operators to the left of the seek and before the Nested Loops operator compute the LEAD function’s result, relying on index order. Then, a seek is applied against the clustered index on Workdays per balance date range. In average, you get 12.5 seeks, each costing a couple of reads.

The one tricky thing in this plan is that there’s a Sort operator used to handles the query’s presentation ordering request. The explicit sorting is needed since the ordering expression is a result of a computation with the ISNULL function. That’s similar to breaking SARGability when applying manipulation on the filtered column. Since we’re talking about a couple hundred rows that need to be sorted in average, the sort is not a disaster, but it does require a memory grant request, and it does cost a bit.

Here are the performance numbers that I got for this solution in average per proc execution:

Duration with SSMS test: 278 microseconds

Duration with ostress test: 211 microseconds

Logical reads: 26

Even though the number of logical reads is a bit higher than for Solution 2, the runtime is an improvement.

If we could just get rid of the explicit sorting though! There is a neat trick to achieve this. Remember, the sorting is required due to the fact that the ordering expression is the result of a computation with the ISNULL function. You can still get the correct ordering without manipulation by ordering by the composite column list C.dt, W.dt.

Here’s solution 3b implements this approach:

CREATE OR ALTER PROC dbo.GetBalances
  @accountid AS INT
AS
SET NOCOUNT ON;
WITH C AS
(
  SELECT B.dt, B.balance,
         LEAD(B.dt) OVER(ORDER BY B.dt) AS nextdt
  FROM dbo.Balances AS B
  WHERE accountid = @accountid
)
SELECT ISNULL(W.dt, C.dt) AS dt, C.balance
FROM C
  LEFT OUTER JOIN dbo.Workdays AS W
    ON W.dt >= C.dt AND W.dt < C.nextdt
ORDER BY C.dt, W.dt;
GO

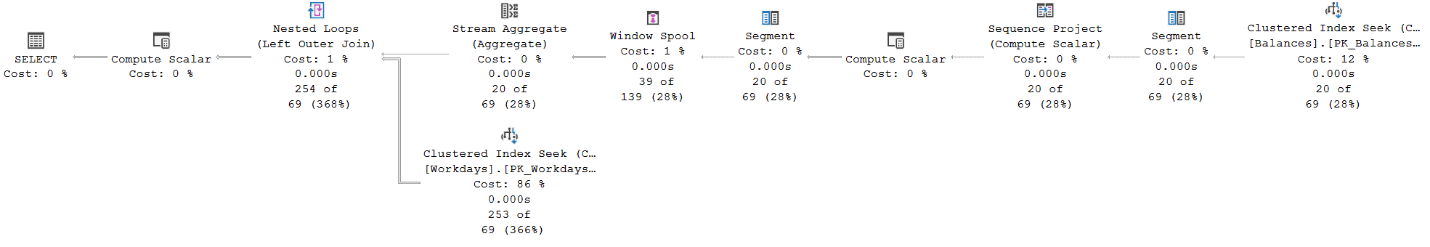
The plan for Solution 3b in Figure 4.

Figure 4: Plan for Solution 3b

Voila! The plan is similar to that of Solution 3a, but the sort is gone.

Here are the performance numbers I got for this solution:

Duration with SSMS test: 196 microseconds

Duration with ostress test: 165 microseconds

Logical reads: 26

That’s a pretty nice improvement compared to the performance numbers that we started with for Solution 1.

Performance Summary

Figure 5 shows the performance test results. It has the average runtimes using both the SSMS test and the ostress test summarized as bar charts corresponding to the left Y axis, and the line chart representing the average logical reads corresponding to the right Y axis.

Figure 5: Performance Test Summary

Conclusion

In this article I covered a gap-filling challenge that involved gap-filling balances with missing workday dates, and for each reporting the last known balance. I showed three different solutions including one that uses a new time-series related feature called the NULL treatment clause.

As you can imagine, indexing and reuse of cached query plans were paramount here, and both were handled optimally. Using a good representative sample data that adequately represents the production environment, and an adequate testing technique are also important.

The performance expectations were for a sub-millisecond runtime in a concurrent workload, and this requirement was achieved. In fact, all solutions satisfied this requirement, with the last taking less than 200 microseconds to run.


The post T-SQL Gap-Filling Challenge appeared first on Simple Talk.


from Simple Talk https://ift.tt/1aNvUI4
via

Saturday, May 27, 2023

Unmasking SQL Server Dynamic Data Masking, Part 1, Intro

This is the beginning of a series on SQL Server Dynamic Data Masking. Dynamic Data Masking is a concept familiar with all developers and users of sensitive data. It is implemented in SQL Server with simplicity and elegance, requiring minimal changes to front end applications, including reporting, and almost no changes to queries. The series includes:

  1. An in-depth introduction and use cases
  2. Setup, examples, testing recommendations, coding alternatives to Dynamic Data Masking
  3. Side-channel attacks
  4. Attack mitigations and general architectural-considerations

The dynamic data masking feature was introduced in SQL Server 2016. Data masking addresses gaps in exposing data to end users when direct access is allowed via reporting tools, data analysis, machine learning, or any query tool. Masking is used to protect sensitive or proprietary data from users not authorized to view that data by obfuscating the actual data with a mask as it is returned to the user. Stated simply, actual data is not returned to the user but rather replaced with a traditional style mask hiding all or part of the configured column.

For instance, instead of seeing your coworker’s actual salary, something like 000.00 would be returned. Instead of seeing the proprietary name for a product, the mask of xxx would be returned. The mask can be all zeroes, in the case of a number, all x’s for characters, a pre-designated mask, or a completely custom mask.

When using front end applications with built in masking capabilities or custom code, this need has long been addressed. SQL Server dynamic masking instead addresses the masking need directly in the data engine. Implementing masking in the engine ensures data is protected regardless of the access method, reducing the work necessary to mask data in multiple user interfaces and reducing the chance of exposing unmasked data. The engine only presents data based on the security model, including masked or unmasked data.

In this introduction blog, I want to do two things. First, introduce masking as a general topic. Then as an appendix to this post, include the code to setup the rest of the series.

Competing Solutions

Other products exist that actually modify the data in the database, typically referred to as static data masking. This can be useful for moving production data to non-production environments. Since the data is actually modified, even users with escalated privileges in these environments can’t override security and view the proprietary data. Data masked dynamically makes no actual changes to your data

The prime use case for physically masking the data is providing a cleansed copy of production data to non-production environments. This contrasts with dynamic data masking, with a use case of hiding sensitive data in production environments. They address very different use cases and some architectures may require both types of products.

Developers and other users with elevated privileges can easily bypass dynamic data masking in non-production environments. Since non-production environments aren’t typically monitored as closely as production environments, physically masking the data in these environments is a good option.

Static masking can be especially important if government regulations are involved or any other situation where the chance of a data breach has to be reduced to the absolute minimum, which as a data professional, should be practically always. With static data masking, the original data is secure since it has been modified. But because the data is modified, some functionality is lost. Connections to external systems, some front-end application functionality, and some testing scenarios are difficult if not impossible.

Considering that the primary function of a database engine is maintaining data and ensuring the integrity of that data, there aren’t many scenarios when static data masking is appropriate for production. Dynamic data masking requires careful planning and a dedicated plan to be sure it works. Modifying the data requires more planning and time.

Alternate Solutions

Dynamic masking is presented as a possible solution when users are allowed to directly query data. There are caveats to this recommendation, including security concerns presented in later sections. Direct ad-hoc access to data isn’t typically something you should allow your users to do against production transactional systems, so that wouldn’t be a recommended use case. That leaves us with warehouses and reporting systems as the obvious candidates.

Using production data is often necessary to thoroughly test systems, especially system integrations. It can take an unfeasible amount of effort to setup data in all necessary interconnected systems and it is likely to still leave gaps in testing scenarios. It is possible to lock down the target data by means other than data masking. Separate schemas, alternate column names, encrypted columns, lookup tables with alternate keys, or simply excluding the target data are all possibilities depending on the business requirements. The primary strength of dynamic data masking is the low effort to implement. Testing and automatic upgrades done by Microsoft is another big strength. It is much harder to justify a custom solution when something is built into the product, patched, and enhanced by the vendor. Dynamic data masking can also be combined with restricting access via views and stored procedures to make it a more secure solution.

SQL Server’s Always Encrypted is another useful solution that meets a different need. The data is encrypted before it reaches the database engine. Client applications have the encryption key, usually in a key store, and send and receive encrypted data to the engine. It is up to the client application to mask data if that functionality is needed. One benefit of Always Encrypted is that data is encrypted before it hits the data engine. This means that even privileged users, such as administrators, can’t see an unencrypted version of the data. Only authorized application users see the data.

Dynamic Data Masking Security

When configured for a column, dynamic data masking is applied for all users unless they have specific authorization to view the unmasked data. Users need to be granted the UNMASK, ALTER ANY MASK, or CONTROL permission on the database to view unmasked data. Starting with SQL Server 2022, the UNMASK permission is more granular and allows unmasking down to a column level.

Supersets of these permission sets are included in the dbo database role and the sysadmin server role. If users only have SELECT permissions and they don’t have super user permissions, the data will be masked. When implementing a new security layer it is always important to verify that security is working as expected. In general, SQL Server security is additive, so if a user is accidentally put into a group or role with permission to unmask data, they will have those permissions.

Dynamic Data Masking Use Cases

In this section I want to cover some of the primary use cases for the Dynamic Data Masking feature. While it isn’t perfect (as I will cover in a later blog about how it can be defeated if you aren’t careful), it has some very exciting uses.

Simply Hiding Sensitive Data from Users

The primary purpose of dynamic data masking is to obfuscate proprietary data from unauthorized users. The data isn’t changed, rather it is simply presented to users in a modified format or as a static value, such as 0 for integers. You can choose your own format if desired, so you might choose to include the first characters of a name or number, part of an email address including the @ sign so the data in the column is clear, or almost any user defined format.

It can also be used to hide data for authorized users in non-secure or public environments. Dynamic masking does this at the database engine level, thus making raw data access more secure. So, if data scientists, report users, testers, business analysts, product owners or other users are able to access data directly, it can still be protected. Dynamic queries, reports, data extracts are all protected. Users with unmasking privileges to the table or column see unmodified data.

Note that as noted, there are some security concerns with using Dynamic Data Masking in ad-hoc scenarios.


No Syntax Restrictions

The dynamic portion of dynamic data masking is what makes it powerful. Columns configured with dynamic masking functions exactly like other columns, with the exception that the output differs depending on who accesses the data.

The masked columns can be used to JOIN and for GROUP clauses (the actual value is used, not the masked value you see). It can also be used for WHERE clauses without using the masked values. It can be used in aggregations, functions like substring, in comparison operators, and in joins.

If a column with sensitive data is used as the primary key for a table, and that column is masked, it can still be used as the lookup column in your INNER JOIN while keeping it secure. Histograms based on the salaries of employees while keeping the salaries confidential are possible. Data can be limited to a geographic region without allowing users to see the specific geographic data. All the data can be used for comparison operations, aggregations, joins, any operation normally used by data, while still keeping it reasonably confidential (Later in this series I will show examples of what I mean by “reasonably”.)

This is generally why the feature is mostly for building user interfaces, and not to secure data from nosy ad-hoc users,

Summary

SQL Server Dynamic Data Masking was created to make it easier to obfuscate sensitive data. The relative ease of implementation makes it a nice additional layer when presenting SQL Server data. Future sections include detailed setup examples, caveats for use and security considerations.


——————

Appendix, Preparing the test database:

The database I will be using in subsequent blogs is the sample database WideWorldImporters, available in github, using the latest version available. In this section I will provide instructions for setting up and initializing the database for the following blog entries.

Dynamic data masking was added to multiple tables and columns. The columns chosen were determined purely for demonstration purposes and were not evaluated for business utility.

  1. Restore a copy of WideWorldImporters
    1. For an on-Prem installation, use WideWorldImporters-STANDARD.bak
    2. For an Azure database installation, use WideWorldImporters-STANDARD.bacpac
      1. For verification in Azure, the lowest standard tier was used
      2. The FULL version can be used but requires a higher service tier due to the inclusion of memory optimized tables. If you try to import the FULL version to a low tier model in Azure, you will get the following error:

Warning SQL0: A project which specifies SQL Server 2016 as the target platform may experience compatibility issues with Microsoft Azure SQL Database v12.

Error SQL72014: Framework Microsoft SqlClient Data Provider: Msg 40536, Level 16, State 2, Line 1 ‘MEMORY_OPTIMIZED tables’ is not supported in this service tier of the database.

  1. Add users for testing scripts.
    1. MaskedReader for viewing data in a masked state
    2. UnmaskedReader for viewing data in an unmasked state
USE WideWorldImporters;
GO
 
/*
* Create datbase user without a login
* Add to db_datareader for basic access
* Add to [External Sales] for additional access via RLS
*/
CREATE USER MaskedReader WITHOUT LOGIN;
GO
 
ALTER ROLE db_datareader
ADD MEMBER MaskedReader;
GO
 
ALTER ROLE [External Sales]
ADD MEMBER MaskedReader;
GO
 
 
/*
* Create datAbase user without a login
* Add to db_owner for basic access
* Add to [External Sales] for additional access via RLS
*/
CREATE USER UnmaskedReader WITHOUT LOGIN;
GO
 
ALTER ROLE db_owner
ADD MEMBER UnmaskedReader;
GO
 
ALTER ROLE [External Sales]
ADD MEMBER UnmaskedReader;
  1. Mask columns
    1. As installed, WideWorldImporters has 5 masked columns in the Purchasing.Suppliers table and 5 in the corresponding temporal table, Purchasing.Suppliers_Archive.
    2. The following script adds masking to
      1. Application.Countries
      2. Additional columns to Purchasing.Suppliers
      3. Purchasing.SupplierTransactions
      4. Sales.Customers
      5. Sales.Orders
    3. Note that corresponding columns in temporal tables are automatically masked when the parent table is masked.


USE WideWorldImporters;
GO
 
ALTER TABLE Application.Countries
ALTER COLUMN IsoAlpha3Code
ADD MASKED WITH (FUNCTION = 'default()');
GO
 
ALTER TABLE Purchasing.Suppliers
ALTER COLUMN DeliveryLocation
ADD MASKED WITH (FUNCTION = 'default()');
GO
 
ALTER TABLE Purchasing.Suppliers
ALTER COLUMN InternalComments
ADD MASKED WITH (FUNCTION = 'default()');
GO
 
ALTER TABLE Purchasing.Suppliers
ALTER COLUMN PhoneNumber
ADD MASKED WITH (FUNCTION = 'default()');
GO
 
ALTER TABLE Purchasing.Suppliers
ALTER COLUMN SupplierName
ADD MASKED WITH (FUNCTION = 'default()');
GO
 
ALTER TABLE Purchasing.SupplierTransactions
ALTER COLUMN AmountExcludingTax
ADD MASKED WITH (FUNCTION = 'default()');
GO
 
ALTER TABLE Purchasing.SupplierTransactions
ALTER COLUMN LastEditedWhen
ADD MASKED WITH (FUNCTION = 'default()');
GO
 
ALTER TABLE Purchasing.SupplierTransactions
ALTER COLUMN OutstandingBalance
ADD MASKED WITH (FUNCTION = 'default()');
GO
 
ALTER TABLE Purchasing.SupplierTransactions
ALTER COLUMN SupplierInvoiceNumber
ADD MASKED WITH (FUNCTION = 'default()');
GO
 
ALTER TABLE Purchasing.SupplierTransactions
ALTER COLUMN TaxAmount
ADD MASKED WITH (FUNCTION = 'default()');
GO
 
ALTER TABLE Purchasing.SupplierTransactions
ALTER COLUMN TransactionAmount
ADD MASKED WITH (FUNCTION = 'default()');
GO
 
ALTER TABLE Purchasing.SupplierTransactions
ALTER COLUMN TransactionDate
ADD MASKED WITH (FUNCTION = 'default()');
GO
 
ALTER TABLE Sales.Customers
ALTER COLUMN CreditLimit
ADD MASKED WITH (FUNCTION = 'default()');
GO
 
ALTER TABLE Sales.Customers
ALTER COLUMN CustomerName
ADD MASKED WITH (FUNCTION = 'default()');
GO
 
ALTER TABLE Sales.Customers
ALTER COLUMN DeliveryAddressLine1
ADD MASKED WITH (FUNCTION = 'default()');
GO
 
ALTER TABLE Sales.Customers
ALTER COLUMN DeliveryAddressLine2
ADD MASKED WITH (FUNCTION = 'default()');
GO
 
ALTER TABLE Sales.Customers
ALTER COLUMN DeliveryPostalCode
ADD MASKED WITH (FUNCTION = 'default()');
GO
 
ALTER TABLE Sales.Orders
ALTER COLUMN OrderDate
ADD MASKED WITH (FUNCTION = 'default()');

Setup Notes

https://github.com/Microsoft/sql-server-samples/releases/tag/wide-world-importers-v1.0

WideWorldImporters-STANDARD.bacpac

WideWorldImporters-STANDARD.bak


References

https://learn.microsoft.com/en-us/sql/relational-databases/security/dynamic-data-masking?view=sql-server-ver16

http://wiki.gis.com/wiki/index.php/Decimal_degrees

https://learn.microsoft.com/en-us/sql/t-sql/statements/execute-as-transact-sql?view=sql-server-ver16

https://learn.microsoft.com/en-us/sql/t-sql/queries/with-common-table-expression-transact-sql?view=sql-server-ver16

https://learn.microsoft.com/en-us/sql/relational-databases/security/row-level-security?view=sql-server-ver16

https://learn.microsoft.com/en-us/sql/relational-databases/security/encryption/always-encrypted-tutorial-getting-started?view=sql-server-ver16&tabs=ssms

https://learn.microsoft.com/en-us/sql/relational-databases/security/encryption/always-encrypted-database-engine?view=sql-server-ver16

The post Unmasking SQL Server Dynamic Data Masking, Part 1, Intro appeared first on Simple Talk.


from Simple Talk https://ift.tt/3SwpDvI
via

Friday, May 26, 2023

From Tech Worker to IT Management: Ten Steps to Success

Congratulations! You got the promotion!!

Once the excitement and adrenaline rush of a promotion passes, it is common to find yourself staring at the yawning abyss of the unknown. Then you ask yourself the question that we all ask:

Now what?“

Do you know what upper management expects? Do you know where to start? Do you know what a manager does or how to accomplish what is required?

If the answer to any of these questions is no for you, it doesn’t mean they picked the wrong person. It just means that you, like most people, need some definition and a path forward. Once you have a definition of your role and a way to move forward to achievement, the rest of the solutions will begin to write themselves. I want to give you those details and some resources to help guide you as we walk this path together – particularly in the first year. Managing people is a different skill set than being an individual technical contributor, but there is the same degree of challenge and fulfillment to be found in it. People just aren’t as straightforward as technology.

Let’s start now.

(Of course, let’s be honest. It’s not just brand-new managers that feel a bit lost. These steps may pertain to you as well if you’re considering a change to management or even if you’ve been a manager for 20 years.)

In this article I will lay out my ten steps that I developed as I figured out how to be a manager after years as a DBA.

  • Managing expectations – Defining the standard of success. If you don’t know what success is, you are very unlikely to achieve it.
  • Getting organized – Organization skills are vital to being a good manager. Your day is likely going to be filled with paperwork, emails, phone calls, and meetings. You need to be able to find and do all of it.
  • Meeting the team (if you haven’t already) – Every team is different. Every team. Once you have your start on getting organized and understanding your expectations, meet all your team members and see how they work and what they think their roles are. This’ll be a good start in playing on how you need them to work.
  • Defining your strategic vision – You and your team need to know the desired vision of the future both for and from the team. Now that you’ve met the team, this should be easier to do, though certainly not easy.
  • Developing (or revising) long term plans – The team will work best if they have knowledge of what the long-term plans are for the team and the company alike.
  • Counting the loose change – Beyond the central tasks that your team Is responsible, there are probably a lot of other Incidental tasks that the team has acquired along the way. In this section, we’ll discuss what to do with these tasks.
  • Crunching the numbers – Money is the scariest part of management to most people. Don’t worry, while it isn’t impossible, it is a very important task that merits a wee bit o fear.
  • Assessing the day by day – As time passes you need to do many of the previous items… continually. Not only on your own team, but keep your ears open for everything,
  • Team building (Internal) – Getting to know your team and getting you and your team to know the other teams in your department is beneficial when you need to work with them, especially in an emergency.
  • Team building (External) – Same as internal team building, but expanding to your entire organization helps you to know what your customers face daily,

Of course, your mileage may vary, but hopefully this will be as useful in you management journey as it has been to me!

Step One – Managing Expectations

You can’t be successful if you don’t know what the standard of success is. The first question you should ask your new boss is how they will define success for you in the next year. Whatever that answer is, write it down. The answer will become the primary paradigm behind the rest of your decisions. Should the answer be to maintain what you have been given, that might be a real break for your first year, but as you settle into the role, do so with the mindset of looking for ways to raise the standard.

If there is an awkward silence or a nondescript answer to this question, then congratulations! You have an opportunity to step up and define it. This will be the first step of your plan over the next year as you work to learn your new role and determine how you can best drive value to the company in this new place. Take your time with this plan if at all possible; you want it to be in tune with the department and the business in general. It will be revised and polished on an ongoing basis as you learn more or as new needs arise. When you have your finished plan, share it with your boss for their input. Work together on this until you have a common understanding of what success in this new role is going to look like.

Take the time you need to consider the company in general. Where are they in their journey as a corporation? Are they just getting started? Are they going through growing pains? Are there real areas of struggle that will affect you and your team? Or, are they in a happy place of success? The answers to these questions have real implications for you and your approach.

If a company is just getting started, for example, they are more likely to need someone who is ready and able to make a quick assessment of the landscape and have the vision to foresee solutions that will drive value. They will also need someone who possesses the flexibility to change direction at need, and the strategy skills to keep their team from some of the pitfalls that startups typically have, such as lack of cohesion or overestimating the business’ need for budgeted technologies.

On the other hand, if you find yourself part of a successful business, you have time to learn what has constituted that success and how you might contribute to it. However, if the business is in the middle of a crisis, being able to discern the real issues and triage your team’s response effectively will be crucial.

Consider your own skills, strengths and weaknesses, and why you might have been chosen for this role. There is a wonderful book called The First 90 Days which points out that some managers fail during a promotion period because they presume that they simply have to continue doing what they were doing at a previous employer (only more so) and that will satisfy the company’s expectations of them in their new role. This is a whole new role; not necessarily a continuation of your old one (although you might possibly bring some parts of it with you). As you are new to this role, it’s a good idea to identify someone in your tier of leadership or above who is successful and willing to form a mentor/mentee relationship to help you to navigate the waters now that you are swimming in a different ocean.

Step Two – Getting Organized

You’re new to the role, and you are likely to have your hands full sifting through projects and other work that you have inherited. Your meeting schedule could escalate rapidly, and your team will need you frequently as well. There can (and probably will) be a good deal of context switching. If you are new to the company, you may not even know what it is all about yet.

How to cope? The way that many executives of huge corporations do. You get organized. There is a wonderful book called Getting Things Done: The Art of Stress-Free Productivity by David Allen, which is included in the Resource section. It has been the primary approach I use to personal organization, and which I want to share with you now.

Get a planner. It can be OneNote, a TUL planner, a productivity app – whatever works for you. Start by making a list of all the things on your plate.

ALL the things.

You don’t want to keep this stuff in your head. Trying to retain excessive amounts of info in your short-term memory is risky and stressful. You’ll probably be amazed when you make a list how many things there are – and how much better you feel purging it out of cache!  This is your starting point.

Now, start organizing all of this stuff in a way that is meaningful to you. I have found that OneNote works well for me. In my OneNote planner, there is a section group for project work. Each project gets its own section. In that section is everything that needs to be accomplished to call the thing done. Get the information you need on the projects you have inherited and keep them as notes in your planner on the project page. Understanding the project helps to facilitate doing the project. In my planner, I can use my check boxes to keep track of what is done versus what is in process. There is another section group for recurring meetings and notes.

The first section in my planner that stares me in the face every day is called “To Do”, which is all the things I have in flux at a high level. Once a week, I look over everything. Once a day, I’ll look over the To Do list and cross things off as I work that list down (or add to it). The key is to keep up the system you adopt and to use it consistently, and you’ll find that you can handle more than you may have previously realized while dropping fewer plates in the process.

Step Three – Meeting the Team (If You Haven’t Already)

If you don’t know your team, now is the time to schedule an introductory meeting as well as setting aside regular times to meet each member for one-on-one sessions if you can.

An introductory meeting is just what it sounds like. You want to tell them a little bit about you and how you got from there to here, but primarily, you want to hear about them. This should begin to form the picture in your mind of who they are, which will be fleshed out in your one-on-ones with them – which should happen on a regular schedule if at all possible, even if that is monthly or quarterly.

One-on-one meetings are their time to discuss whatever they need to. As you have these conversations, begin assessing their strengths and how they can be used to the business’ benefit. A look at their growth areas. How can you help them develop those challenged skill sets? Would they benefit from mentoring, continuing education, lab environments with scheduled time to practice? Actively helping to shore up growth areas while encouraging and acknowledging areas of strength will show your team members that you are on their side and are invested in their success. If your team is small (say, you and one or two other people), schedule some time with them to go over challenge areas and either work with them to get them over that hump or show them where to look to help themselves.

Ask your team members about their real goals and their SMARTER goals (https://www.peoplegoal.com/blog/smarter-goals-setting). What are their aspirations? What about those dreams makes those goals attractive to them? Are they attainable? If so, how can you help them get to where they want to be? When your team is known as a good team to be a part of, it fosters a sense of achievement and cohesion in the team, trust and goodwill outside the team, and ultimately helps form the foundation for an environment that will drive the most value for the business, because it is the team everyone wants to work with, and the team members give their best effort.

While you form an assessment of your team members, don’t forget yourself. What are the strengths that you bring to the team? Where do you fit in, professionally and personally? Where might you need guidance? Be brutally honest about this. Ask your mentor for feedback as well. As a colleague of mine once said, no one begins a job having mastered it. That mastery will take time and effort, and there are always ways to improve. It’s worth noting that as the company goes through changes, it will require changes in your strategy and skill sets as well, so this will be a never-ending process that will challenge you and expand your capabilities. I’ve included a few resources at the end of this that should prove useful.

Remember that you are now also part of another team – the team of managers in your department. If you haven’t met them, now is the time to do it. Find out what they do, how they do it, and how it contributes (or does not contribute) to the department’s success. Also find out their pain points, and how you might help with those. As they see that you are there to work with them, and that you bring something helpful to the table, it should make for more productive relationships.

For instance, say you need to staff up. You interview a candidate, but find they are not a great fit for your team, but think they might be a good fit for another manager in your department who is hiring. Take the time to speak to that manager (or to Recruiting, whichever is more appropriate) and send that candidate their way. If you see a dev team struggling with a slow query and you know your team can refactor it to perform better, extend a friendly offer to help and (better yet!) to show them some basic coding pain points to avoid. This is (obviously) based on the opportunity to do so, or it can be a considered upfront investment of time and effort that you hope will help them, and give you returns in future time recouped, better overall query performance, and team outreach.

Servant leadership is one of the most important components of management. In other words, one of your biggest responsibilities is helping to facilitate the success of the people on your team. I’ll speak to this in more detail later, but working to help individuals as well as the team as a whole can be really important. Never forget that your team’s success is your success as well. However, keeping the balance of servant leadership and leadership when it is necessary is paramount. There are times when a team consensus is important, but other times, while you may want input from the team, the decision really needs to be made by you. It is important not to present something as a choice when it is not a choice. Know that some of these decisions won’t be popular. It will help if you are seen to be fair and genuinely invested in the people you lead. As you grow, gaining the understanding of when to facilitate and when to administrate will be a key factor in your success.

Step Four: Defining your Strategic Vision

Have you been given a vision by upper management for your team? If you have, great! Is that vision for your team realistic and achievable? If not, plan to have a discussion to clarify and address any points of concern you have as soon as possible. Once you have a common vision, consider how your strategies going forward will conform to that vision. If not, now is the time to think about what one looks like.

As mentioned earlier, set aside time to talk with your team on an ongoing basis. While sometimes it can just be unstructured time, regularly having a topic can be helpful, too.

For example, you might gather the team together (with no agenda; you want fresh, uninfluenced thoughts from each person) and ask the following questions:

  1. What did you think of IT before you started working in it? What led you to think that? Were you right?
  2. How does the rest of the company perceive your team? Are they correct? Why or why not?
  3. How would you like for our team to be perceived? What can we do to foster and evangelize that message?

Talk this through and out of this a common vision should begin to coalesce. It will be your job to bring this into alignment with the culture and philosophy of the business. You want buy-in to make this work. If the team is not in consensus, at best, you’ll get grudging acceptance. You want active cooperation.

Come to an agreement regarding a vision statement and steps that can be taken and write them down. This conversation will be quickly forgotten, so it will fall to you to track how your team conforms to that vision and to keep it fresh in their minds. As you make your one or two-year plans, ask yourself how you will lead each project in the way that will help reinforce and broadcast this message within and outside of the team.

Step Five: Developing (or Revising) Long-Term Plans

You may have inherited some form of a long-term plan with the job. You should become familiar with this as quickly as possible. Read it carefully. Do you understand it? Are the goals achievable? If you believe they are, can you visualize how they will be implemented? If you understand the goals and think they are achievable, write the steps in your planner when you get the opportunity. This will help later when you are in the thick of the trees and forget what forest you just entered.

If you read this plan and think it isn’t realistic, set a time to meet with your supervisor to discuss it. You may have lost staff, or it may have been a while since the plan was reviewed holistically. Perhaps you have found that it will conflict with the plans of other teams or other project work that your team has recently been given.

All of these scenarios call for adjustments. Being proactive and ready with solid reasons why there are problems with the current team plans (and hopefully, standing ready to provide alternative solutions to the issues) will tell your supervisor that you are on the ball and already delivering value in your new position. This brings up an important point that a colleague once voiced. He said that his father was an executive and had told him as a boy to try never to bring a problem to a supervisor’s attention without a possible solution. Take the time before you meet to analyze the issues and possible workarounds. If there are none, be prepared to discuss the avenues you pursued to come to that conclusion.

Review you team’s plan periodically as appropriate (once a quarter is usually a good goal) and update as needed. Make sure you touch base with your team and get their input. If they don’t see the goals set as achievable, find out why. You’ll need to come up with solutions here as well. Be prepared to discuss alternative approaches, such as optimizing time by working ahead on items where you can during lags where you are waiting on other teams, or prioritizing critical objectives, leaving the nice-to-haves as backlog items.

Discuss and explore ideas with your team to reach your goals, and be sure to not put too much on the board if at all possible. Especially if you are an implementer team, it is likely you will be pulled into other project work and you don’t want to drive your team into the ground trying to accommodate everyone. A plan that is balanced with flexibility will ultimately be a stronger one. So if, for example, you are planning a major upgrade of all your servers, be sure to give breathing space before the upgrade begins (and especially after if at all possible) to prepare and to recover so you can go into the next big project fresh and not too behind on your day-to-day or backlog items.

Step Six: Counting the Loose Change

At this point you are feeling great, you are organized (or getting there) you and your team have a strategic plan and are feeling great. You have also probably noticed that along with the duties you expected, you probably inherited a bunch of incidental projects and emails about a number of different things you are now responsible for. Just like everything else, these go into your planner. Each one gets their own page. Invest the time you need to go through these tasks.

My old software engineering professor once said that the first step to any coding project is to understand the work. Take the time to understand the work you’ve just inherited, to ask questions, to come up with a plan of attack, then start knocking out the most time-sensitive stuff first. Where you see items that can be done in ten minutes or less, just do them. This is the exception to the planner rule, since it takes more time to record tiny tasks than it does to accomplish them. As you work your way through the loose change tasks, you will see a snowball effect begin to happen as the more small stuff and the time-sensitive items roll away, leaving you more time to get to the other things. You should find that you can more quickly knock legacy items off this list, this leave room for the projects that were your ideas from start to finish!

Step Seven: Crunching the Numbers

Now it’s time to look over the budget. No one likes this part, but they like it even less if the numbers are not there when they are needed, so tackle it head-on. First of all, do the numbers look realistic to you? Not sure? Can you get last year’s budget and expenditures for comparison?

If the budget as it stands doesn’t look workable to you, try to = provide proof of why the numbers should change? Get this information together and go over it with your supervisor. Be sure any projected spending is included. If you have enough data to trend spending, try to take this into account when doing your next year’s budget – just be prepared to explain your reasoning with actual metrics and figures.

You may find you have to prioritize. If the economy is down, for instance, the budget for the new staff person you were hoping for may have evaporated before your eyes. That means you will have to be more creative and resourceful for a while. You can look for ways to automate, or try to bring in a consulting firm to do some of the work for you at a cheaper rate (as long as you trust the quality of their work). If this is your scenario, prioritize and be clever. You can probably do more than you think you can. In the meantime, collect metrics. If you didn’t get that new staff person and your team is keeping the ship afloat, but you can demonstrate that the workload increased over the last six months such that they are being crushed under the weight, you may have a better chance of getting that staff person sooner than you did before.

Use metrics to brag on your team when they do a great job. If, for instance, someone on your team comes up with an automation idea that takes a deployment from an hour to seconds, or someone else deploys an indexing strategy that brings the I/O on one your instances down by 70%, you want to broadcast that message. Most technical victories like this will also save money.

You may find that the best way to do this is to offer to submit a monthly or quarterly metrics report to upper management. Use graphs and tables to help tell your story, and show progress. This not only evangelizes the message of the good work your team is doing and showing that you are steering the ship effectively, but if you do wind up needing to ask for extra staff, you will have already built a factual supporting case to help your cause.

Step Eight: Assessing the Day-to-Day

In this section we’ll talk about getting to know all the players in your organization. And continually gathering metrics on your team, your processes, and any hardware that you might manage. You didn’t think you’d only have to do this stuff once, did you?

Get to Know all the Players

Time to make another list, and to check it twice.

What is your team responsible for? Are you an application owner? Do you manage a server farm? Are you a DBA? Do you know what happens to the company if something you oversee goes down, or who to contact when (not if!) that happens?

One important thing to do is to get to know the other managers – and not just those in your department, but in the business. You don’t want the first point of contact to be an emergency – you want to have the bond of familiarity in place long before then. When people know you, there is grace to cover a lot of potential misunderstandings that naturally occur in stressful situations. It also gives them the chance to see that you are genuinely there to help them before you need help yourself.

If people understand that the person in front of them is credible, competent and helpful, they generally want to help that person in return. Taking the time to talk to them in the lunch line, to have casual conversations in the break room, or perhaps to hang out a little at company events – all of these things help you to get to know each other and form a bond of good will. When an emergency happens (again, when, not if!), that level of comfort will help you both. At least you won’t be dealing with a total stranger and another level of unknown.

If you think that misunderstandings under stress can’t happen to you because you communicate clearly, take a look at the peanut butter sandwich video. This one was done with a dad and his son, but has also been used in management workshops to underscore how easily miscommunication happens. Remember to give the grace and understanding to them that you want for yourself. They are no more or less human than you are, and while they will sometimes make mistakes you don’t understand, rest assured the same thing will be true in reverse. Mistakes are usually just opportunities to strengthen processes – not to undermine cohesion by pointing fingers.

Try to spend some time with other teams outside of IT and see how they use the technology your company provides. Invite them to do a lunch and learn with your team, explaining that you would like to better understand what they do, how they use your technology, and what their pain points are. The better you understand this, the more effectively you can help them. Be willing to return the favor and let them see behind the curtain. This can be eye-opening and a great chance to come together with a new respect for what each other does. After all, the more they know about what you do, the less likely they are to think you are “just IT”.

Gathering Metrics

Metrics are everything in IT (okay, in all of business). You use metrics to tell the story of how things are going – to find out what is good, what is bad, and what is likely to become bad in the near future. When you go into a leadership position, you will continue to use these kinds of numbers and will add a few more.

If you have a good handle on your hardware/software and your processes, let’s begin to assess your team as a whole and your people. Is your team being overworked or underworked? Is the level of work consistently burdensome, or does it come in peaks and valleys? If it is sometimes frantically busy, but usually manageable, that’s one thing. If it is consistently a hair-on-fire environment, that is a problem you will need to address – either with staff, automation, tools – or all three.

Consider your team. Who is productive? Who is not? It’s going to be important to gain clarity into your team’s work dynamic if you are going to be an effective manager and advocate.

Once you have a clear picture of how your team is (or is not) working, it’s time to look at the why of it all. For example, perhaps your team is widely considered to be extremely productive, but you find that the pace is unsustainable. Alternatively, maybe you see one very productive member of your team consistently taking up the slack for someone else. What could you do to help strengthen the less productive team member and bring up their performance? One possible answer would be to schedule a one-on-one session with them to see their perspective on the issue. Are they new to the role? It may be that you need to allow for time to grow into their new position, just as you are growing into your own. It may be that extra training is necessary. Could the productive member of your team do a lunch and learn for everyone? Does the struggling person need resources on time management? In the worst-case scenario where you’ve explored alternatives and nothing seems to be working, is it a matter of them being a bad fit for your team, but perhaps they a successful addition to a different one? Answering these questions will help you to help to strengthen overall performance and will give you the best opportunity to help those team members who are not as strong.

Additionally, as you check your team assessment against your short and long-term goals, consider the strength and growth areas of each team member as you assign work. If you know someone has a strength that aligns well with a critical project, it’s a no-brainer! On the other hand, if a project is not time sensitive and would allow someone to strengthen their skills in an area where they need growth, it could be a good opportunity for them. Try to remember to not just think in terms of projects, but of people. As you offer opportunities to strengthen the skillsets of each team member, you optimize the opportunity to strengthen the team at large.

Stepping out a bit farther, take a final look at your day-to-day. How does it align with your long-term plans? If you are getting so consumed in your everyday work to even think about your long-term goals, then it is time to reprioritize with your supervisor or to consider what resources you may need to ensure the goals you have been assigned are met.

Step Nine: Team Building (Internal)

Simply put – your team is everything. Invest in it. Make it strong, by building relationships in your team and department.

How do you do this? First of all, your team needs to be able to trust your leadership. They need the confidence of knowing you are their advocate, that you are fair, that you are the line of defense – and that the buck ultimately stops with you.

Providing security by giving definition on job expectations at each point in the career pathways on your team is vitally important, as is partnering with them as they work toward success in their pathways. If you don’t have career pathways, now is the time to suggest them! These should be measurable and specific whenever possible, although some assessment points will always be judgment calls.

Part of your job will be providing feedback. Always keep feedback fact-based, constructive and provide examples. When your team members know exactly where they stand with you and what the end goal is, it helps to decrease stress and increase security and cohesion. Reviews should never be a surprise, but the logical conclusion of a year’s worth of ongoing conversation and work together.

When you are at a place where you can upstaff, look for the best combination of skillset and overall fit with the existing team that you can find. Having a team where each member contributes to the common vision will help to prevent premature turnover and will facilitate a more seamless onboarding experience. Try to ensure that their personal goals align well with the goals you have for your team. If, for instance, you know that you only have room for one person, but a lot of busy work, try to look for someone with an aptitude for automation while assisting with the day-to-day. Alternatively, if your business is considering a cloud migration, and you can only afford a new person, you might look for someone who has some basic necessary skills and a willingness to work over into the rest to assist with keeping the lights on while you train other(s) on your team for the initial ramp up.

Try to find opportunities to help your team come together and bond where appropriate, and to communicate with other teams. For instance, consider a team whiteboard with a Kudos Corner, an area to record progress in projects and initiatives, and a fun area (like a word of the day). Now, team members know they are seen – not just by you, but by other teams as they come by. The human eye can’t seem to pass a whiteboard without scanning the contents. You may even find that it starts conversations with other teams about how your plans might align with theirs, or how to reschedule to ensure that they do. If so, even better!

Consider fun team-building activities. Not all of these need to be budget-busters! Consider a scavenger hunt where the team will have to follow clues that will lead them to other teams to get the next clue they need to find their holiday gift – which doesn’t need to be expensive, only meaningful or fun. This is not only enjoyable, but will require them to have (and gain) a better understanding of what the other teams do in order to decipher the clue and have a great time doing it. Escape rooms are a great team-building exercise. Partner team dinners are another option. Maybe the DBAs go out to dinner with the Infrastructure or Networking teams. Next time, they go out with a business team. Keep ideas in your planner to pull out when a little team bonding seems beneficial.

Step Ten: Team Building (External)

No team exists in a vacuum. Outreach is important. IT has the reputation of being the people in the basement that no one ever sees. Let’s change that! Reach out to other managers outside of IT and maintain those relationships. The better you understand what they do, their pain points and what you can do to help (and vice versa!), the better chance you will have of building a better relationship, fostering trust and cooperation. You may find that you inherit a team where relationships with some parts of the organization has been rocky. The rockier the historical relationship was before you, the more important this will be. Turning that ship around will benefit you both.

One of the most important things you can do to foster a good relationship with other teams is ensuring that you and your team stay out of the blame game as much as possible. That is easier said than done in some places, I know, but that’s where you are, consider it your own personal challenge and your opportunity to be the change you want to see. Keep thinking process oriented as far as possible, instead of engaging in finger pointing. Focus on these three questions:

  • Where did the process break down?
  • How can it be fixed?
  • How can it be improved?

In the case of a well-designed process, a person should not be easily able to break it! Broken processes are not generally occasions for blame, but for improvement. If, however, you notice things breaking repeatedly, or because process was ignored, it is time to have conversations to address the whys of that and course-correct – hopefully sooner rather than later, if possible.

Conclusion

Stepping into management is one of the biggest, most fundamental jumps you are likely to make in your career. I know that in my own situation, I was following a rock star. When I was offered the role, my first thought was, how do I fill his shoes? Immediately following was the answering thought: You don’t. You make your own shoes.

That instinct has proven to be a true one. I didn’t have all his strength areas. I had my own and needed to hone those to my own best advantage and to serve the team I was called to lead. I initially wrote this guide for myself in attempt to collect my thoughts about making my own shoes. It has worked for me, and I hope it will work for you as well. Know that it will take time for you to find your sea legs and feel comfortable with all of this.

Maybe more importantly, know that you will make mistakes in the process, or just be flat-out wrong on some things. That’s okay. Remember it is about process, not individual fault, no matter what anyone tells you. Apologize sincerely, go back, do the work to analyze where things went off the tracks, and come up with a plan to ensure it doesn’t happen again. Don’t let it stop you from contributing or using the gifts that got you here in the first place. Instead, allow it to make you better. And finally, remember to pay it forward by helping someone else rise and improve if and when you can.

I hope that you will find this guide to be helpful, and I wish you every success as you make your own shoes and walk this road. Be excited for where it will take you!

Resources

Some suggested reading to help you on your way!

  1. The First 90 Days by Michael Watkins. This book covers (you guessed it!) the first 90 days of your new job. He goes through the most common challenges you’ll face and how to keep from making mistakes that might be difficult to rectify. Each chapter has tools, checklists and self-assessments to help keep you on track. If you prefer Audible, it’s a 7-hour listen.
  2. Getting Things Done: The Art of Stress-Free Productivity by David Allen. I cannot recommend this enough to help with organization and time management, and it works with just about any digital or paper interface I can think of.
  3. https://37signals.com/how-we-make-decisions – This is a fairly quick read, and they are all the right questions to ask.
  4. https://37signals.com/how-we-communicate – I found this one after reading through the prior link and further exploring the site, which is rich with resources. It’s not a long read. Just an impactful one.


The post From Tech Worker to IT Management: Ten Steps to Success appeared first on Simple Talk.


from Simple Talk https://ift.tt/ls6dzuH
via

Wednesday, May 24, 2023

Microsoft Fabric: Data Warehouse Ingestion using T-SQL and more

.In this blog I will illustrate how we can ingest data from a blog storage to a Microsoft Fabric Data Warehouse using T-SQL.

Create a new workspace

  1. On the left ribbon, click Workspaces.
  2. Click the New Workspace button.

Interface gráfica do usuário, Aplicativo Descrição gerada automaticamente

  1. Provide a name for the workspace.

Tabela Descrição gerada automaticamente

  1. On advanced configuration, ensure you choose Premium by Capacity, and you need to select a capacity.

Interface gráfica do usuário, Texto, Aplicativo, Email Descrição gerada automaticamente

  1. Click the Apply button.

Interface gráfica do usuário Descrição gerada automaticamente com confiança média

Creating the Microsoft Fabric Data Warehouse

  1. On the left ribbon, Experiences button, click the Data Warehouse experience.

Interface gráfica do usuário, Aplicativo Descrição gerada automaticamente

  1. Click the Warehouse button to create a new Warehouse

    Interface gráfica do usuário, Texto, Aplicativo Descrição gerada automaticamente

  2. Define the name wwiSample for the Data Warehouse and click Create.

Interface gráfica do usuário, Texto, Aplicativo Descrição gerada automaticamente

Interface gráfica do usuário, Texto, Aplicativo, Email Descrição gerada automaticamente


Creating the schema to import the data

  1. Click the New SQL query button.

 –dimension_city
DROP TABLEIF EXISTS [dbo].[dimension_city];

CREATE TABLE [dbo].[dimension_city]
             (
                          [citykey] [INT] NULL,
                          [wwicityid] [INT] NULL,
                          [city] [VARCHAR](8000) NULL,
                          [stateprovince] [VARCHAR](8000) NULL,
                          [country] [VARCHAR](8000) NULL,
                          [continent] [VARCHAR](8000) NULL,
                          [salesterritory] [VARCHAR](8000) NULL,
                          [region] [VARCHAR](8000) NULL,
                          [subregion] [VARCHAR](8000) NULL,
                          [location] [VARCHAR](8000) NULL,
                          [latestrecordedpopulation] [BIGINT] NULL,
                          [validfrom] [DATETIME2](6) NULL,
                          [validto] [DATETIME2](6) NULL,
                          [lineagekey] [INT] NULL
             );

–fact_sale

DROP TABLEIF EXISTS [dbo].[fact_sale];

CREATE TABLE [dbo].[fact_sale]
             (
                          [salekey] [BIGINT] NULL,
                          [citykey] [INT] NULL,
                          [customerkey] [INT] NULL,
                          [billtocustomerkey] [INT] NULL,
                          [stockitemkey] [INT] NULL,
                          [invoicedatekey] [DATETIME2](6) NULL,
                          [deliverydatekey] [DATETIME2](6) NULL,
                          [salespersonkey] [INT] NULL,
                          [wwiinvoiceid] [INT] NULL,
                          [description] [VARCHAR](8000) NULL,
                          [package] [VARCHAR](8000) NULL,
                          [quantity] [INT] NULL,
                          [unitprice] [DECIMAL](18, 2) NULL,
                          [taxrate] [DECIMAL](18, 3) NULL,
                          [totalexcludingtax] [DECIMAL](29, 2) NULL,
                          [taxamount] [DECIMAL](38, 6) NULL,
                          [profit] [DECIMAL](18, 2) NULL,
                          [totalincludingtax] [DECIMAL](38, 6) NULL,
                          [totaldryitems] [INT] NULL,
                          [totalchilleritems] [INT] NULL,
                          [lineagekey] [INT] NULL,
                          [month] [INT] NULL,
                          [year] [INT] NULL,
                          [quarter] [INT] NULL
             );

  1. Click the Run button.

The Data Warehouse has full DDL support to prepare tables for data ingestion or create table aggregations.

  1. On the Explorer, open Schemas->dbo->Tables
  2. Click the three dots on the right and select Refresh.

Interface gráfica do usuário, Texto, Aplicativo, Word Descrição gerada automaticamente

Interface gráfica do usuário Descrição gerada automaticamente

  1. Double click the query in the top of the window and give it a new name, Create Tables

Interface gráfica do usuário, Texto, Aplicativo Descrição gerada automaticamente

  1. You will be able to see your query on the left side, in the Explorer.

Interface gráfica do usuário, Aplicativo Descrição gerada automaticamente com confiança média

The Queries area in the explorer is like the queries in datamarts, but in the Data Warehouse we have the Shared Queries, allowing us to create a distinction between our personal queries and queries shared with other users.

You can move a query to Shared Queries by clicking the 3 dots and selecting the option Move to Shared Queries

Interface gráfica do usuário, Aplicativo Descrição gerada automaticamente

Ingesting the data

We can use the COPY statement to ingest the data from an Azure Blog Storage to the data warehouse.

This is the COPY statement syntax:

Texto Descrição gerada automaticamente

The copy statement is capable of:

  • Load data from Blob Storage or ADLS Gen 2
  • Load Parquet or CSV data
  • Connect to secure resources using Credential

Many features documented for the COPY INTO statement for Synapse also work with Synapse Data Warehouse inside Microsoft Fabric. You can discover more about COPY INTO here

  1. Click the button New SQL Query
  2. Paste the following code in the new query window:
COPY INTO [dbo].[dimension_city] FROM ‘https://ift.tt/y8f76i4; 
WITH (file_type = ‘PARQUET’);
 
COPY INTO [dbo].[fact_sale] FROM ‘https://ift.tt/PMh7IUT;
 WITH (file_type = ‘PARQUET’);


This storage is a public storage provided by Microsoft

  1. Click the Run button.

Interface gráfica do usuário, Texto, Aplicativo, Email Descrição gerada automaticamente

The result is 50 million of records loaded in 1min and 26 seconds. Not bad.

  1. Rename the query to Loading Data

Building the Model

The Data Warehouse allows us to create a model which will be shared by all datasets created from the data warehouse. This is similar with the creation of a model in a Power BI Datamart.

  1. On the tabs under the explorer, click the Model tab.

  1. Link the fact_table with the dimension_city by CitKey field, dragging and dropping the field from the fact_table to the dimension city.

Interface gráfica do usuário Descrição gerada automaticamente

  1. The Create Relationship window will be, in general, correct, you only need to click the Confirm button.

Interface gráfica do usuário, Texto, Aplicativo, Email Descrição gerada automaticamente

Uma imagem contendo Diagrama Descrição gerada automaticamente

Creating a Report

The data warehouse is completely integrated with Power BI. All the data is stored in OneLake, as explained in the article https://www.red-gate.com/simple-talk/cloud/azure/data-intelligence-on-light-speed-microsoft-fabric/

Power BI reports access the data in the OneLake using a technology called Direct Lake, which is faster than usual technologies to connect to SQL or Datalakes, either using Import or Direct Query.

  1. Click the button New Report on the top of the window.

Uma imagem contendo Logotipo Descrição gerada automaticamente

The data window on the right side of the screen brings the tables with the relationship already stablished according to the model.

Interface gráfica do usuário, Aplicativo Descrição gerada automaticamente com confiança média

  1. On the visualization pane, select Arcgis Maps for Power BI

Interface gráfica do usuário, Aplicativo, Word Descrição gerada automaticamente

  1. Drag the StateProvince field from the dimension_city to the Location box in the Visualizations bar.

Interface gráfica do usuário, Aplicativo Descrição gerada automaticamente

  1. Move the Profit field from the fact_sale to the Size box in the visualization bar.

Interface gráfica do usuário, Tabela Descrição gerada automaticamente

  1. Resize the Arcgis visual to fill the report area.

Mapa Descrição gerada automaticamente

  1. Click the File -> Save menu.

Interface gráfica do usuário, Aplicativo Descrição gerada automaticamente

  1. Type the name Profit by Region and click the Save button.

Interface gráfica do usuário, Texto, Aplicativo Descrição gerada automaticamente

  1. On the left bar, click DataWarehouseSimple to return to a Workspace view.

Interface gráfica do usuário, Texto, Aplicativo, chat ou mensagem de texto Descrição gerada automaticamente

Besides the data warehouse and the report, you created, the model created in the data warehouse was saved as a dataset.

Interface gráfica do usuário, Texto, Aplicativo, Email Descrição gerada automaticamente

Conclusion

On this blog, you found a walkthrough to create a data warehouse, load from a blob storage using T-SQL, create the modelling and build a report.


The post Microsoft Fabric: Data Warehouse Ingestion using T-SQL and more appeared first on Simple Talk.


from Simple Talk https://ift.tt/BwWPl3K
via