Monday, August 28, 2023

A Beginners Guide to MySQL Replication Part 5: Group Replication

This article is part of Aisha Bukar's 6 part series on MySQL Replication. The entries include:

 MySQL Group replication is a remarkable feature introduced in MySQL 5.7 as a plugin. This technology allows you to create a reliable group of database servers. One of the most important features of MySQL’s group replication is that it allows these servers to store redundant data. This allows the database state to be replicated across multiple servers making it efficient in the situation where there is a server breakdown, the other servers in the cluster can agree to work together.

This technology is built on top of the MySQL InnoDB storage engine and employs a multi-source replication approach which we discussed in part 3 of the replication series. In this article, we’d be looking at an overview of the group replication technique, configuring and managing group replication, and also best practices for group replication. So, let’s get started!

Overview of group replication

MySQL’s group replication was designed to give a high availability, fault tolerant database cluster. It operates using a multi-master replication approach, allowing multiple MySQL server instances to collaborate as a group, ensuring data consistency and availability. This feature ensures high availability by allowing multiple servers to work together, and if one server fails, another server in the group takes over, minimizing downtime and ensuring continuous access to the data.

Group replication can operate in single-primary mode (default), where only one server (which is the primary server) can accept write operations at a time, or multi-primary mode, where multiple servers can accept write operations simultaneously.


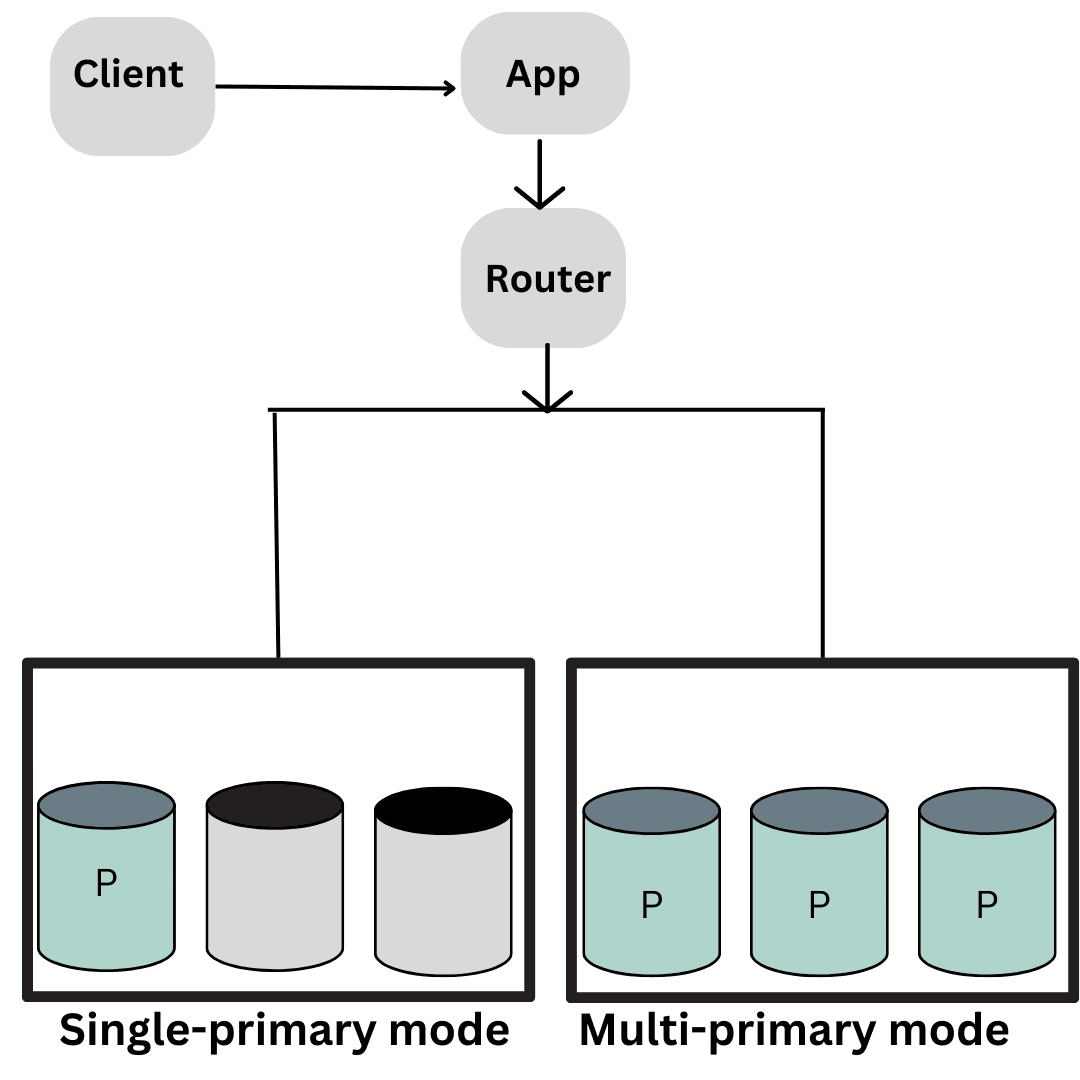
Group replication uses a certification-based replication protocol to ensure that data remains consistent across all servers in the group. In the event of a primary server failure, group replication automatically elects a new primary server to handle write operations, ensuring uninterrupted service by employing middleware devices such as network load balancers or routers. Additionally, it supports both synchronous and asynchronous replication modes, providing flexibility based on your application’s requirements.

Configuring group replication

In order to use MySQL Group Replication, you need to install and configure the plugin on each server in the group. This plugin is designed specifically for the MySQL server and enables you to replicate data across multiple servers, ensuring that your data is always secure and consistent.

By following the installation and configuration instructions carefully, you can ensure that your MySQL group replication setup is both efficient and effective. Here’s a step by step guide to help you demonstrate the process of configuring the group replication:

Ensure that the group replication plugin is installed and activated on each server instance

The MySQL Server 8.0 comes bundled with the Group Replication plugin, so there is no need for extra software. However, it is essential to install the plugin on the active MySQL server to enable its functionality. To install the Group Replication plugin on the active MySQL servers, follow these steps:

i. Check Plugin Availability: First, ensure that the group replication plugin is available in your MySQL installation. Starting from MySQL 8.0, the plugin is included by default, but it’s a good practice to verify its presence. You can do this using the following command:

SHOW PLUGINS;


ii. Connect to MySQL: Use the MySQL client or MySQL Shell to connect to the MySQL server where you want to install the plugin. You need appropriate administrative privileges (e.g., the root user) to perform the installation.

iii. Install the Plugin: Run the following SQL command to install the Group Replication plugin:

INSTALL PLUGIN group_replication SONAME 'group_replication.so';

If you are using Windows, use ‘group_replication.dll’ instead of ‘group_replication.so’.

iv. Verify Installation: To confirm that the installation was successful, you can check the installed plugins by running:

SHOW PLUGINS;

Make sure that ‘group_replication’ appears in the list of installed plugins.

v. Repeat for Other Servers: Repeat the above steps for each of the active MySQL servers that you want to be part of the Group Replication cluster.

It’s important to note that when setting up a Group Replication cluster, all servers should have the same version of MySQL and identical configurations. Also, ensure that you have a backup of your data before making any significant changes to your MySQL installation.

Monitoring group replication 

Monitoring group replication using the performance schema in MySQL involves utilizing a powerful feature that provides the metrics for analyzing the performance of various database activities, including replication. The performance schema allows you to gather detailed insights into how your group replication setup is performing, identify bottlenecks, and diagnose issues. Here’s how you can monitor group replication using the performance schema:

1.Enable Performance Schema: Ensure that the performance schema is enabled in your MySQL server. You can do this by editing the MySQL configuration file (my.cnf or my.ini) and setting the appropriate configuration option, usually “performance_schema=ON”.

2. Relevant Performance Schema Tables: The performance schema provides a range of tables that store information about different aspects of MySQL’s performance, including replication. The key tables related to group replication monitoring include:

i. replication_group_members: This table provides information about the members of your replication group, their status, roles, and more.

ii. replication_connection_status: This table offers details about the connection status between replication group members.

iii. replication_applier_status_by_worker: This table provides information about the status of applier workers on each member, including replication lag and progress.

iv. replication_group_member_stats: This table contains various statistics related to replication for each group member, including transaction counts and sizes.

Running Queries and Analyzing Data

You can run SQL queries against these performance schema tables to retrieve insights into your group replication setup. For example:

To monitor the overall health and state of the replication group, the following query is issued:

SELECT * FROM performance_schema.replication_group_members;

To monitor a group replication members performance, the following query is used:

SELECT * FROM performance_schema.replication_group_member_stats\G

You can also monitor group replication with GTIDs. This is a crucial task which helps to maintain the dependability and consistency of your database. GTIDs (Global Transaction Identifiers) are unique identifiers that are allocated to each transaction in a MySQL database. This makes it simpler to track changes across multiple servers. For more information on GTID, check out part 4 of this series.

To effectively monitor group replication with GTIDs, powerful tools such as MySQL Enterprise Monitor or Percona Monitoring and Management are utilized. These tools allow you to keep an eye on your replication group’s status, assess transaction performance and latency, and diagnose any issues that may arise. It is highly recommended to regularly monitor your replication group to guarantee that it is functioning correctly and to detect potential issues early on. 

Best practices for group replication

To achieve a successful MySQL group replication, it’s crucial to ensure that:

1. All members in the group are using the same version of MySQL

2. All members have identical configuration settings

3. All members are connected through a reliable network

It’s also essential to monitor the group’s status regularly and perform backups to maintain data safety in case of failures. Limiting the number of members in the group can reduce the likelihood of conflicts and ensure efficient replication. Consistency and communication are the main factors in maintaining the group’s success.

Conclusion

MySQL group replication is an important topic in replication. It helps multiple server instances to collaborate as a group. This article is beginner friendly and only highlights the important aspects of using the group replication technique. For more in-depth information, please visit the official MySQL blog and documentation.

The post A Beginners Guide to MySQL Replication Part 5: Group Replication appeared first on Simple Talk.


from Simple Talk https://ift.tt/xOe8CDt
via

Saturday, August 26, 2023

Yet Another Reason to Not Use sp_ in your SQL Server Object Names

In 2012, Aaron Bertrand said most everything I knew (and a bit more) about the issues with using the sp_ prefix. Procedures prefixed with sp_ have special powers when placed in the the master database in that it can be executed anywhere on the server after that. Nothing much has change in those suggestions.

It isn’t that such objects are to be completely avoided, it is that they are ONLY to be used when you need the special qualities. Ola Hallengren’s backup solution creates a dbo.sp_BackupServer procedure so you can run the backup command from any database.

But if you don’t need the special properties of the sp_procedure, they are bad for the reasons Aaron stated, the reason I stumbled upon today being just a special subset. In this case CREATE OR ALTER behaves differently than CREATE in a way that was really confusing to me as I was working on a piece of code today.

My problems are going to be simple code management issues where some code existed in the master database and it confused me as to why something was working, and then why it wasn’t.)

I had accidentally executed the procedure create script in the master database. (I know, I am the only person with this mistake to their name. But if there is no USE statement to start off a script, when I am testing out code it often ends in master. I don’t have access to ANY production resources, so I am usually playing with other people’s code. It is in fact a good reason to change your default database to tempdb.)

Using CREATE OR ALTER

So I executed something like the following:

USE master; --I clearly didn't have a USE 
            --statement in my code!
GO
CREATE OR ALTER PROCEDURE dbo.sp_DoSomethingSimple
AS
 BEGIN
        --format for easier access in writing
        SELECT CAST(DB_NAME() AS VARCHAR(30)) AS DatabaseName;
 END;
GO

Then, later in my testing, I did something like this:

USE WideWorldImporters
GO
EXECUTE  dbo.sp_DoSomethingSimple;
GO

This worked fine and returned:

DatabaseName
------------------------------
WideWorldImporters

Seemed fine. So, I went to drop and recreate this procedure with a new column in the output.

CREATE OR ALTER PROCEDURE dbo.sp_DoSomethingSimple
AS
 BEGIN
     SELECT CAST(DB_NAME() AS VARCHAR(30)) AS DatabaseName,
           CAST(USER_NAME () AS VARCHAR(30)) AS UserName;
 END;
GO

This is where it gets weird, and where your developer is going to be confused… quite confused. It said it did not exist, even though I just executed it:

Msg 208, Level 16, State 6, Procedure sp_DoSomethingSimple, Line 1 [Batch Start Line 34]

Invalid object name 'dbo.sp_DoSomethingSimple'.

Well, I never. I just executed this procedure, and it was there. And EVEN IF IT WEREN’T, I said CREATE OR ALTER. So, create it. A few more rounds like this, a stop for a snack and maybe fight a few Goombas on Mario Brothers, and then a few more rounds against the query compiler… it hit me. I bet I saved this in the master database. So, I cleared it out and all was okay.

But for sake of demonstration, let’s leave that object right where it was. In the master database. This code will make sure that the procedure is only in master, not in your current database:

SELECT  'master', CONCAT(OBJECT_SCHEMA_NAME(object_id),
                '.',OBJECT_NAME(object_id))
FROM    master.sys.procedures
WHERE   name = 'sp_DoSomethingSimple'
UNION 
SELECT  CAST(DB_NAME() AS NVARCHAR(30))
                , CONCAT(OBJECT_SCHEMA_NAME(object_id),
                '.',OBJECT_NAME(object_id))
FROM    sys.procedures
WHERE   name = 'sp_DoSomethingSimple'
GO

/*

This should only return:

------------------------------ ----------------------------
master                         dbo.sp_DoSomethingSimple

If it just has the one row for master, we can continue on.

Ok, so let’s do far more dangerous version of this. Let’s try to drop the procedure. CREATE OR ALTER didn’t change anything, so other than confusing me, not a big deal. But what about:

USE WideWorldImporters
GO
DROP PROCEDURE dbo.sp_DoSomethingSimple;
GO
EXECUTE  dbo.sp_DoSomethingSimple;
GO

Uh oh. I have just silently dropped the master procedure that I really didn’t want to lose.

Msg 2812, Level 16, State 62, Line 77
Could not find stored procedure 'dbo.sp_DoSomethingSimple'.

Of course, I can create the procedure in the WideWorldImporters database now, but it is only available to my database. If that is what you wanted, then that is fine, but if not, you will eventually hear about it. Hopefully you won’t have to admit it was your fault, but if it is, blame the person who used sp_ as the prefix, unless that was you too…

Using CREATE and DROP

Finally, what if instead of CREATE OR ALTER, you had just used CREATE? Assuming you have been following along, there should not be a sp_DoSomethingSimple in either place now, but I added code to make sure:

USE master; 
DROP PROCEDURE IF EXISTS dbo.sp_DoSomethingSimple;
GO
USE WideWorldImporters;
DROP PROCEDURE IF EXISTS dbo.sp_DoSomethingSimple;
GO

After dropping the procedures, try executing the following:

USE master; 
GO
CREATE PROCEDURE dbo.sp_DoSomethingSimple
AS
 BEGIN
        --format for easier access in writing
        SELECT CAST(DB_NAME() AS VARCHAR(30)) AS DatabaseName;
 END;
GO
USE WideWorldImporters
GO
CREATE PROCEDURE dbo.sp_DoSomethingSimple
AS
 BEGIN
        SELECT CAST(DB_NAME() AS VARCHAR(30)) AS DatabaseName,
                   CAST(USER_NAME () AS VARCHAR(30)) AS UserName;
 END;
 GO

If the procedures did not exist, no error occurred. If that wasn’t fun enough to say “no sp_ procedures”, then I have one more reminder:

Use WideWorldImporters;
DROP PROCEDURE dbo.sp_DoSomethingSimple;

Returns the following message:

Commands completed successfully.

Run it again:

DROP PROCEDURE dbo.sp_DoSomethingSimple;/*

Same return message, you just dropped the one in master. But what you thought happened was that the first DROP PROCEDURE failed. Or you probably did, I know that was my first reaction. A third execution will get you the message you expected:

Msg 3701, Level 11, State 5, Line 126

Cannot drop the procedure 'dbo.sp_DoSomethingSimple', because it does not exist or you do not have permission.

Changing the syntax to DROP PROCEDURE IF EXISTS will not change the outcome of the following batches. The second execution will still drop the master copy. If you use the sort of code we used before IF EXISTS existed:

IF EXISTS (SELECT * 
           FROM sys.objects 
           WHERE OBJECT_ID('dbo.sp_DoSomethingSimple') = 
                                                 object_id)
DROP PROCEDURE dbo.sp_DoSomethingSimple;

Then it would not drop the master copy (but to use a cumbersome prefix like sp_, is it worth not being able to say DROP PROCEDURE IF EXISTS?)

Conclusion

Only use sp_ as a prefix to your procedure if you need it, and then it goes in the master database. Otherwise, you may get pretty confused one day when a system object stops working because it doesn’t always work like you expect.


The post Yet Another Reason to Not Use sp_ in your SQL Server Object Names appeared first on Simple Talk.


from Simple Talk https://ift.tt/Wza2xsd
via

Thursday, August 24, 2023

Applying Agile principles to IT incident management

Agile development has grown in popularity in recent years due to its success in delivering software on time and on budget. If you’re looking for a way to make your software development process more flexible and responsive, Agile might be a good option for you. There are many different Agile methodologies, but some of the most popular are Scrum, Kanban, and Extreme Programming (XP).

A development team uses Scrum to create a new application. They break the project into small, manageable tasks and meet regularly to plan, execute, and review progress. A manufacturing company uses Kanban to manage its production chain. You create a visual chart that tracks the status of each product and use that chart to identify and eliminate bottlenecks. Ditto for the marketing team using XP to develop a new website. They work in pairs to code and test the website, receiving user feedback throughout the development process. 

DEFINITION OF AGILE

Agile refers to a set of principles and practices that emphasize flexibility, collaboration, and iterative development. An agile team typically breaks projects into small, manageable pieces that can be delivered quickly and frequently. This makes it easier for teams to respond to changes in requirements or the environment. This team comes together around a shared vision and then brings it to life in the way they know best. Each team sets its own standards of quality, usability, and completeness. Business leaders find out that when they trust an agile team, the team develops a greater sense of responsibility and grows to meet and even exceed management expectations. Working with customers and team members is more important than ready-made agreements, and providing a working solution to a customer’s problem is more important than very detailed documentation. 

A software development incident is an unplanned event that affects the normal operation of a software system. Incidents can have a significant impact on the availability and performance of a software system. They can also cause financial loss and damage the reputation of the organisation owning the system.

Crashes in your IT infrastructure can be caused by a variety of factors, such as:

  • Software bugs: Bugs in software code that can cause unexpected system behavior. 
  • Hardware errors: Problems with the physical components of the system, such as the processor, memory or the data storage. 
  • Network outages: Network outages can prevent your system from communicating with other systems internally or via the Internet. 
  • Human Errors: Errors made by users or administrators that can cause the system to malfunction. Incident Management is the process of identifying, analyzing and resolving incidents that disrupt the normal operation of the Service. The aim is to restore the service to normal operation as soon as possible and minimise the impact on the business. This is an important process to ensure the availability and performance of IT services. With a well-defined incident management process, organisations can reduce the impact of incidents and improve the overall quality of their IT services. 

Some problems may be caused by software that has been written internally, others from hardware and software that has been purchased. For the incident management professional, what the problem is isn’t really the big deal. The process to go from alarm bells ringing in the back ground to calm working conditions is really what matters. The principles of Agile can help with that.

IMPORTANCE OF AGILE IN INCIDENT MANAGEMENT.

Agile principles play a crucial role in incident management, bringing several benefits and improving the overall effectiveness of the process. Here are some key reasons why Agile principles should be an important part of your incident management:

  • Flexibility and Adaptability: Incidents can be unpredictable and may require flexibility in response. Agile methodologies embrace change and adaptability, allowing teams to adjust their plans and approaches based on evolving incident circumstances. Agile teams are equipped to handle unforeseen challenges, make quick decisions, and modify their incident response strategies as needed.
  • Continuous Learning and Improvement: The Agile mindset encourages continuous learning and improvement. In incident management, this means analysing incidents, identifying root causes, and implementing corrective actions to prevent similar incidents in the future.

    Agile principles like retrospective meetings allow teams to reflect on their performance, learn from their experiences, and adapt their practices for better incident response in the future.

  • Continuous Visibility and Transparency: Agile practices emphasise transparency and visibility of work progress. In incident management, this enables stakeholders to have a clear view of incident status, resolution progress, and any potential bottlenecks. Increased visibility helps manage expectations, facilitates effective communication, and enables timely decision-making during incident response.

By incorporating Agile principles into incident management, organisations can enhance their ability to handle incidents efficiently, minimize downtime, and continuously improve their incident response capabilities. Agile enables teams to be more adaptable, collaborative, and customer-focused, leading to faster incident resolution, reduced impact on services, and increased overall organisational resilience.

AGILE PRINCIPLES APPLIED TO INCIDENT MANAGEMENT

When Agile principles are applied to incident management, it brings a flexible and iterative approach to handling incidents. In this section I will discuss key Agile principles and how they can be applied to incident management.

Empirical Process Control: 

Empirical process control is a fundamental Agile principle that emphasises learning and adaptation through data analysis. Applying this principle to incident management involves collecting incident data, analysing metrics, and using the insights to make informed decisions, adjust processes, and continuously improve incident response. This includes:

  • Transparency: Making processes transparent allows for open communication and collaboration and helps to ensure everyone is on the same page. Agile teams can use tools like Jira or Trello to track their processes. This allows them to share information with stakeholders and identify problems or areas for improvement. Sharing data allows teams to openly and regularly exchange information with each other and with stakeholders.
  • Inspection: Agile teams regularly review their processes to identify problems or areas for improvement. This allows them to take corrective action before the problems become too big. This means agile teams regularly review their work to identify problems or areas for improvement. This ensures that the work is of high quality and that the project is progressing as planned. When teams regularly review their work, they are more likely to find and fix bugs sooner.
  • Adaptation: Agile teams are built to adapt to change. They must be willing to change their processes as needed to improve their performance. Agile teams typically take a continuous improvement approach to their processes. This allows them to make small changes to their processes on a regular basis and learn from each change.

By applying agile principles to empirical process control, companies can improve their ability to deliver high-quality software.

Customer Collaboration over Contract Negotiation: 

In incident management, the focus should be on collaborating with the affected customers or users rather than adhering strictly to predefined processes or procedures. This involves effective communication, understanding customer needs, and involving them in incident resolution discussions to ensure their requirements are met.

A sprint planning meeting is a great tool where the agile team and their customers make plans for what to work on for the next sprint. This includes discussing the user stories we will be working on and the customer’s feedback. Sprint reviews are meetings where the team demonstrates the work done in the sprint to the customer. This gives the customer an overview of the progress of the project work and allows him to express his opinion.

In incident management, we prioritise incidents based on impact to customers and keep customers informed throughout the incident response process. Using techniques such as user stories is one way to capture customer needs and have a document of the entire incident for future discussion.

Collaboration with the customer ensures that the team is working on the right things and that the product meets the needs of the customer.

Individuals and Interactions over Processes and Tools: 

Incident management should prioritise the collaboration and interaction between individuals involved in resolving the incident by building a cross-functional incident management team and empowering team members to make decisions. This principle emphasises the importance of clear communication, teamwork, and knowledge sharing among incident response teams to efficiently address and resolve incidents.

When teams focus on individuals and interactions, they are more motivated and engaged. This can result in a more productive and enjoyable work environment. You can use some strategies, e.g. B. Pair programming, a technique in which two programmers work together on the same task. This helps improve communication, collaboration, and knowledge sharing. Standup meetings are short daily meetings where team members share their progress and the obstacles they face. This helps to keep everyone on the same page and catch problems early.

Additionally, regular retrospective meeting that take place after a sprint to take stock of the processes that have been used in recent sprints/incidents and identify opportunities for improvement.

Responding to Change over Following a Plan:

The Agile Manifesto states that “reacting to change rather than following a plan” is one of its core values. This means agile teams should value being able to react to change rather than following a rigid plan and this is even more important when handling incidents.

Incidents are often unpredictable. Who plans for a major outage on a specific time and place? (Incident management people do, but typically only testing the current incident management process that are currently in place.

Agile principles promote flexibility and adaptability in response to unplanned incidents. Teams should be ready to adjust their plans, workflows, and priorities as new information emerges during incident response by adapting incident response plans in real-time. This allows for a more responsive and effective approach to handling incidents. 

Working Software over Comprehensive Documentation: 

While documentation is important, Agile principles emphasise the value of working software. In incident management, the focus should be on resolving the incident promptly and restoring services rather than spending excessive time on extensive documentation.

However, it is still essential to capture key information and lessons learned for future reference and continuous improvement. This can help reduce the risk of product rejection or the need for a redesign and increase the likelihood of effective customer communication. This can help ensure that the customer is happy with the product and any changes can be made quickly and easily.

Too often an incident management system becomes more about stats and who is doing more than everyone else than being about serving the customer. It is important to make sure that documentation is essential and more necessary for future learning that for choosing who does more, or who does less.

Some processes do require more documentation than others. For example, every organization should have a plan in case of a disaster and how it will be handled. Everyone that has gone through a disaster knows the plan won’t work exactly as written, so finding the proper amount of documentation is key.

Iterative and Incremental Delivery: 

Agile promotes an iterative approach to work. In incident management, this means breaking down the incident resolution process into smaller, manageable tasks or increments. By addressing incidents incrementally, teams can make progress and deliver tangible results at regular intervals, improving efficiency and maintaining momentum.

Continuous Improvement: 

After resolving an incident, teams should conduct retrospective meetings to reflect on what went well, identify areas for improvement, and implement changes to prevent similar incidents in the future. This iterative feedback loop helps drive ongoing improvement in incident response capabilities.

By applying these principles to incident management, organizations can enhance their ability to respond to incidents efficiently by: collaborating effectively, adapting to changing circumstances, and continuously improving incident response practices. While every incident is generally different from the other (or you have a different problem in your organization), the process to handle all incidents will generally operate the same way more or less.

It promotes a more flexible, customer-focused, and iterative approach to handling incidents, ultimately leading to better service quality and customer satisfaction.

BENEFITS OF ADOPTING OF AGILE PRINCIPLES IN INCIDENT MANAGEMENT

In this section I want to summarize the benefits we have covered in this article. While IT incident management isn’t exactly the same as software development, many of the principles transfer easily to managing incidents that frequently occur with an organization’s IT.

  • Improved Collaboration and Communication: Agile emphasises collaboration and effective communication among team members. In incident management, this is vital for coordinating efforts, sharing information, and resolving issues efficiently. Agile practices such as daily stand-up meetings, visual boards, and cross-functional teams promote clear and open communication, enabling faster incident resolution and knowledge sharing.
  • Rapid Response: Agile methodologies promote a quick and responsive approach to problem-solving. By embracing Agile principles in incident management, teams can quickly identify, prioritise, and address incidents, minimising their impact on service delivery. Agile practices like short feedback loops and frequent communication enable teams to adapt and respond promptly to changing circumstances.
  • Increased customer satisfaction: Agile methodologies prioritise customer satisfaction and value delivery. In incident management, this means placing the customer at the center of the response efforts. By adopting Agile principles, incident management teams can ensure that customer needs and expectations are understood and addressed promptly. This customer-centric approach helps maintain trust, minimise service disruptions, and deliver a positive customer experience during incidents.
  • Reduced Risk and Downtime: By adopting Agile principles, incident management teams can proactively identify and mitigate risks. Frequent inspections and adaptations help in identifying root causes, implementing preventive measures, and reducing the likelihood of recurring incidents, minimising the impact on service availability.
  • Empowered and Engaged Teams: Agile principles empower team members to make decisions, collaborate, and take ownership of incident resolution. This fosters a sense of responsibility, engagement, and motivation, leading to increased productivity and job satisfaction.
  • Enhanced Data-Driven Decision Making: Agile principles encourage teams to rely on data and metrics for decision making. In incident management, this enables teams to analyse incident data, identify patterns, and make informed decisions to improve incident resolution processes.

Agile is a project management methodology that emphasizes iterative development, ongoing collaboration, and customer feedback. It’s a popular choice for companies of all sizes because it enables teams to deliver products and services faster and more efficiently. Teams can quickly adapt to change and unforeseen circumstances, delivering products and services faster.

There are some challenges; The team must be comfortable with iterative development, continuous collaboration, and gathering customer feedback. Teams need to work in a flexible environment that allows them to quickly adapt to change. The optimal use of agility varies depending on the typical types of incidents as well as the team involved.


The post Applying Agile principles to IT incident management appeared first on Simple Talk.


from Simple Talk https://ift.tt/LgYSnWH
via

Tuesday, August 22, 2023

How to Write a Technical Blog That Gets Read

There is a relatively simple and quickly learned technique to writing a blog that people will want to read. We asked an anonymous successful blogger, who is widely read, how it is done. I will try to explain, purely from my experience (and the editors before me), how to write articles, blogs, features, or short pieces people will want to read.

Choosing Your Subject

Coming up with a topic is typically the most challenging task, probably not for the reasons you think. Everyone has topics in their life that they could write about if they wanted to. Thousands of things, actually. Everything you do every day could be a blog. In fact, think of any task you have completed this week and go to your search engine. You will find instructional blogs, videos, books, and everything.

Warning, I actually do mean anything, and I am not liable for what you search for on your company computer.

Now, limit your ideas to technical topics, and you have topics to write about. What is hard is matching the topic to the size you want your written piece to be. If you want to write about being a cross-platform DBA, you need an entire book to go into detail. And when you write that book, the first thing they will make you do is break down those topics into chapters and then sections.

General advice. Pick the topic you are interested in and outline it. Think about what you want to say. It may be too small of an idea, which does happen every 10 years or so. Usually, you will find that you have uncovered a series of blogs to write.

The opening

Writing is like having a one-way conversation. Just as when you engage in conversation, you have to be aware of what the other participant wants: In the case of an article, the reader will probably first want to know in advance if it will be worth reading.

It is best to start by briefly explaining what you want to say and why the reader should continue reading. The reader will give you a narrow window of attention: Take it. Starting with a title and going right into the first paragraph, you want to be clear about what problem you will help them solve or what advice you are giving. If that isn’t what they are looking for, they probably aren’t going to read on. If they liked what they read in the first paragraph, they may pick your article first the next time. 

Because of this, the first paragraph you write is by far the most important.

You don’t have to give away everything in that first paragraph, but this is also not a murder-mystery novel where you are trying to intrigue all readers into reading about a topic. No matter how well-written the article, the reader probably isn’t going to continue reading an article on “database server tips” if they were looking for details on how much to tip their server. Not even if you start out your blog, “It was a dark and stormy night.”

In fact, you will find that most people come to your blog from a search engine, looking for a specific solution or advice. The opening paragraph needs to let them know what they are getting and whether to keep going.

Writing the Rest of the Article

After you set the tone with an opening, the rest of the process is relatively straightforward. In this section, I will give some basic advice. First, choosing a style for your article, and then give some general writing mechanics advice.

Style

There are two styles of writing a technical article that works excellently. They are not mutually exclusive; best case, you will get some of both. The two styles are telling stories and demonstrating concepts.

Storytelling is taking some occurrence you have experienced and telling the story. Someone had a breach, and here is why. On a project, we had to uppercase all the documents in a system. I had to work all night last night fixing a problem you may be up against someday. A DBA and developer walk into a bar… Stories don’t have to be completely real, but usually, realistic helps.

Telling a story helps the reader relate to what you are writing about, so it draws them in.

The other way is to demonstrate a concept, like an article on using a new language concept. Say there is a new function named UpperCase in a language you want to highlight. Walking through the generic uses of this new function can be a great article. Here is what it does, what it doesn’t do, and how it performs. The more authentic your explanation is, the better, but it doesn’t have to be connected to any reality.

In the best case, you can tie the two together. “A few years ago, we were working on this project, and we needed to capitalize all the words in a document. At the time, there was no built-in way to do this, so we had to do…Now, you can do this, and let me show you all the things you can do.” Adding a bit of story to a demo can draw people in because they realize that what is being done sounds like something they might have to do one day.

Note that when you tell a story, be careful not to just drop the story element altogether as the blog progresses. The story adds a theme to your blog that people will want closure on if they read it in detail. Did you actually get those documents upper cased? Or did you fail? Either way, you will probably connect with readers as we all have succeeded and failed many times.

Mechanics

In this section, I will cover some general advice for writing. These pieces of advice are specially tailored to writing a technical article for public consumption. All rules are meant to be broken occasionally, but this advice will go a long way.

Keep things generally professional. If you want to attract a wide readership, it is generally best to not lapse into dialect, swearing, or deliberately setting out to be disgusting. When you’re chatting with your peer group, these may seem a suitable bonding techniques. Still, on a blog or in an article, it invariably looks ridiculous. You should, by contrast, go out of your way to write clearly and inoffensively.

Moderate the use of jargon\acronyms. Be careful to not speak with the unique argot of any closed group that may be readers. Narrowly used business or technical jargon seems fine when used at work, but when written down and read by people from widely different cultures, it can seem bizarre. Ideally, speak to the people with the lowest understanding of your source material.

If jargon is bad, acronyms can confuse people badly, even if they are experts in the field but just haven’t seen the acronym before. So always define acronyms.

As an example, if you are writing about database query optimization, speak to people who write queries already and want to make them go faster. You don’t have to explain what a query is or how to connect to a server, but you might need to explain the different join algorithms and how to access information on what the query is doing. At least give readers links you find valuable to do that. People who know what a hash match join is won’t mind a bit of reminding. Readers that are clueless to what that is may give up after hitting the one-star review button and keep scanning for search results on a different site next time.

Don’t try to sound like a word-a-day calendar. In the previous paragraph was the word argot. This was written by the writer of the first version of this document, and I had to look it up. It basically means jargon.

Don’t dumb things down too much, and using a not-super-common word occasionally is not a big problem (and can be a good tactic to get the reader interested. Just don’t try to make yourself sound like an English professor.

Generally, avoid emojis/emojis. It will seem incredible to many that emoticons are not part of international English: they are a prop to casual written discussion, but any prose must be of sufficient quality to convey the emotion you require.

Show your work or show your sources. If you present information as fact, you need to give a supporting reference or prove that it is fact. For example, if you say that the UpperCase function makes all the characters of a string uppercase, link to it in the documentation or provide examples of it working. Ideally both. It isn’t weak to give readers more information.

One of the more annoying things to read in an article is boasts of the casualness of your writing, like ‘I haven’t the time to explain …blah …’ is a big turn-off. Why should they put in the effort to read it? Note that this is different from saying ‘I don’t know.’ You aren’t writing the documentation for a product, you are sharing some information about it. You may still have questions you would like to know. It is okay to say that.

Be clear in your writing but never dull. Never be afraid of striking up an attitude or showing emotion but do it with subtlety. Be conservative with your material. You need as few ideas or messages as possible, but they must be as good as you can possibly make them. Never confuse quantity and quality. Although metaphor, simile, and adjective need to be appropriate, never be too clichéd.

A final rule in writing a compelling article is to occasionally break a rule. The best articles show a certain tension and risk as if watching a high-wire act. Will the writer somehow drop off?

For example, note the advice to not use uncommon words. Sometimes, you need to prod the reader into full wakefulness with an unusual word, phrase, or saying.

Finishing up

To wrap up an article, the final paragraphs should enable the article, like an airplane, to land gracefully. It helps to recap the main points you’ve made and maybe plant an idea that leads the reader to learn more about your topic.

Summarize the points you have made to remind the reader what you have said, but it doesn’t need to be a checklist of everything you have said.

—————

If you have tips or concepts, add them to the comments for the post and I will update this article to reflect them.


The post How to Write a Technical Blog That Gets Read appeared first on Simple Talk.


from Simple Talk https://ift.tt/cnj2JGS
via

Monday, August 21, 2023

Fabric Lakehouse: Convert to Table feature and Workspace Level Spark Configuration

I have been working as a no-code data engineer: Focused on Data Factory ETL and visual tools. In fact, I prefer to use visual resources when possible.

On my first contact with Fabric Lakehouse I discovered to convert Files into Tables I need to use a notebook. I was waiting a lot of time for a UI feature to achieve the same, considering this is a very simple task.

Convert to Table feature is Available in Lakehouses

This feature is finally available in the lakehouse: You can right-click a folder and choose the option “Convert to Table”.

When converting, you can create a new table or add the information to an existing table. This allows you to make an incremental load manually, if needed.

It’s simple as a right-click over the folder and asking for the conversion.

A screenshot of a computer Description automatically generated

Table Optimizations in Lakehouses

There are optimizations we should do when writing delta tables. We usually do these optimizations on the spark notebooks we create.

For example:

  • spark.sql.parquet.vorder.enabled
  • spark.microsoft.delta.optimizeWrite.enabled
  • spark.microsoft.delta.optimizeWrite.binSize

A screenshot of a computer Description automatically generated

You can discover more about these optimizations on this article from Microsoft

How would we make these configurations if we use the UI feature?

Workspace Level Spark Configuration

We can make these configurations on workspace level. In this way, these configurations will become default and be applied to every write operation.

  1. On the workspace, click the button Workspace Settings

A close-up of a screen Description automatically generated

  1. On the Workspace settings window, click Data Engineering/Science on the left side.
  2. Click Spark compute option.

A screenshot of a phone Description automatically generated

  1. Under Configurations area, add the 3 properties we need for optimization.

A screenshot of a computer Description automatically generated

Differences between converting using UI or Notebooks

Let’s analyze some differences in relation to the usage of the UI and the usage of a spark notebook:

UI Conversion

Spark Notebook

No writing options configuration, it depends on workspace level configuration

Custom writing options configuration

No partitioning configuration. The table can’t be partitioned

Custom partitioning is possible for the tables.

Manual Process, no scheduling possible

Schedulable process

Summary

This is an interesting new interactive feature for lakehouse in Fabric, but when we need to build a pipeline to be scheduled, we still need to use notebooks or data factory.

The workspace level configuration for spark settings is also very interesting.

The post Fabric Lakehouse: Convert to Table feature and Workspace Level Spark Configuration appeared first on Simple Talk.


from Simple Talk https://ift.tt/xFh659f
via

Learning PostgreSQL With Grant: Introducing VACUUM

While there are many features within PostgreSQL that are really similar to those within SQL Server, there are some that are unique. One of these unique features is called VACUUM. In my head, I compare this with the tempdb in SQL Server. Not because they act in any way the same or serve similar purposes. They absolutely do not. Instead, it’s because they are both fundamental to behaviors within their respective systems, and both are quite complex in how they work, what they do, and the ways in which we can mess them up.

VACUUM is a complex, deep, topic, so this article will only act as an introduction. I’ll have to follow up with more articles, digging into the various behaviors of this process. However, let’s get started. VACUUM, and the very directly related, ANALYZE, are vital processes in a healthy PostgreSQL environment. Most of the time these will be running in an automated fashion, and you’ll never deal with them directly. However, since these processes are so important, I am going to introduce them now.

The PostgreSQL VACUUM Process

At its core, VACUUM is pretty simple. PostgreSQL doesn’t actually, physically, remove the data when you issue a DELETE statement. Instead, that data is logically marked as deleted internally and then won’t show up in queries against the table. For an UPDATE statement, a new row is added and the old row is logically marked as deleted. As you can imagine, if nothing is done, your database will eventually fill your disk (unless you define a TABLESPACE for the tables and limit its size, and that’s another article). The first function then of VACUUM is to remove those rows from the table. That’s it. Nice and simple.

Well, of course it’s not that simple.

VACUUM has a second behavior called ANALYZE. The ANALYZE process examines the tables and indexes, generating statistics, and then stores that information in a system catalog (system table) called pg_statistic. In short, VACUUM ANALYZE is the PostgreSQL equivalent of UPDATE STATISTICS in SQL Server.

I told you that VACUUM was both complex and integral to the behavior of PostgreSQL. Without it you not only will fill your drives, but you won’t have up to date statistics. There’re even more behaviors wrapped up within the VACUUM process, but we’re not going to cover them all here. In fact, we’re not even going to go very deep into the two standard behaviors, cleaning up your tables and maintaining your statistics, because each of these are very deep topics all on their own. We are going to go over the basics of how these processes work and why you need to pay attention to them.

VACUUM

Making VACUUM work is very simple. This command will ensure that the space is retrieved from all tables:

VACUUM;

While the space from the removed rows is reclaimed for reuse, the actual size of your database won’t shrink. The exception to this is when there are completely empty pages at the tail end of the table. In that case, you can see the space being completely reclaimed.

The PostgreSQL equivalent to SHRINK would be to run VACUUM like this:

VACUUM (FULL);

This command will rebuild all the tables in the database into new tables. That comes with significant overhead and will most certainly cause blocking while the data is being moved. This will also cause significant IO on the system. However, it’ll remove every empty page, reclaiming space for the operating system. Again, similar to SHRINK, running this regularly is not considered a good practice. In fact, Ryan Booz, who kindly did some technical edits on this article says, “running this at all is not considered a good practice.” The core issue is that while running this command, the standard automated VACUUM processes are blocked, possibly setting you up to need to run this process again, then again, then… Well, you get the point.

You can also target specific tables when running VACUUM manually:

VACUUM radio.antenna;

You can even specify a list of tables:

VACUUM radio.antenna, radio.bands, radio.digitalmodes;

In either of these cases, instead of accessing every table in the database to which I have permissions, only the table or tables listed will go through the VACUUM cleanup process.

To really see what’s happening, we can take advantage of an additional parameter, VERBOSE. I’m going to load up a table with some data and then remove that data. Then, we’ll run VACUUM:

INSERT INTO radio.countries 
(country_name)
SELECT generate_series(1,15000,1);

DELETE FROM radio.countries 
WHERE country_id BETWEEN 3 AND 12000;

VACUUM (VERBOSE) radio.countries;

The results are as follows (yours may vary some, but should be similar):

vacuuming "hamshackradio.radio.countries"

finished vacuuming "hamshackradio.radio.countries": index scans: 1

pages: 0 removed, 81 remain, 81 scanned (100.00% of total)

tuples: 11998 removed, 3004 remain, 0 are dead but not yet removable

removable cutoff: 1305, which was 0 XIDs old when operation ended

new relfrozenxid: 1304, which is 3 XIDs ahead of previous value

index scan needed: 64 pages from table (79.01% of total) had 11998 dead item identifiers removed

index "pkcountry": pages: 77 in total, 58 newly deleted, 65 currently deleted, 7 reusable

avg read rate: 12.169 MB/s, avg write rate: 12.169 MB/s

buffer usage: 729 hits, 3 misses, 3 dirtied

WAL usage: 388 records, 0 full page images, 96719 bytes

system usage: CPU: user: 0.00 s, system: 0.00 s, elapsed: 0.00 s

I’m not 100% on everything going on here, as this series says, learning with Grant. However, there is easily spotted information. 11,998 tuples removed with 3004 remaining. You can also see the pages for the pkcountry index where there was 77 pages, but 58 were deleted and 7 are reusable. On top of all that, you get the performance metrics at the end for just how long everything took and the I/O involved. This is all useful stuff.

For anyone following along in the series, if you want to clean up your table after this little test, here are the scripts I used:

DELETE FROM radio.countries 
WHERE country_id > 2;

ALTER TABLE radio.countries 
    ALTER COLUMN country_id RESTART WITH 3;

I could probably run VACUUM on the table again to see more results.

Now, there are simply metric tonnes more details on everything VACUUM does and how it does it. However, these are the basics. Let’s shift over and look at ANALYZE for a minute.

ANALYZE

One thing that PostgreSQL shares with SQL Server is the use of statistics on tables as a means of row estimation within the query optimization process. And, just like SQL Server, these statistics can get out of date as the data changes over time. While there is an automated process to handle this (more on that later), you may find, just like SQL Server, that you need to intervene directly. So, built in to the VACUUM process is the ability to update statistics through the ANALYZE parameter:

VACUUM (ANALYZE);

Just as with the VACUUM command at the start, this will examine all the tables that I have access to within the database in question and run ANALYZE against them.

Interestingly, you can run ANALYZE as a separate process. This will do the same thing as the preceding statement:

ANALYZE;

You can run the commands separately primarily as a mechanism of control and customization. The actions performed are the same. To see this in action, I want to look at the radio.countries table and the statistics there, after running ANALYZE to be sure that it reflects the two rows in the table:

VACUUM (ANALYZE) radio.countries;

SELECT
        ps.histogram_bounds
FROM
        pg_stats AS ps
WHERE
        ps.tablename = 'countries';

Now, as with SQL Server, there’s a whole lot to statistics. I’m just displaying the histogram here so we can see why kind of data might be in it. The results are here:

I’m going to rerun the data load script from above, and then immediately look at the statistics in pg_stats again. Since there is an automatic VACUUM process (more on that later) that runs about once a minute by default, I want to see the stats before they get fixed by an automated ANALYZE process:

INSERT INTO radio.countries 
(country_name)
SELECT generate_series(1,15000,1);

SELECT
        ps.histogram_bounds
FROM
        pg_stats AS ps
WHERE
        ps.tablename = 'countries';

VACUUM (ANALYZE) radio.countries;

SELECT
        ps.histogram_bounds
FROM
        pg_stats AS ps
WHERE
        ps.tablename = 'countries';

The first result set (not pictured) from pg_stats is exactly the same as the figure above. This is because they automated VACUUM process hasn’t run ANALYZE yet and I didn’t do a manual ANALYZE. Then, of course, I do the ANALYZE and the results of the histogram change to this:

A screenshot of a computer Description automatically generated with low confidence

It just keeps going from there, out to the width of the values in the histogram for the table (again, another article we’ll be covering in the future).

I can also take advantage of the VERBOSE parameter to see what’s happening when ANALYZE runs. This time I’ll just run the ANALYZE command though:

DELETE FROM radio.countries 
WHERE country_id BETWEEN 3 AND 12000;
ANALYZE (VERBOSE) radio.countries;

And the output is here:

analyzing "radio.countries"

"countries": scanned 81 of 81 pages, containing 3004 live rows and 11998 dead rows; 3004 rows in sample, 3004 estimated total rows

You can see that it’s now scanned a smaller set of rows to arrive at a new set of statistics and a new histogram. You can also see the deleted rows in the output. I ran this separately so that it didn’t do both a VACUUM and ANALYZE. This is how you can break these things down and take more direct control.

I’ve hinted at it several times throughout the article. There is an automatic VACUUM process that we need to discuss, the autovacuum deamon.

Autovacuum

Enabled by default, there is a deamon process within PostgreSQL that will automatically run both VACUUM and ANALYZE on the databases on your system completely automatically. The process is pretty sophisticated and highly customizable, so you can make a lot of changes to the base behavior.

Basically, autovacuum runs against every database on the server. The default number of threads that can be operating at the same time is 3, set through autovacuum_max_workers, which you can configure. It launches every 60 second by default through the autovacuum_naptime value, also configurable. You’re going to see a pattern, most of the settings can be configured.

Then, there’s a threshold to determine if a given table will go through the VACUUM and ANALYZE processes. VACUUM has to exceed the autovacuum_vacuum_threshold value, the default of which is 50 tuples, or rows. It’s a little more complicated than that because there’s a calculation involving the autovacuum_vacuum_insert_threshold, which has a default of 1,000 tuples, which is then added to the autovacuum_vacuum_insert_scale_factor, by default, 20% of the rows of a given table. This value is then multiplied by the number of tuples in the table. All of that lets us know which tables will get the VACUUM process run against them. ou can see the formula laid out here in the documentation.

ANALYZE is similar. The autovacuum_analyze_threshold, 50 tuples by default, is calculated against the autovacuum_analyze_scale_factor, 10% of the table, and the number of tuples to arrive at the analyze threshold value.

All of these settings can be controlled at the server level, or, at the table level, allowing a high degree of control over exactly how both your automatic VACUUM and your automatic ANALYZE operate. You may find, similar to statistics updates in SQL Server, that the automated processes need to be either adjusted, or augmented with the occasional manual update. As stated earlier, statistics in PostgreSQL provide the same kind of information to the optimizer as they do in SQL Server, so getting them as right as possible is quite important.

Conclusion

As I said at the beginning, the VACUUM process is a very large, involved, topic. I’ve only scratched the surface with this introduction. However, the basics are there. We have an automatic, or manual, process that cleans out deleted tuples. Then, we have an automatic, or manual, process ensuring that our statistics are up to date. While taking control of these processes and adjusting the automated behaviors, or running them manually is relatively straightforward, knowing when and where to make those adjustments is a whole different level of knowledge.


The post Learning PostgreSQL With Grant: Introducing VACUUM appeared first on Simple Talk.


from Simple Talk https://ift.tt/Ry70oNP
via

Thursday, August 17, 2023

AWS Step Functions in C#

Step functions allow complex solutions to process data in the background. This frees users from having to wait on the results while it is running. Imagine a use case where someone uploads a resume because sifting through resumes takes time, a background process can curate the data and have it ready for a recruiter. In this take, I will explore AWS step functions and show how they enable asynchronous processes without blocking. Apps, for example, are expected to show results within milliseconds. If a job takes longer than a few seconds, a nice approach is to run this asynchronously so it doesn’t block and force people to wait.

The sample code has a resume uploader built with step functions. Each lambda function represents a step in the workflow. Then, results are placed in a SQS queue for asynchronous consumption. To keep the sample code simple, the emphasis will be entirely on the asynchronous process because it is the core of a much larger solution.

Getting Started with Step Functions

To get started, you are going to need two things: .NET 6 SDK, and the AWS CLI tool. Instructions on how to set these up is beyond the scope of this article but you will find a lot of resources available. The sample code is also available on GitHub, so feel free to clone this, or simply follow along.

Next, set up the global AWS dotnet tool from AWS. This has the templates and commands necessary so you can use the dev tools available in .NET.

> dotnet tool install -g Amazon.Lambda.Tools
> dotnet new -i Amazon.Lambda.Templates

Then, spin up a new solution folder and solution projects.

> mkdir net-aws-step-functions
> cd net-aws-step-functions
> dotnet new serverless.StepFunctionsHelloWorld --region us-east-1 --name Aws.StepFunctions.ResumeUploader

The template names read like run-on sentences so double check that it is in the serverless template. The one with StepFunctions in the name is the one you should choose. Pick the correct region, my region happens to be us-east-1, but yours might differ. Because the template scaffold is a little bit silly, I recommend flattening the folders a bit. This is what the folder structure looks like:

Graphical user interface, text, application, email Description automatically generated

Figure 1. Folder structure

Be sure to rename the main files to LambdaFunctions and LambdaFunctionsTests. The State class has been renamed to StepFunctionState for readability. Also, double check the test project references the correct path for the main project and uses LambdaFunctions, which is the system under test. With both the test and main project in place, create a new solution file.

> dotnet new sln --name Aws.StepFunctions
> dotnet sln add Aws.StepFunctions.ResumeUploader\Aws.StepFunctions.ResumeUploader.csproj
> dotnet sln add Aws.StepFunctions.ResumeUploader.Tests\Aws.StepFunctions.ResumeUploader.Tests.csproj

The solution file is mainly so the entire project is accessible via Rider, Visual Studio, or the dotnet CLI tool. Feel free to poke around the project files. Note the project type is set to Lambda, which is not your typical dotnet project.

The files generated by the scaffold might seem overwhelming, but here is a quick breakdown of what each one is meant for:

  • aws-lambda-tools.defauls.json: provides default values for the deployment wizard
  • LambdaFunctions.cs: main code file
  • StepFunctionState.cs: state object
  • serverless.template: AWS CloudFormation template file (optional, not in use)
  • state-machine.json: workflow definition for the state machine
  • LambdaFunctionsTests.cs: unit tests for TDD

Build the Step Functions

Step functions execute a workflow that gets captured in the state object. Crack open StepFunctionState.cs and define what properties the state must capture. As each step completes its own asynchronous task, the state is the one that gets the results.

public class StepFunctionState
{
  public string FileName { get; set; } = string.Empty;
  public string StoredFileUrl { get; set; } = string.Empty;
  public string? GithubProfileUrl { get; set; }
}

In the LambdaFuntions.cs file, gut everything inside the class itself and put in place this code.

public class LambdaFunctions
{
  private readonly IAmazonS3 _s3Client;
  private readonly IAmazonTextract _textractClient;

  private const string S3BucketName = "resume-uploader-upload";

  public LambdaFunctions()
  {
    // double check regions
    _s3Client = new AmazonS3Client(RegionEndpoint.USEast1); 
    _textractClient = new AmazonTextractClient(RegionEndpoint.USEast1);
  }

  // secondary constructor
  public LambdaFunctions(IAmazonS3 s3Client, IAmazonTextract textractClient)
  {
    _s3Client = s3Client;
    _textractClient = textractClient;
  }

  public Task<StepFunctionState> UploadResume(
    StepFunctionState state,
    ILambdaContext context)
  {
    throw new NotImplementedException();
  }

  public Task<StepFunctionState> LookForGithubProfile(
    StepFunctionState state,
    ILambdaContext context)
  {
    throw new NotImplementedException();
  }

  public Task<StepFunctionState> OnFailedToUpload(
    StepFunctionState state,
    ILambdaContext context)
  {
    throw new NotImplementedException();
  }
}

The compiler should start complaining because IAmazonS3 and IAmazonTextract are missing. Go to the NuGet package manager and install AWSSDK.S3 and AWSSDK.Textract. For now, ignore compiler errors in the unit tests because this gets tackled next. Again, make sure the regions are set correctly so you can connect to the AWS services.

Step functions do not have the IoC container typically found in .NET Core projects. This is why the constructor has poor man’s dependency injection. The default constructor is for AWS, so it can initiate the workflow. The secondary constructor is for you and me, so we can write unit tests.

To practice Test-Driven-Development (TDD), simply write the unit test first, then the implementation. This helps you think about the design, and best practices before you flesh out the code itself.

In the LambdaFunctionsTests.cs file, gut everything in the class and write the unit test for UploadResume.

public class LambdaFunctionsTests
{
  private readonly Mock<IAmazonS3> _s3Client;
  private readonly Mock<IAmazonTextract> _textractClient;

  private readonly TestLambdaContext _context;
  private readonly LambdaFunctions _functions;

  private StepFunctionState _state;

  public LambdaFunctionsTests()
  {
    _s3Client = new Mock<IAmazonS3>();
    _textractClient = new Mock<IAmazonTextract>();
    _context = new TestLambdaContext();

    _state = new StepFunctionState
    {
      FileName = "-- uploaded resume --"
    };

    _functions = new LambdaFunctions(_s3Client.Object, _textractClient.Object);
  }

  [Fact]
  public async Task UploadResume()
  {
    // arrange
    _s3Client
      .Setup(m => m.GetPreSignedURL(It.IsAny<GetPreSignedUrlRequest>()))
      .Returns("-- upload url --");

    // act
    _state = await _functions.UploadResume(_state, _context);

    // assert
    Assert.Equal("-- upload url --", _state.StoredFileUrl);
  }
}

If the compiler complains about Mock missing, add Moq as a test project dependency in the NuGet package manager. Following the TDD red-green-refactor technique, write the UploadResume implementation to pass the test.

public Task<StepFunctionState> UploadResume(
  StepFunctionState state,
  ILambdaContext context)
{
  state.StoredFileUrl = _s3Client.GetPreSignedURL(new GetPreSignedUrlRequest
  {
    BucketName = S3BucketName,
    Key = state.FileName,
    Expires = DateTime.UtcNow.AddDays(1)
  });

  return Task.FromResult(state);
}

Note how every step in the workflow mutates the state object. Then, it returns the state, which can be asserted in the unit test. This is how step functions keep track of state as it makes its way through the workflow. Think of step functions as a state machine because the entire workflow is built around a state object like StepFunctionsState and each step fires independently via an event.

Next, flesh out LookForGithubProfile, I will spare you the details from the unit tests since they are already available in the GitHub repo. However, I do encourage you to write those yourself as an exercise to practice clean code.

public async Task<StepFunctionState> LookForGithubProfile(
  StepFunctionState state,
  ILambdaContext context)
{
  var detectResponse = await _textractClient.DetectDocumentTextAsync(
    new DetectDocumentTextRequest
    {
      Document = new Document
      {
        S3Object = new S3Object
        {
          Bucket = S3BucketName,
          Name = state.FileName
        }
      }
    });

  state.GithubProfileUrl = detectResponse
    .Blocks
    .FirstOrDefault(x =>
      x.BlockType == BlockType.WORD && x.Text.Contains("github.com"))
      ?.Text;

  return state;
}

The S3Object belongs in the Amazon.Textract.Model namespace. This step function uses Textract which is one of the many machine learning services offered by AWS. It is capable of processing text inside a PDF file with a few lines of code. Here, the service looks for the candidate’s GitHub profile in the resume and sets it in the state.

Lastly, put in place an error handler in case something goes wrong during the upload process.

public Task<StepFunctionState> OnFailedToUpload(
  StepFunctionState state,
  ILambdaContext context)
{
  LambdaLogger.Log("A PDF resume upload to S3 Failed!");

  return Task.FromResult(state);
}

With the step functions taking shape, time to deploy this to AWS.

Deploy the Step Functions

Use the dotnet CLI tool to deploy the three step functions:

> dotnet lambda deploy-function --function-name upload-resume-step --function-handler Aws.StepFunctions.ResumeUploader::Aws.StepFunctions.ResumeUploader.LambdaFunctions::UploadResume
> dotnet lambda deploy-function --function-name look-for-github-profile-step --function-handler Aws.StepFunctions.ResumeUploader::Aws.StepFunctions.ResumeUploader.LambdaFunctions::LookForGithubProfile
> dotnet lambda deploy-function --function-name on-failed-to-upload-step --function-handler Aws.StepFunctions.ResumeUploader::Aws.StepFunctions.ResumeUploader.LambdaFunctions::OnFailedToUpload

If you get lost, use the serverless.template file found on the GitHub repo as a reference. The tool will ask for a runtime, be sure to specify dotnet6. Allocate 2048 MB of memory and set the timeout to 5 seconds.

When prompted for a role, simply ask to create a new role, name it resume-uploader-executor, and do not grant any permissions yet.

Double check the step functions have been deployed successfully by login into AWS and checking the lambda functions. It should look something like Figure 2.

Table Description automatically generated

Figure 2. Step functions

Also, if you poke around each function, double check memory allocation, role assigned, and timeout.

Next, create the state machine. This is where the state-machine.json file with the workflow definition comes in handy. The Step Functions service in AWS has a tool to create the workflow visually. I recommend downloading the workflow definition from my GitHub repo then creating the workflow using the JSON file. The one gotcha is to verify you have the correct ARNs for the lambda functions because the workflow needs to know what to execute.

To create a state machine in AWS, follow these steps:

  • click on Step Functions
  • on the hamburger on the left, click on State machines
  • click on Create state machine
  • choose Design your workflow visually
  • pick the Express type
  • click on Import/Export, then Import definition
  • choose the state-machine.json file, then click Import

Note the ARN values are missing in the state machine JSON file. Grab those from your lambda functions and place them in the workflow definition. Be sure to specify the SQS queue URL as well at the end of the workflow.

Specify a name for the state machine, like ResumeUploaderStateMachine. Create a new role for this workflow and create a new log group with a name like ResumeUploaderStateMachine-Logs.

If everything went well, you should see a nice visual of the workflow like the one in Figure 3.

Diagram Description automatically generated

Figure 3. State machine workflow

Lastly, you need an SQS queue URL. Go to Simple Queue Service, click on Create queue then use all the default values. Be sure to give it a name, once the queue gets created it should have a URL available to put in the workflow definition.

This entire state machine is meant to be asynchronous. Meaning it is event driven by a user’s interaction within the system. AWS has S3 which is a Simple Storage Service where one can upload resumes, and this is what I will look at next.

Executing Step Functions

Unfortunately, AWS does not allow firing an S3 event that executes step functions automatically. There is a workaround via a lambda function that starts the execution, but this feels hacky. The hope is that in future releases step functions are treated like first-class events in AWS.

In the meantime, create an S3 bucket that will have all the uploaded resumes. In AWS, go to S3, click on Create bucket, and give it a unique name. The step functions code shown earlier expects the bucket name to be resume-uploader-upload, but yours can be different, just double check the code knows where to find the bucket. There is a sample resume in the GitHub repo you can upload, or you can create your own, simply pick a name like ExampleResume.pdf.

Now, to simulate an event that starts the workflow, use the AWS CLI tool to run the step functions:

> aws stepfunctions start-execution --state-machine-arn <arn> --input "{\"FileName\":\"ExampleResume.pdf\"}"

Be sure to put the correct state machine ARN found in AWS. Step functions are asynchronous and event-driven so remember the output does not wait on execution to finish. This command simply says the workflow has begun and returns a timestamp without any further insight.

Note the input parameter in the AWS CLI tool. This specifies the initial state of the state machine that gets fed into the first step that runs in the workflow.

Go to Step Functions in AWS, right next to the Name column there is a Logs column you can click on. This opens CloudWatch with log streams so you can keep track of progress.

In the logs, you can see there is a LambdaFunctionFailed entry with a helpful error message: AccessDeniedException. This is happening because the individual lambda functions in the workflow do not have proper access.

To address this issue, go to IAM and click on the resume-uploader-executor role. Add the following two permissions:

Graphical user interface, application Description automatically generated

Figure 4. Role permissions

When troubleshooting step functions, a common cause for the workflow not working properly is due to lack of access. Once the permissions get applied, run the step functions again, and check the logs. This is the dev flow in step functions, everything is an event, so you must keep track of the logs to see what is happening.

Note each log entry has a type like LambdaFunctionScheduled, LambdaFunctionStarted, and LambdaFunctionSucceeded. This communicates that each step is treated like an asynchronous event in AWS. The only interdependency between events is the state which gets passed around in the workflow.

Lastly, check the SQS queue for the final output of the step functions. Be sure to nab the queue URL from the state machine definition and fire up the AWS CLI tool.

> aws sqs receive-message --queue-url <queue-url>

Because the result is in AWS, you can also inspect the queue visually. Click on the queue name, Send and receive messages, then Poll for messages.

Graphical user interface, application, Teams Description automatically generated

Figure 5. SQS polled messages

This message queue now has the processed resume data, which can be shown immediately to an actual user.

Conclusion

Step functions offer an exciting new way of working with asynchronous workflows. Everything in the workflow is an event and models the real world more closely. This way, the customer doesn’t have to wait on results and can simply get them when they are ready. Next, I can tackle starting the workflow via an AWS S3 event and wrapping all this complexity around a nice API interface.

The post AWS Step Functions in C# appeared first on Simple Talk.


from Simple Talk https://ift.tt/AMwkVP2
via

Wednesday, August 16, 2023

How much has data technology changed over the years?

The simple answer to this question is “a lot.” The funny part, however, is that everyone who reads that question will have similar but very different thoughts on those changes.

Unless your job (or hobby) is keeping up with the current trends in technology, the biggest thing that affects our perception is how we have done ourselves. Even for those of us who have always tried to keep up, where we started and where we currently are taints our perceptions of what is happening in the world.

In this article, I will share a little bit of my past and present, and how that has shaped my perception of change, then ask you about how you see your world changing.

Starting Point

When I started my first job in database technology, the database server was room sized. And not a small room either. The Brady Bunch and Partridge Family could have all shared this room (reference intended to tell my age without telling my age). I didn’t do much with the server. It was an IBM mainframe and I mostly just had to occasionally change a few of the big drum-looking tapes for backups. I just remember it was huge and wildly expensive, like $15,000 a month.

Not long after that, I and a coworker attended a conference where we heard of SQL Server. This was still in its infancy and ran on OS/2 (our computers used Windows 3 at the time), but long story short, it didn’t cost one-tenth as much as the mainframe.

After the programmer who was writing the T-SQL code left, I did the rest of that work (and I was hooked). This server sat in a broom closet-sized area and did most of the work they used the mainframe for. A few more computers were employed for the other tasks. Still, nothing that needed a room-sized computer even in the 1990s, so loads of money was saved.

Current point of reference

In 30 years, the world changed so much. Instead of mainframes, we built virtual machine hosts. Virtualization explodes the number of “servers” on one physical host, so you feel like you have your own machine (much like a mainframe, but a lot more user-friendly). On these multi-purpose servers, both on-premises and in the cloud, are various applications that often use different services and even other database platforms.

At my last company, we typically had one main platform of SQL Server on Windows. Still, there were instances of different platforms for different purposes. Some on-prem, some in the cloud. Some on Windows, some on Unix. If you said SQL Server would run on some other OS 10 years ago, you would be laughed at.

What About You?

I would love to hear your origin story in the comments section, even just hearing stories of how you don’t even know what a mainframe is will be awesome. How does that compare to your current situation? Are you one of those people who started with SQL Server 2016 and are just now allowed to start looking at SQL Server 2017?

Want to see how your experiences compare with others? Take part in Redgate’s:

State of the Database Landscape Survey

If you take part in the survey, you will be amongst the first people to get access to the results. Don’t take too long to decide, the survey runs until the end of September, and we anticipate publishing the results in January.

The post How much has data technology changed over the years? appeared first on Simple Talk.


from Simple Talk https://ift.tt/MYyI5TO
via

Monday, August 14, 2023

Discover the Microsoft Fabric Data Wrangler

The Data Wrangler is as interesting as hidden inside Microsoft Fabric. It’s not easy to find and activate it, but it is worth the trouble.

Before digging into the Data Wrangler, let’s analyze the data features in the query environment.

Data Features in Query Environment

The new query environment, which allow us to make data exploration with visual queries and SQL queries, is available with many Power BI features:

  • Datamarts
  • lake house
  • Data Warehouse

And probably more to come if I’m not missing some of them already.

Why are we starting on the Query Environment? Because the Query Environment has some similar features to the Data Wrangler. Let’s discover them first and compare with the features on the Data Wrangler.

This example starts on a SQL Endpoint of a lake house.

  1. Create a Visual Query.

A close up of words Description automatically generated


  1. Drop the table Fact_Sales to the Visual Query

A screenshot of a computer Description automatically generated

  1. On the top menu, on the Settings button, the Data View item has some interesting features for us to investigate. Let’s analyze them one by one. Description automatically generated”


"A

Enable Column Profile

When we enable this option, a subtle green line appears on the Display Area, just below the title. If we hover this green line on a specific column, we find information about the data quality of the rows on that column.

The information tells us how many rows have valid values, error values and empty values for the column.

A screenshot of a computer program Description automatically generated


Show Column Quality Details

Enabling this option expands the green line. The information about data quality which was only visible when hovering a column becomes visible in the expanded panel.

A screenshot of a computer Description automatically generated


Show Value Distribution

This option adds to the panel information about the distribution of unique values in the column. It points to us how many distinct and unique values each column has.

A screenshot of a computer Description automatically generated


This information may be very useful to identify primary keys in sets of data you don’t know.


Data Wrangler

The Data Wrangler has similar information to the ones we just found on the Query Environment. However, while the query environment works in a visual environment, the data wrangler works on python notebooks.

Two additional details it worth mentioning: The Data Wrangler has more features, linked to spark notebooks and it’s difficult to locate if you don’t know exactly where to look.

Opening the Data Wrangler

The secret to opening the data wrangler is simple after you discover it: The Data Wrangler requires a Pandas data frame. Once we have a notebook opened and a Pandas dataframe loaded into a variable, the Data Wrangler becomes available.

As an example, we will use the same lake house as the previous example.

Let’s follow these steps:

  1. Click the Experience button and select the Data Engineering experience.

A screen shot of a computer Description automatically generated


  1. Click the button New Notebook on the Data Engineering experience.

A screenshot of a computer Description automatically generated


  1. On the top left, change the notebook name to WranglerTest

A screenshot of a computer Description automatically generated


  1. On the left, click the Add button to link the notebook with the lake house.

A screenshot of a computer Description automatically generated


  1. On the Add lakehouse window, select the Existing lakehouse option.

A screenshot of a computer Description automatically generated


  1. Choose your lakehouse and click the Add button.

A screenshot of a computer Description automatically generated


  1. Drag and drop the dimension_customer table to the code block in the notebook.

The code to load the table is automatically created. Did you know this one?

A screenshot of a computer Description automatically generated


A screenshot of a computer program Description automatically generated


  1. Remove the Display line in the code. It’s not needed.
  2. Add toPandas() at the end of Spark.sql

A screenshot of a computer Description automatically generated


  1. Execute the code block.

We will receive an error message and it explains the problem. Pandas, in the lake house environment, always try to make an optimization called Arrow optimization by default. This optimization may not work well with some fields, so we need to disable it.


  • Add the following line to the start of the code:

spark.conf.set('spark.sql.execution.arrow.pyspark.enabled', 'false')
  1. Run the code block again.

The Arrow optimization is disabled but the datetime field still causes problems. To make it easier, let’s remove the datetime field from the query.


  1. Change the SQL query in the code to the following:
SELECT customerkey,
       wwicustomerid,
       billtocustomer,
       category,
       buyinggroup,
       primarycontact,
       postalcode
FROM   demolake.dimension_customer
LIMIT  1000 
  1. Execute the code block again.

A white card with black text Description automatically generated


  1. On the top menu, click Data menu item.
  2. Click the Launch Data Wrangler button.

The variable created on the code block is identified and appears on the menu.

A screenshot of a computer Description automatically generated


  1. Click the variable name on the menu. The Data Wrangler will appear.

A screenshot of a computer Description automatically generated


Data Wrangler: First Impressions

The initial Data Wrangler window seems like the information we have in the query environment. It seems to have some additional details about the data distribution, in some cases, making it more visible when there are only a few unique values.


If your purpose is only to see this additional information about the columns, both Data Wrangler and the query environment, work. It becomes a matter of preference which one you should use and for sure you will choose according to your preferred environment: If you prefer to work visually, the query environment will be better, if you prefer to work with spark, Data Wrangler will be better.

However, Data Wrangler can achieve much more. It can accept transformations over the data frame and implement these transformations as pyspark code.

In fact, the UI is slightly like Power Query.


Transformations with Data Wrangler

Let’s implement some transformations over the data frame and check the result.

  1. Click the Expand button (“…”) beside the BillToCustomer field.

A screenshot of a computer Description automatically generated


  1. Select the Filter option on the menu.
  2. On the left side, on the dropdown Select a Condition, select the option Starts With

A screenshot of a computer screen Description automatically generated


  1. On the 3rd textbox, type WingTip

A screenshot of a computer Description automatically generated


  1. Click the Apply button.

Mind the Cleaning steps, registering the transformations.

A screenshot of a computer Description automatically generated


  1. Click the Expand button (“…”) beside the PostalCode field.
  2. Select the Drop Columns option on the menu.

A screenshot of a computer Description automatically generated


  1. Click the Apply button.

A screenshot of a computer Description automatically generated

  1. On the top menu, click the Add code to notebook button.

A screenshot of a computer Description automatically generated


The transformations created visually are included in the notebook as part of the code.

A screenshot of a computer code Description automatically generated


Summary

The Data Wrangler is a powerful tool not only to help data exploration but also to help building pyspark code using visual methods.


The post Discover the Microsoft Fabric Data Wrangler appeared first on Simple Talk.


from Simple Talk https://ift.tt/1T9EvA3
via