Wednesday, November 29, 2023

Microsoft Fabric: Extended Source Control Features

The source control features in Microsoft Fabric are evolving every day.

The PBIP feature included in Power BI allowed us to include source control on a SDLC process for Power BI, supporting reports and datasets linked directly from the portal to a repository.

The New Source Control Features

Recently, without much news, Microsoft extended the source control to support Notebooks, Lakehouses and the default dataset for the lakehouses.

The first detail we may notice is the change on the Git Status column on a Power BI workspace.

A screenshot of a computer Description automatically generated

The Lakehouse and the Notebook appear with the uncommitted, meaning the source control supports them, but they are not inserted there yet.

Adding the New Objects to the Source Control Repository

The source control button will show the number of uncommitted objects we have. The image below is only an example.

Once we click the button, the Source Control window will show the objects we can commit to the repository: the lakehouse and notebook. We only need to click the Commit button.

A screenshot of a computer Description automatically generated

A screenshot of a computer Description automatically generated

The status of the objects will be changed to Synced, like on the images below.

A screenshot of a computer Description automatically generated

The objects on DevOps

Let’s take one more step and look at the objects on Azure DevOps.

One folder will be created for each notebook and each lakehouse. The image below shows how the folders look like.

A screenshot of a computer Description automatically generated

Both folders contain the files item.config.json and item.metadata.json . Power BI uses these two files to identify the folder as a single object in its environment.

The notebook is stored as a .py file. This may be a surprise, you may expect the format .ipynb.

A screenshot of a computer Description automatically generated

The .py file contains metadata with the information about each code block in the notebook. In this way, Power BI can reconstruct all code blocks exactly as they were from the content of the .py file.

A screenshot of a computer Description automatically generated

The SQL Endpoint Dylema

Every lakehouse has a SQL Endpoint. The SQL Endpoint is not supported yet on the Source Control, as you may notice on the image below.

A screenshot of a computer Description automatically generated

Power BI allows us to change the current branch of the workspace using Workspace Settings -> GIT Integration.

A screenshot of a computer Description automatically generated

However, if you try to change the branch to a branch where the lakehouse is not present, you will receive an error. This happens because the SQL Endpoint is not affected by the branch change and it would always be present, but you can’t break the relationship between the SQL Endpoint and the lakehouse.

A screenshot of a computer Description automatically generated

The result: Once the lakehouse is inserted into the repository, it’s not possible to change to a different existing branch. Changing to any branch without the lakehouse will result on the above error.

Creating a new branch from the current one, on the other hand, is still possible. This happens because the lakehouse and SQL Endpoint will continue to be together.

A screenshot of a checkout branch Description automatically generated

Summary

It’s great to see the source control in Microsoft Fabric evolving. It still has a long way to go. Meanwhile, it created a new limitation. But we are getting there.


The post Microsoft Fabric: Extended Source Control Features appeared first on Simple Talk.


from Simple Talk https://ift.tt/Swg3WVF
via

Monday, November 27, 2023

When an update doesn’t update

Tell me if you’ve heard this one before:

I changed data from my application, but when I checked the database, I couldn’t see the change!

I’ve seen this. Loads. It can be quite perplexing for folks because they expect to see an error message if the insert, update, or delete failed. I put this post together to provide some things you can investigate if this happens to you – you are sure that you updated the data, but when you check using SQL Server Management Studio (SSMS), your change isn’t there. For the remainder of the post, I’m going to use the word “update” to mean any change to the data, even MERGE {shudder}.

The causes behind this issue can usually be lumped into three categories:

1. Misdirection

Most commonly, the problem is that app is updating a table that is in a different location than the one you’re checking. Some examples of things you should verify:

  • That the connections for the application and SSMS:
    • Point to the same server/instance – LOCALHOST and LOCALHOST\SQLEXPRESS are not the same, and if the app is running on a different machine or a different domain, it may not be safe to trust identical DNS.
    • Point to the same database – in many cases we might have the same table in multiple databases, even on the same server.
    • Use the same authentication method and credentials – since the user’s default schema or the login’s default database might point you in different directions.
    • Do not use the dreaded User Instances or AttachDbFileName features, since even if all the other connection string attributes are the same, you are definitely looking at two independent copies of the database.
  • That both the update query and the validation query:
    • Explicitly use schema references for all objects.
    • Do not inject database, server, or table names based on criteria that may differ.
  • That there isn’t some background job that runs and cleans up data it deems non-compliant for whatever reason.
  • That you’re not assuming some large value has been corrupted because SSMS doesn’t show the whole value. In different contexts, it may only show 256, 8,192, 43,697, or 65,535 characters. This is usually not a problem with the data or the operation but rather just the way the tool presents data. You can check with DATALENGTH that all of the data is there, or RIGHT to verify that the end of the string is intact. See Validate the contents of large dynamic SQL strings for more information, and have a generous look around the maximum characters settings in Tools > Options > Query Results > SQL Server > Results to Grid (max 64K) | Results to Text (max 8K).

2. It’s not always caching…

…but, sometimes, it’s caching. Check if any of the following could be true:

  • You’re querying from a readable secondary or replication subscriber, and the change just hasn’t made it there yet.
  • You’re using snapshot or NOLOCK and are seeing an earlier (or perhaps even invalid) version of the row.
  • You’re not using SSMS to verify. Another application (even the same application!) might display cached results (even data it just updated!). Make sure you have a way to bust the cache and force the application to reload data from the source, and if the source is a secondary of any kind, that you’ve waited long enough.

3. Swallowed exceptions

Sometimes the issue is that we assume the statement succeeded simply because we didn’t see an error message. This is not always a safe assumption! Not all errors bubble up to the caller, for example:

  • If the query sent to SQL Server actually went through an intermediary, like an API or middle tier, it may not expose exceptions by default.
  • If the query is executed asynchronously, the caller may never see the exception, and doesn’t wait for success or failure. The update may have still been happening when you checked and, in the event of blocking, may still be blocked as you are reading this.
  • There may be a trigger that rolled it back (and the application ignored the exception), or an INSTEAD OF trigger that simply didn’t end up performing the update, in which case the application wouldn’t even have an exception to ignore.
  • You may have TRY/CATCH or other error handling / rollback mechanisms in your code (in the query or in the application). CATCH could easily be ignoring the exception or raising a generic exception of a lower severity, or a rollback could be happening without raising any exceptions.
  • At an even more basic level, your code or procedure may have a debug or auto-rollback flag inadvertently set to true.

Conclusion

There are many reasons why it may seem like an update succeeded, but validation suggests it didn’t. Usually it is the case that either you weren’t checking the right place, you checked too quickly, or there was a failure. Hopefully the above gives a healthy set of things to check if you are ever in this scenario.

The post When an update doesn’t update appeared first on Simple Talk.


from Simple Talk https://ift.tt/SBbId9M
via

Warehouse Load Patterns – Part 1 – Requirements and General Patterns

No matter the ETL tool used, there are some basic patterns to follow when transferring data between systems. There are many data tools and platforms, but the basic patterns remain the same. This focuses on SQL Server, but most of these methods work in any data platform. Even if you are using a virtualization layer, you likely need to prepare the data before exposing it to that engine, which means ETL and data transfers.

Warehouse is very loosely a data warehouse, but the same process applies to other systems. This includes virtualization layers, and to a smaller degree, bulk transfers between transactional systems.

The concept is simple. You want to move data from here to there with the best performance possible, in the least amount of time, with the smallest impact to all systems involved. Consistency and careful planning are required to ensure the process works smoothly. Systems and data are unpredictable. Planning and working closely with the business help make the process more predictable and consequently more reliable.

This also assumes that basic diligence has been performed and other methods aren’t used in the enterprise to access data. Those methods might be a read-only replica, a virtualization layer such as PolyBase, or a vendor specific method. Moving data incurs a cost, even with a seasoned data team and excellent methodology and standards. Spending the time at the beginning of the process is worth the effort, even if you think you understand all aspects involved with the current data story.

This article covers requirements for starting a data story. You won’t need to cover all of these items for each data story when the same systems are involved, but you will need to be sure you understand these requirements. General patterns that can apply to all ETL are covered at the end of this section. The next article covers ETL patterns, use cases for each, and potential gaps.

Requirements / prerequisites

Before a decision can be made for the warehouse load pattern, you must understand the systems involved. It is not possible to make a good decision without understanding the source system, security, business or vendor limitations, and the destination system. Enterprise systems generally involve more than one source, but they must each be considered and analyzed individually.

Much of this falls into the category of basic data project planning. There are some unique considerations for determining the correct load patterns you will use compared to your project planning. This is the detailed section of your project plan. As you go through this the first few times, patterns should emerge. It is extremely helpful to create a template to capture requirements. Even if you don’t need all sections for the current data story or project, confirming these items is crucial. You don’t want to be surprised by a new requirement during user acceptance testing (UAT).

Use cases

The business reason / use cases must be defined, even for simple data stories. This may seem like an unimportant detail for a purely technical implementation, but it is critical to understanding how data loads can work. Defining the use cases will drive out high-level, but crucial, aspects of your process. Things like performance expectations, data latency, service level agreement (SLA), disaster recovery requirements, and security will all rely heavily on the business analysis.

Having the use case also helps you evaluate if the data really should be transferred between systems. If the users want a live view of the data, they may just need a new screen in a transactional system. You won’t be able to make that evaluation without the use cases.

Enterprise standards

The impact of enterprise standards on your ETL strategy is direct. Existing standards will generally limit your options more than anything else. But standards are also an opportunity to build on existing patterns and start your project quickly and efficiently.

Naming standards, coding standards, design patterns, acceptable tools, and deployment methodology all fall under enterprise standards. If your organization is small or doesn’t have standards for any of the above, this is another opportunity to create and set the standards. The goal for a project should be that the code and objects all look like they were created by a single developer. This is a virtually impossible standard in large projects, but it’s a good objective.

The actual naming standards aren’t as important as having a set of standards and sticking to them as much as possible. I have very strong opinions about how objects should be named but the best standards are the ones that are followed by the team. If the enterprise or project naming standards are already set, it’s better to be consistent. Team members will be added and removed from teams. Following standards, even if you think they are suboptimal, makes the process easier.

Coding standards are different from naming standards because some coding methods are better than others. This is more difficult to document but there are many good guides available. There are patterns that should be followed for SQL Server that will optimize the tables and system for transactional operations, patterns for warehouse operations, indexing patterns and patterns for almost all aspects of database development. Code reviews help. Experienced team members also help, but diligence by the team is the only way to have quality code on a consistent basis.

Data governance

Data governance can vary considerably between organizations, but primary goals include ensuring data is consistent, documented, and correct. Aligning with the data governance team and the standards they set at the beginning of a project greatly reduces potential refactoring later. It also helps users in the enterprise understand and find the data quickly. It can also reduce redundancy. If there is a central team maintaining a list of data available for consumers, this can be checked before a project begins.

Seek guidance from data governance on naming standards, correct formulas and data classifications. I would also expect the data governance team to provide a method to document source and destination data sources, record column definitions, and optimally, provide data lineage. This documentation will also include business units and owners for each data source.

If a data governance team isn’t in place and there are no standards, this is the perfect time to create standards. As discussed above in enterprise standards, everything should be consistent and well documented.

Data dictionary / glossary filled

Working with the business is crucial for most successful ETL projects or even just simple stories. Knowing what is getting transferred, the columns involved in transformations, source information, destination information and any other relevant data is critical for maintenance scenarios. It also is critical for day-to-day operations with self-service data.

Ideally, the business will be responsible for the business glossary and define terms, algorithms, and even acceptable values or ranges for particular fields. Having the terms defined helps with consistency. If the business provides the definition, communication is easier since everyone is speaking the same language.

Source information

Server specifics

Source information should be well defined, at an architectural level. Detailed system, database, and table information will also be needed to choose the best pattern.

The data source must be defined to understand the capabilities of the system and the options available. This includes the database engine or system, including the installed version. This is an important detail since functionality can change between versions and even service pack levels. You have to be sure you have drivers installed, and firewall rules / NSGs are in place too. Having detailed server information is crucial for this process.

Table specifics

As with server specific information, table specific information is also required to choose the best pattern. If the table is temporal enabled or has CDC enabled, you may choose to use that in your ETL.

Also as with server specifics, the business users may not be able to give you the kind of detailed information you need. Work with the technical administrators of the source server and tables to get this detailed information. If you are able to run DMVs and query metadata for the database, this information is readily available via those methods and is easier than coordinating with other teams.

Natural key

Knowing the natural key (the columns that make a row unique) is an absolute requirement for this process. If you don’t know the columns that define the natural key, it makes it very difficult to define the load pattern.

An artificial key can be used, but you are then dependent on the source system and won’t be able to match to other systems unless they also use the same artificial key. The usual reason for an artificial key is to improve performance. But it generally should be tied to a natural key so cross-system queries will work correctly.

When a natural key, or an artificial key, are not present, then you will likely need to replace the entire dataset for each load, or compare all columns. This is not an efficient operation and should avoided at all costs.

Columns defined

Columns must be defined before the load pattern can be established. You don’t need to know every column you will transfer, but you do need to understand the essential columns. Not just the unique key, but the date columns or other columns that identify modified records are essential. You will need detailed column information for your table acceptance criteria (AC), so it needs to be defined soon after this part of the process. Detailed column information is also needed to shape the data correctly into facts and dimensions.

Related dimensions

You likely won’t have explicitly defined foreign keys in a warehouse, but there are related tables and dimensions used for lookups. This is especially important when building reports or exporting data from the warehouse. Dimensions and lookups should be defined before work begin. They will be used to filter and limit data. Related data is also used to validate data in columns and find outliers or missing data.

Load schedule and refresh rate

The schedule that the source data is refreshed (refresh rate) will help determine how frequently your ETL runs (the load schedule). The load schedule for your ETL and the refresh rate will determine certain design patterns. Specifically, it can exclude some design patterns.

The expected load schedule is a requirement for defining the ETL pattern used, especially when large datasets are involved. You may need to look at other solutions if you aren’t able to meet the required load schedule. If data is only extracted daily, but the users need live data for a safety related report, a different solution is needed.

Pattern for self-healing

Failures between systems are virtually inevitable. They should be infrequent and related to things such as password changes, network issues, or unexpected data. Some items can be anticipated, but not everything. There is a cost to coding for all potential issues, especially when the source is large and trusted.

When a data load fails, the pattern should support self-healing (fixing the missing / out-of-date data without user intervention). This is where a sliding window or flagging successfully transferred rows comes into play. The next time the ETL runs, it should catch the rows that were missed. The size of the sliding window or the amount of overlap will be determined by the stability and reliability of the systems involved. The maturity and capabilities of the maintaining team also needs to be considered.

The major downsides of a self-healing pattern are the extra overhead in development and processing time for the ETL. Both of these are obvious, but need to be explored. A simple method is a full reload on the weekend. But whatever is chosen it generally should be anti-fragile. It will often include a method for overlapping ETL from the previous pipeline. Finally, all ETL processes should recover gracefully no matter the status of the last run.

Full load / first load capability

When deciding on the overall load pattern for your new ETL process, be sure to consider the first load and the possible need for a full reload. This may be a separate process with different staging tables, or it may be a configuration-based option. A configuration-based option is nice considering that you don’t need to create extra database objects, the load path is clear, and you don’t have the redundancy of maintaining two code bases. The advantage of a separate process is simplicity. You just copy the ETL and change a few items such as source table or file and change the staging table, but as mentioned, this must be maintained and any bugs or logic changes must be updated in both ETL.

Full reloads can also be planned on a regular cadence. I have had to do this with very volatile or untrustworthy sources. This has primarily been with external sources and very dirty data with changing keys. A full reload was the only way to ensure we had the best version of the data available. If you need to do a full reload on a regular basis, consider the Minimal Downtime pattern presented at the end of this. It allows data to be used in the table the entire time new data is loaded. You may not need to copy the existing data, but the table rename and archival process can be useful.

Security items

Data compliance / restricted data

This is another area that may fall into the data governance department, it may fall under the responsibility of the business unit, or it may be controlled solely by the security department and IT. New laws and restrictions are enacted every year and they may impact your security requirements too. It is standard for the data governance team or the business to manage these requirements, but you will need to be sure your solution conforms to the new demands. The easy answer, from a compliance standpoint, is to make everything as restricted as possible. This could include encryption at the database and column level, restricting connections to the database, row level security, data masking, or using mock data for non-production environments. Any or all of these may be appropriate, but security requires balance. Each piece of added security requires additional maintenance and coordination and can degrade the user experience. For example, if you need to use mock data, it will impact the testing process, especially with external systems. This needs to be coordinated with the business and testing team. Each added piece of security will have special requirements and administration considerations.

During requirements gathering, determine what is actually required from a security perspective. Consider how these requirements interact with the ETL, final table design, testing, business acceptance, and administration. It is best to do this early in the process to minimize refactoring and also helps to ensure you don’t have security gaps during testing or the initial deployment.

Security defined and special considerations

Security can have a direct impact on your ETL pattern. The source system will dictate some of the design and available options. If security differs by account (e.g., RLS or masking is defined on the source tables), this must be accounted for in the design patterns. It will likely not impact the columns used, but it must be defined an analyzed. It also places additional burdens on the test team. The same is true for any encryption or even just data masking. If dynamic data masking is used, you will likely need a service account with permission to see the unmasked data, and then be sure masking functionality is in place in the destination system.

There are additional issues that must be taken into consideration when creating ETL solutions in an enterprise, such as firewalls and NSGs in a cloud solution. These items can be bypassed with the appropriate rules, and don’t impact the design of the ETL pattern as strongly. But you must work with the appropriate teams to get rules in place and be sure you have enough lead time for those external teams to do their work.

The type of login must also be defined and created. You should also have a plan for updating the password on a regular cadence if not using a managed identity. Refer to the Microsoft documentation on managed identities and use them if possible as they make this process much easier and nearly transparent.

Table / column provenance / lineage

Table and column lineage (or provenance) isn’t an absolute requirement for defining the ETL pattern, but it will make things much easier as you move toward a data centric business. Lineage is simply documenting the origin, transformations, and destinations for a particular piece of data. This also helps when defining how aggregates are defined. Even for single-source data it is very useful.

Documenting column lineage is easiest to do in an automated fashion. Check if your data governance team has a solution in place. It’s easier to use an existing solution than to build your own. Commercial solutions exist that will scan source systems, traverse ETL, and document destination columns as well as transformations performed. This is much easier than doing it manually. Another benefit of using an automated solution is that scans can be rerun to capture any changes. Doing this on a regular cadence ensures that you are always up-to-date with your documentation.

Transformations defined

Defining all transformations and data manipulations isn’t usually required for defining the general ETL pattern. It is necessary for each ETL story, but usually won’t impact the generic pattern used.

Delete pattern

Another prerequisite is determining if records are deleted and the pattern for deletes. If the entire dataset is loaded each time, this isn’t a concern.

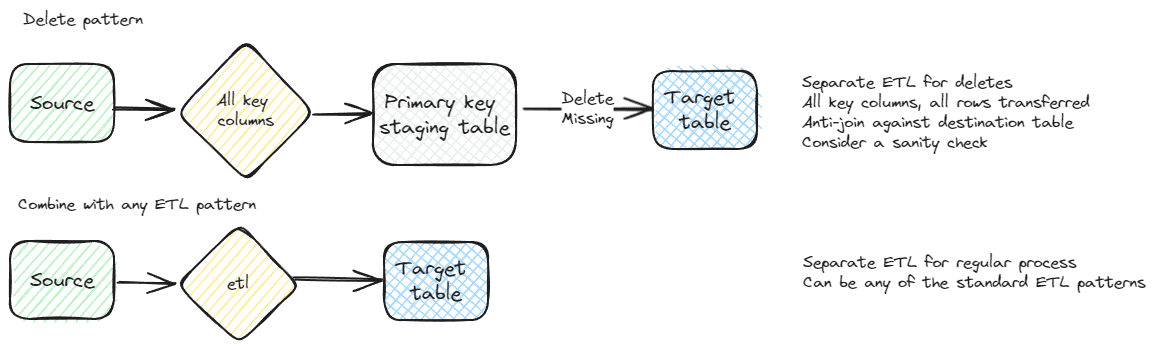
A very handy pattern for datasets with a small set of key columns is managing deletes separately from the new and modified data. All rows are sent, but only the key columns, and put into a separate staging table. This decreases the change of mistakes and missing columns to delete or deleting too many columns. The best case for this pattern is a single integer key column. Refer to the general delete pattern later in this article for a detailed explanation.

Logging

Basic logging should be part of every ETL solution. If the business or enterprise has additional requirements, they should be defined during this phase. This would include successful runs and times, failures, rows transferred, and transfer times. Logging will also help find issues with ETL packages and quality. It provides a sense of confidence in the data and processes for end users too. Trust is important for any data system. Transparency, even with errors, fosters that trust and helps ensure issues are addressed quickly. In ETL systems, many errors are due to problems in the source system. Logging errors and exposing them enables these external teams to fix errors.

Performance Requirements / NFR

Performance expectations should be gathered during this phase as well. It has a direct impact on the pattern implementation. Most patterns can be made to perform well, but some are faster than others.

The non-functional requirements (NFR) for a project can have an impact on the hardware or performance tier selected, and the ETL pattern selected. Start with a general set of requirements and adjust based on business input and requirements. This is often difficult for the business to define. Giving them a head start with a template can help. It lets the team know what type of items you expect and also acts as guiderails, keeping the NFR reasonable and possible.

Priority

I’m sure this is obvious, but priority of creating the ETL should be determined. Ideally, it will go through a review process with the business before it gets to the technical team, but that isn’t always the case. If everything is top priority, nothing is top priority and the technical team is left to decode the most important projects based on cues that may not be accurate. The loudest and most persistent requests usually get worked on first.

General Patterns

No matter the specific ETL pattern used, there are some general patterns that can enhance the process. This section covers a few of these patterns that I have found useful and can be added to most patterns.

General delete pattern – complete comparison

This is a generic delete pattern for transferring data between systems. It is presented here rather than in the next article covering specific scenarios since it can be used in conjunction with many, if not all, of the patterns.

One of the key work products created during the requirements phase is the key column or set of columns. This is the natural or artificial key used to compare rows in the source system to the destination. This key is also used for deletes. An important part of the design phase of a database project is choosing a good key. This will usually be seen in the physical design of the database as the primary key or a unique index / constraint.

The first step for this pattern is to pull all of the key columns. I generally like to put them into a staging table in the destination system, but that isn’t a requirement. This is one of the reasons why a small key helps with system design. There are additional reasons for having a small key, but it helps with ETL. I want to emphasize that with this pattern, you pull all rows every time you want to run the delete. It can be combined with additional delete strategies, but this is a good cleanup strategy.

The only step left is to delete rows in the destination that aren’t present in the source / ETL dataset. If using a staging table, it’s a simple anti-join.

--Example showing using an anti-join 
--to perform the delete
DELETE dbo.Destination
FROM dbo.Destination D
        LEFT JOIN etl.Source_Staging S
                ON D.KeyColumn  = S.KeyColumn
WHERE S.KeyColumn               IS NULL

ETL systems have functionality to perform lookup operations. If you choose to use this for your pattern, you can use the lookup on the key dataset and delete any rows in the destination not present in the lookup. It takes longer but is preferred in some settings.

Be consistent and use the same method for all ETL when you can. I prefer the staging table since it is easier to troubleshoot and it is usually much faster. The delete staging table can be used for other purposes. It is also a method to look for missing rows. In less reliable systems or quickly changing systems, this can be a good verification step. Knowing all of the rows in the source system, even without the detailed data is very useful for troubleshooting. It also is very fast. You can pull millions of rows very quickly, with very little impact to the source system.

The other strength of this pattern is that it can be run at any time. If the natural key list is up-to-date, it is safe to run and doesn’t need any complicated logic.

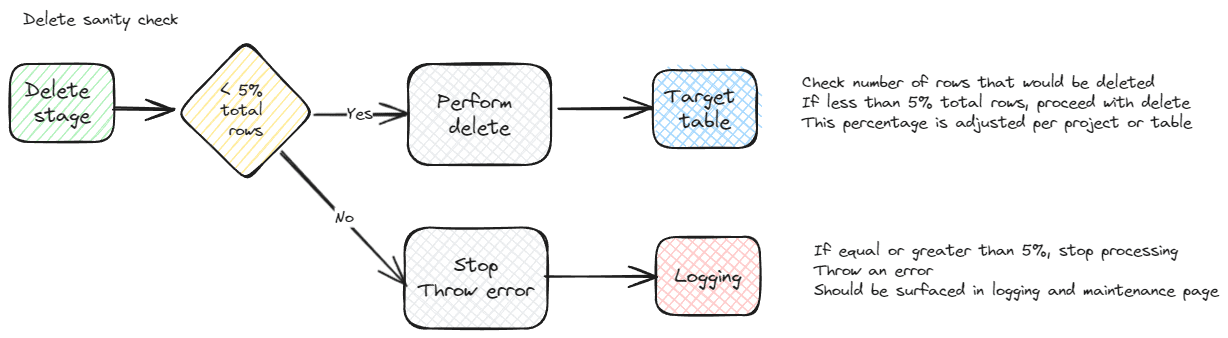
A caveat with using an anti-join for deletes, any deletes and not just this pattern, is that you must be sure the staging table or dataset populated correctly. If the table is empty, all rows in the destination system will be deleted. This can be trivial to fix or a major outage, depending on your system. It is a good idea to put a check into place before you run your delete. A sanity check can be placed on the query that ensures deletes only happen if it will impact less than X percent of rows. The elaborateness of your solution should correspond to the importance and size of the dataset.

General source view pattern

For efficient ETL, it is often best to create a view on the source system that combines tables, limits rows, and may also perform some calculations. Performing calculations at the source, especially if multiple tables and columns are required, can greatly minimize the data transferred and maintained on the destination system.

Even if transformations aren’t needed on the base data, a view layer has additional benefits. I’m a proponent of using schemas for security and organization. Creating a separate schema for each connected system makes it easier to determine the purpose of the view and provides a logical grouping. This makes it easy to see how changes will impact various groups. There can be some redundancy with this. That’s where data governance can help limit the duplication of effort.

Assigning security at a schema level simplifies design and maintenance efforts. This is a good addition to the view layer. No security is assigned directly to the views, only to the schema. Refer to my SQL Server Security Primer post for additional details about using schemas for security.

Using views in the source system also places the maintenance costs on the source system team, so consider if this fits your development pattern. This fits with a data mesh philosophy. It is typical for the developers of the source system to have a deeper understanding of the data. If these developers create the views, they will understand the nuances of the data and hopefully produce a better product.

Staging database

A staging database has several advantages over importing directly to the target table or even to a staging table in the same database. It is usually much easier to have a landing area for data when transferring between systems. This allows the initial export process to be tested before major transformations happen. It also opens the types of transformations that can be used and can improve performance of the transformations.

The staging system isn’t restricted to a database. It can also be blob storage, a data lake, file storage, or any valid landing zone. This flexibility allows you to fit it to your current standards and future, cloud standards or virtualization standards. The stating system is a location where your uncurated, raw data, is placed during your processing.

Putting unprocessed data into a separate database also helps when security is critical. Raw data won’t have the same security applied to it. Having the data in a separate, locked down, database makes it very easy to control and audit the user base for the raw data. If you are using dynamic data masking or row level security (RLS), data may need to be transformed first. Restricting the users with access to the staging database largely removes this concern.

A staging database will also have decreased backup requirements. It shouldn’t be the source of truth for any data, so the worst-case scenario is a reload from the source systems. Usually, a recent restore and re-import of the most recent ETL is all that’s needed for the staging database. You can also potentially decrease costs by putting the staging database on a lower performance tier. You will want to be sure it isn’t too much of a bottleneck though. This is a good use-case for a serverless tier, especially when imports are infrequent.

Staging schema

If a separate staging database or area isn’t possible, a staging schema is recommended to segregate data. This makes administration much easier from several perspectives.

A separate schema makes it much easier to lock down security. I like to assign security at a schema level. Having staging data in a designated schema helps ensure regular users aren’t able to access data before it has been processed. This is especially important for sensitive data. If RLS is applied to the data, it won’t be assigned to the staging schema. Not having RLS on the staging table makes ETL easier to troubleshoot. This makes it even more important to exclude general users from this schema since the raw data contains the sensitive data but is only locked down at a schema level.

Clarity of intention is always a goal of any good architecture. Having a separate staging schema helps provide that clarity. It is very easy to determine the use of the tables in the staging schema. It also makes it easier to create validation scripts when the staging data is in a separate schema.

A separate schema and tables also make some administrative tasks easier. I like to design ETL so that the staging tables can be truncated with no impact. The next time the ETL runs, the table will be populated. You also don’t need to do much index or table maintenance if the tables are getting truncated on a regular basis.

This applies to all ETL, but use caution with staging tables and ensure that multiple ETL pipelines aren’t running at the same time modifying these tables. It can result in missing rows, and extra deletes. The best-case scenario is excessive blocking, so make sure only a single ETL is hitting each staging table.

Delete sanity check

If you’ve ever worked in big data systems, you know how much processing is involved and how long it can take to scrub and prepare the data. The last thing you want to do is restore from a backup or re-run a large process. Checking the rows that will be deleted before actually running the delete, a sanity check, can help ensure data integrity. This can also be useful for smaller datasets and projects.

It’s best to tailor each sanity check to the specific dataset and parameterize the check so it can be easily adjusted as the data is better understood.

DECLARE @DeleteCheck int
 SELECT @DeleteCheck = 
        CONVERT(decimal(23,2),
                (SELECT COUNT(*)
                FROM etl.StagingSampleTable SRC
        ))
/ 
        NULLIF(CONVERT(decimal(23,2),
                (SELECT COUNT(*)
                FROM  dbo.SampleTable
        )),0) * 100.0
IF @DeleteCheck >= 95
BEGIN
        DELETE dbo.SampleTable
        FROM dbo.SampleTable ST
                LEFT JOIN etl.StagingSampleTable STS
                        ON ST.SampleTableID             = STS.SampleTableID
        WHERE STS.SampleTableID                 IS NULL
END

Minimal downtime

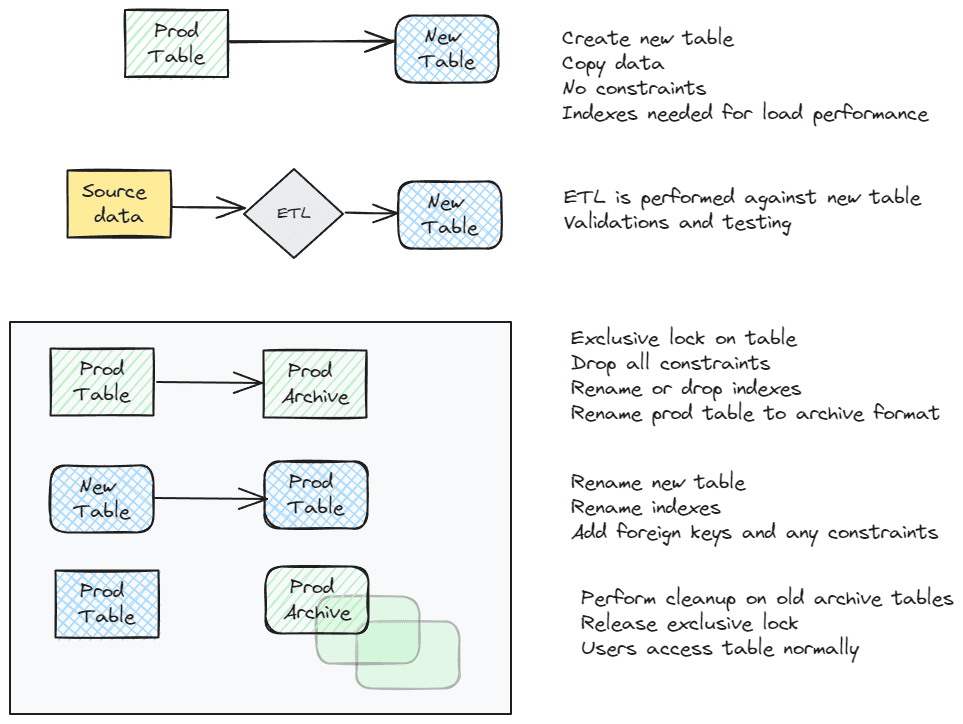
Any of the ETL patterns presented in the next section can be combined with this addition. This is a fairly standard pattern that involves virtually no downtime from a user perspective. It isn’t used for every table due to the extra work involved. It requires extra space in the database and extra processing. For large tables, this can be cumbersome, but performing the load on a copy of the table allows additional testing. For extremely complex tables, the extra overhead is well worth the trouble. If any problems are found, they aren’t introduced into your production environment. For extremely large tables, it is a nice safety net.

This is also the method I use to maintain history tables if not using SQL temporal tables. It doesn’t show each individual change, instead it shows the state of the table at a given point in time. This is easier for some teams. Dropping the old tables is also a fast process.

If you do use this method, be sure to consider security. If you need RLS on the table, it may not be a good fit. Using schema level security helps maintain the integrity of your security architecture. You may want to put the archive table(s) in a different schema, or you may allow the same users to access to access the history data.

The pattern is simple in concept and works well once everything is in place. In a transactional system that is actively getting developed it may not be a good fit. New indexes and foreign keys that need to be renamed are an administrative burden. In a warehouse scenario with few or no constraints, it is easier to automate. Indexes still need to be maintained, but that is generally easier to script and maintain.

The basic pattern is to create a new table, copy the existing data to this table, perform ETL operations and validations, then rename the production table to an archive name and the new table to the production name. At that point, all indexes and constraints should also be renamed. The following illustrates the flow. Usually, this will all be managed via the same ETL importing the data. It is also difficult to do if you import data from multiple sources. If this is the case, they all need to be coordinated.

Summary

Choosing the correct ETL pattern starts with understanding the needs for the ETL, existing processes, following enterprise standards, and many other details. Virtualization platforms, data mesh strategies, and data governance will shape your patterns and efforts, as well as the source system specifics.

ETL is a very technical project, but requires a deep understanding of the business and cooperation with many teams. This covered many of the items that need to be considered before defining your ETL pattern. The next part of this series shows common patterns, considerations for their use, and potential downsides to each.

The post Warehouse Load Patterns – Part 1 – Requirements and General Patterns appeared first on Simple Talk.


from Simple Talk https://ift.tt/FsIy6Qf
via

Updates about Database Projects for Microsoft Fabric

comp A few weeks ago, I wrote a blog about Database Projects for Microsoft Fabric. It’s an interesting advance, but it was disappointing because it was only available in half. Updating the Fabric Data Warehouse was not possible yet.

The November updates for Microsoft Fabric announces the support for SQLPackage, but I couldn’t find additional details. Database Projects uses SQLPackage to execute its operations. If SQLPackage works, database projects should as well.

A white text on a white background Description automatically generated

A new round of tests on the database projects for Fabric shows advances, but it’s still disappointing.

Database Projects 101

A quick remind about some basic concepts:

  • Database Projects have the extension .sqlproj
  • They are .NET projects
  • .NET Builds them, generating a resulting compilation
  • The resulting file uses the extension .DACPAC
  • SQLPackage works with the DACPAC for its operations

Database Project Operations

These are the main operations we can make over a database project:

Import: Import the schema from a source, creating a new database project

Compare: Compare source and target

Apply: Apply the comparison between source and target. This can be to bring to the project new objects from the database or update the database with the project changes.

What doesn’t work

Let’s look at a list of details which still don’t work very well, and finally see what works.

ALTER TABLE is not Supported

You can’t make changes to existing tables because ALTER TABLE is not supported on these tools.

This is a huge missing feature, because makes it impossible to use this resource for source control. You can’t update the schema of a table.

A screen shot of a computer Description automatically generated

System Views are imported

The database project also imports the new System Views used to register information about the Data Warehouse access. This has the potential to cause failures and mistakes.

Dynamic Data Mask is not Supported

If you import the schema from a Data Warehouse after applying Dynamic Data Mask, it imports the script. However, when you try to Build the project, it fails, because it doesn’t support Dynamic Data Mask.

A strange constraint together the tables

A UNIQUE NOT ENFORCED constraint comes together some tables. This is not something we generated, it’s auto generated by the data warehouse, and it has the potential to cause failures on the database project process.

A screenshot of a computer Description automatically generated

This strange constraint creates… an ALTER TABLE! (wow! This was not supported!) An ALTER TABLE is generated in the script, and it potentially will cause a failure.

A computer code with black text Description automatically generated

What DOES work

Once you adjust your project to get rid of all the potential failures, it will work.

The command prompt works to generate a script:

sqlpackage /Action:Script /SourceFile:C:\Repos\FabricDW\FabricDW\bin\Debug\FabricDW.dacpac /TargetConnectionString:”Server=4ngkmr53hynexeqmk5pzxcjane-efsof4xhinfepeucrfriwvmmka.datawarehouse.pbidedicated.windows.net; Authentication=Active Directory Interactive; Database=MaltaDW” /OutputPath:C:\Repos\FabricDW\SQLScripts\script.sql

You can generate a script directly on Azure Data Studio

On both scenarios, you need to take care to exclude all the potential failures from the script. After the schema comparison, you can choose which differences you would like to apply and which differences you wouldn’t.

A screenshot of a computer Description automatically generated

You can apply the changes directly from Azure Data Studio

A screenshot of a computer Description automatically generated

You need to have the same care to avoid potential problems as when generating the script.

Important Last Notes

  • I completed all the tests using Azure Data Studio Insiders version
  • Once opened, it identified a new version of the Database Project extension. The versions I have installed after the updates are Azure Data Studio Insiders 1.47.0 and Database Project extension 1.4.1
  • Sometimes you still receive a token error mistake on Azure Data Studio, when connecting to Azure. Once you open it as an Administrator the problem is solved.
  • The need to fix the .sqlproj file on notepad (I mentioned this on the previous blog) still happened, but only once and probably because a mixed version of the Data Studio and extension.

Summary

It’s evolving and it’s evolving fast. But it’s still far from usable in a production environment. Maybe some more months.

It’s impossible to not notice how some features are being announced as available in/for Fabric when they still require a lot more work for production environments.

The post Updates about Database Projects for Microsoft Fabric appeared first on Simple Talk.


from Simple Talk https://ift.tt/l1QRIZE
via

Friday, November 24, 2023

Docker Security Principles Overview

Docker is an open-source platform that enables developers to automate the deployment and management of applications using containerization. It was created by Solomon Hykes and his team at Docker, Inc., and was first released in 2013. Docker allows developers to package their applications and their dependencies into lightweight, portable containers that can run consistently across different computing environments. Docker introduced a new level of efficiency in application deployment by leveraging containerization technology.

Containers provide an isolated and consistent runtime environment for applications, ensuring they run the same way across different infrastructure setups; this enables easy portability and eliminates many compatibility issues. Docker’s containerization model aligns well with the DevOps philosophy and practices; it simplifies the process of building, testing, and deploying applications, making adopting continuous integration and continuous deployment (CI/CD) workflows easier.

Docker allows developers and operations teams to work seamlessly, promoting collaboration and faster release cycles. Docker enables horizontal scalability, allowing applications to be easily replicated and distributed across multiple containers and hosts; scalability, combined with Docker’s lightweight architecture, results in efficient resource utilization.

Docker containers share the host operating system’s kernel, reducing overhead and improving performance. Docker provides application isolation, ensuring that each container operates independently of others on the same host; isolation enhances security by preventing applications from interfering with each other or accessing unauthorized resources. Docker offers features like image signing and vulnerability scanning to enhance container security.

Docker Hub, the official public registry for Docker images, became a central repository for sharing and discovering containerized applications and services; it facilitated the creation of a vast ecosystem of pre-built images that developers could leverage, accelerating Docker’s adoption and ease of use. Docker quickly gained widespread popularity and attracted a large and vibrant community of developers, operators, and organizations; this community actively contributed to the improvement of Docker through the creation of tools, libraries, and best practices.

Overall, Docker revolutionized how applications are packaged, deployed, and managed, leading to its rapid popularity. Its ease of use, portability, scalability, and efficiency have made it a fundamental tool in modern software development and deployment workflows.

Docker Security Principles:

Docker incorporates several inherent security features that contribute to its overall security posture. When you use Docker to quickly create an environment and test some code, security is important enough (especially if you execute any , but when using Docker for production, multi-user environments, it is essential to treat the container as you would any other server environment.

The following is a list of some of the basic security principles that are baked into Docker.

  • Container Isolation: Docker containers provide isolation, allowing applications to run independently of each other and the underlying host system; this isolation prevents applications from interfering with one another and helps contain the impact of security breaches.
  • Resource Limitations: Docker allows resource limitations for containers, such as CPU and memory usage restrictions; this feature prevents containers from monopolizing system resources and helps mitigate denial-of-service attacks or resource exhaustion vulnerabilities.
  • Image Signing and Verification: Docker supports image signing, allowing developers to sign container images to ensure their integrity and authenticity, image verification mechanisms verify the signatures to ensure that only trusted and validated images are used, reducing the risk of tampering or unauthorized modifications.
  • User and Access Management: Docker enables fine-grained control over user permissions within containers; it allows users to run containers with limited privileges, reducing the attack surface and potential impact of security breaches. Docker also supports integration with external authentication and authorization systems, facilitating centralized access control management.
  • Networking and Firewalling: Docker provides container network isolation, enabling fine-grained control over inbound and outbound network connections; administrators can configure network policies, restrict container network access, and implement firewall rules to control traffic flow and protect against unauthorized access.
  • Logging and Auditing: Docker captures container logs, including standard output and error streams; these logs can be collected and monitored centrally, aiding in security incident detection, investigation, and compliance auditing.

Understanding Docker Security Limitation:

The question of how to enhance container security is unavoidable given the increasing popularity of container-based applications; before planning containerization, businesses need to understand the security limitations and plan mitigation to protect their infrastructure. Below are some of the main limitations companies should consider,

  • Shared Kernel: Docker containers share the host operating system’s kernel, meaning a kernel vulnerability can affect multiple containers. While container isolation prevents direct kernel access, it does not eliminate the risk; regularly updating the host kernel and monitoring security advisories are essential to mitigate this risk.
  • Vulnerabilities in Images: Docker images can contain vulnerabilities in their underlying software packages; it is crucial to regularly scan and update container images to patch known vulnerabilities and ensure that only secure images are used in production.
  • Container Breakouts: Although container isolation is designed to prevent containers from escaping their boundaries, specific vulnerabilities or misconfigurations may still allow container breakouts; it is vital to apply proper security measures, such as using secure images, configuring container runtime restrictions, and regularly updating Docker versions to mitigate these risks.
  • Securing the Host: Since Docker containers rely on the underlying host system, securing the host is critical; any compromise of the host system can potentially impact the security of running containers, employing host-level security measures, such as regular patching, securing access to the host, and implementing intrusion detection systems, is crucial.
  • Orchestration and Management: Docker’s inherent security features focus on container runtime and isolation; however, additional security considerations arise when deploying Docker containers at scale using orchestration frameworks like Kubernetes. Properly configuring and securing the orchestration platform, managing secrets and credentials, and applying network security measures become critical in such environments.

To maximize the security of Docker deployments, organizations should combine the inherent security features of Docker with best practices like regular patching, vulnerability scanning, secure image management, access control, monitoring, and ongoing security education and awareness for developers and administrators. Additionally, adopting a defense-in-depth approach that includes multiple layers of security controls helps mitigate the limitations and enhances the overall security of Docker-based environments.

Docker Container Attacks Models and Mitigation:

The container attack model has two perspectives: inside and outside a container. We see the container-like process running inside the container, which is isolated from the host and can execute commands inside containers. When we think of an outside container, the user can see the docker daemon process and all its child processes and execute commands directly on the host. Users can execute commands directly on the host if they have permission to use Docker. An attacker model represents how a malicious actor would attack a system considering the above perspectives.

Inside a Container

Let’s consider a scenario where a malicious actor has access to a container where they can execute commands and have everything inside a container but cannot access other containers or the host. In this scenario, an attacker’s primary Goal is to escape a container’s isolation, referred to as Container Escape.

As shown in the following image, once container escape is successful, Process D can access another container process: A, B, and C; containers are not only isolated from the host, but they should not access another container. Another vector we see here is Process D accessing Process Y, which is running on the host and also able to read and write files on other containers, namely A, B, and C. Imagine a situation: a PaaS offering company that offers small businesses to run their Docker containers; a malicious attacker could have a docker image running an adversarial process that escapes a container and tries to access underlying infrastructure or other containers running on the same platform. It will be a sensitive data exposure and compliance issue for the PaaS offering organization.

A diagram of a process Description automatically generated

Most of the time, the System Administrator follows the common practice of connecting the sockets as volumes to provide containers with API access; this allows containers to monitor and analyze other containers. If the Administrator mounts /var/run/docker.sock to a container, it can access the API even if it’s mounted as a read-only volume. This configuration allows the container full access to docker on the host. An attacker can use this misconfiguration to escape isolation and create another container with arbitrary volumes and commands. It is even possible to remote shell on other containers. Follow the below example of leaking Postgres password information,

Postgres database is started with providing a password in a POSTGRES_PASSWORD environment variable. If the attacker has access to another container with access to Docker API, he can read the Postgres password.

A black box with white text Description automatically generated

Postgres database started with plain text password.

A screenshot of a computer program Description automatically generated

Running docker ubuntu image.

A screenshot of a computer Description automatically generated

Postgres password exposed “IAMNOTSECURE

Outside a Container

Another scenario where the user has unprivileged access to the Docker-installed host. Sometimes referred to as Container Breakout, this is where a user that should be limited to only container access, but they instead they can access resources outside the container.

Users can read configuration files or access sensitive information by interacting with Docker Daemon. The Goal for an attacker here is to perform malicious actions via Docker Daemon, referred to as Docker Daemon Attacks. Malicious actors attempt to exploit vulnerabilities in the Docker Daemon, a critical component of the Docker containerization platform.

Docker Daemon, or dockerd, manages Docker containers on a host system. When Docker Daemon is compromised, it can lead to various security risks and potentially allow attackers to gain unauthorized access or control over the host system and its containers.

Diagram of a diagram of a docker process Description automatically generated

Docker Daemon Attack

Mitigation for container breakout includes enforcing proper container isolation, implement strong access controls, and regularly update the host system and container runtimes.

Privilege Escalation

In the privilege escalation attack model, attackers aim to escalate their privileges within a container or on the host system to gain full control of the system; this can be achieved by exploiting misconfigurations, insecure container settings, or kernel vulnerabilities.

The following image shows that an unprivileged gitlab user belonging to the docker group cant access the/etc/shadow file to get the Administrator hash; he can obtain those running containers in Fig 1.8

A screenshot of a computer program Description automatically generated

A screenshot of a computer program Description automatically generated

A computer screen with white text Description automatically generated

Unprivileged gitlab user can access Administrator hash via running container.

Mitigations include apply the principle of least privilege by configuring containers with minimal privileges, restricting access to sensitive resources, and regularly patching the host system and container runtimes.

Other representative attack types

There are plenty of other attack types that you always need to be aware of when you are using Docker with any kinds of

  • Container Image Vulnerabilities –Attackers exploit vulnerabilities within container images, such as insecure dependencies or misconfigurations; by leveraging known vulnerabilities, attackers can gain control over the container or launch attacks on other systems.

    Mitigation: Regularly scan container images for vulnerabilities, use trusted base images, keep images and dependencies up to date, and implement secure image registry practices.

  • Container Network Attacks – Adversaries target container networks to intercept or manipulate traffic, launch network-based attacks, or gain unauthorized access to sensitive data; techniques include network sniffing, Man-in-the-Middle (MitM) attacks, and exploiting network misconfigurations.

    Mitigation: Implement network segmentation, encrypt container traffic, use secure network protocols, and enforce strict access controls on container networks.

  • Supply Chain Attacks – Adversaries compromise the software supply chain to introduce malicious or vulnerable components into Docker images or repositories; compromised or malicious images can lead to security breaches or malware distribution within containerized environments.

    Mitigation: Use trusted sources for Docker images, employ image signing and verification, regularly scan images for vulnerabilities, and ensure secure image distribution and registry practices.

  • Insider Threats – Insiders with authorized access, such as developers or administrators, may intentionally or inadvertently misuse their privileges to compromise container security; insider threats can lead to unauthorized access, data leakage, or intentional sabotage.

    Mitigation: Implement proper access controls and least privilege principles, monitor user activities, enforce separation of duties, and educate personnel on security best practices.

By considering all the attack models listed, organizations can implement appropriate security measures to mitigate risks and enhance the security of their Docker containers and environments. Adopting a multi-layered security approach encompassing secure configurations, regular updates, monitoring, and incident response capabilities is crucial.

Testing Docker System for vulnerabilities:

When testing a Docker system for vulnerabilities, it’s essential to follow a structured approach to ensure comprehensive coverage and accurate results. In this section I will summarize some of the methodologies for testing Docker systems for vulnerabilities:

Information Gathering:

  • Obtain information about the Docker environment, including the version of Docker, the operating system, network configuration, and any exposed services.
  • Identify the Docker images, containers, and associated technologies in use.

Vulnerability Scanning:

  • Conduct vulnerability scanning on Docker images and related components. Use specialized container security tools to identify known vulnerabilities within the images.
  • Perform vulnerability scanning on the underlying host system to identify any security weaknesses that could impact Docker security.

Configuration Review:

  • Review the configuration settings of Docker, including the Docker daemon and its associated files.
  • Check for misconfigurations, insecure defaults, or weak security settings that could expose the Docker system to vulnerabilities.

Container Breakout Testing:

  • Assess the effectiveness of container isolation by attempting container escapes and privilege escalation.
  • Exploit misconfigurations, kernel vulnerabilities, or container escape techniques to gain unauthorized access to the underlying host system.

Network Security Testing:

  • Evaluate the network security of the Docker system—test for potential misconfigurations, insecure network protocols, or exposed ports that could be exploited.
  • Test for common network-related vulnerabilities like man-in-the-middle attacks, spoofing, or weak encryption.

API and Service Testing:

  • Assess the security of Docker APIs and any exposed services used for container orchestration or management.
  • Test for API vulnerabilities, such as insecure authentication, authorization issues, or injection attacks.

Privilege Escalation and Access Control Testing:

  • Evaluate the effectiveness of access controls and privilege management within the Docker system.
  • Attempt to escalate privileges within containers, gain unauthorized access to resources, or bypass access controls.

Data Management and Storage Testing:

  • Assess the security of data management and storage within Docker containers.
  • Test for vulnerabilities in container volume configurations, persistence mechanisms, or insecure storage access controls.

Logging and Monitoring:

  • Review the logging and monitoring practices of the Docker system.
  • Check if logs are correctly collected, monitored, and retained for effective incident response and forensic analysis.

Reporting:

  • Document all identified vulnerabilities, their severity, and their potential impact.
  • Provide clear recommendations for remediation, including patches, configuration changes, or security best practices.
  • Include a detailed report with findings, supporting evidence, and steps to address identified vulnerabilities.

Always obtain proper authorization before conducting any testing activities and adhere to legal and ethical guidelines. Communicate and coordinate with the stakeholders to minimize any potential impact on the production systems.

Top 5 Docker Security Vulnerabilities:

The following are the top 5 Docker security vulnerabilities as of this writing. Just like most software, there are virtually always vulnerabilities that you need to be aware of that are similar to the following.

  • CVE-2019-15752: Docker Desktop Community Edition before 2.1.0.1 allows unprivileged users to escalate privilege by placing a Trojan horse docker-credential-wincred.exe file in %PROGRAMDATA%\DockerDesktop\version-bin\ as a low-privilege user and then waiting for an admin or service user to authenticate with Docker, restart Docker, or run ‘docker login’ to force the command.
  • CVE-2019-14271: The Docker copy (docker cp) command, used to copy files between containers, has a significant code injection problem. An attacker who exploits this weakness can escape the container completely.
  • CVE-2019-5736: A weakness in how runc handled system file descriptors was discovered when executing containers. A hostile container might exploit this weakness to overwrite the runc binary’s contents and execute arbitrary instructions on the container host system.
  • CVE-2014-9357: A problem in the way the Docker service unpacked images or builds after a “docker pull” was discovered. An attacker might exploit this weakness to distribute a malicious image or build that, when unpacked, would provide them elevated access to the machine.
  • CVE-2014-0048: A problem was discovered in Docker prior to 1.6.0; some Docker programs and scripts are downloaded via HTTP and then executed or used in dangerous ways.

Conclusion:

Docker security is a critical consideration for organizations deploying containerized applications. Docker provides various built-in security features, but it’s important to implement additional measures and best practices to ensure a robust and secure Docker environment.

By following industry best practices and adopting a multi-layered security approach, organizations can significantly enhance the security of their Docker environments, protect their applications and data, and minimize the risk of security breaches or compromises. It’s essential to regularly review and update security practices as new threats emerge and Docker evolves.

Of course, no matter how well you think you are protected from vulnerabilities, you still need to stay informed about the latest security updates, vulnerabilities, and best practices to ensure ongoing protection of your Docker systems.


The post Docker Security Principles Overview appeared first on Simple Talk.


from Simple Talk https://ift.tt/iEk2bMN
via

Thursday, November 23, 2023

Source Control with GIT, Power BI and Microsoft Fabric

Source control is fundamental when dealing with projects and sharing code between multiple developers.

Power BI present some challenges related to source control. But it’s finally providing us with a solution to these challenges. Let’s analyse this piece-by-piece. According to your previous knowledge, you may would like to skip some section of this article. This is the structure I will use:

  • Process Planning: The beginning
  • The current challenges between source control and Power BI
  • GIT 101
  • Sample repository
  • The new features related to source control and Power BI
  • Process Planning: What more we can do

Note: Sections with a prefix of TODO are sections you can execute, in the middle of sections with concept explanations. The steps are numbered consistently throughout the steps.

According to your previous knowledge about GIT, you can choose to skip some of the sections of the article.

Pre-Requisites

  • Have GIT Bash installed to follow the sample. You can download from this link
  • Visual Studio Code installed to follow some of the samples. You can download from this link.
  • A GIT compatible repository, we recommend Azure Devops. You can follow these steps
  • A Power BI file, with data and report

Process Planning and possibilities

The development of the BI reports requires a development process, in a similar way as regular software development. The development process requires at least 3 environments:

  • Development environment
  • Test Environment
  • Production Environment

We need a process to coordinate the evolution of the source code produced between the environments: From Development to Test, from Test to Production.

Before source control, Power BI already had the development pipelines for this purpose. The movement of the reports from one environment to the other can be done manually in the portal or automatically using Azure DevOps.

Everything you must know before getting started with deployment pipelines

I have a video on YouTube that you can watch if you want to learn more about how to use the deployment pipelines

The challenge we have is to design a new process including the source control features and deciding what is the best option for each scenario.

Let’s consider 3 possibilities:

  • Use source control together Deployment Pipelines
  • User source control without Deployment Pipelines
  • Use source control with a single developer

Below I explain these 3 scenarios. Could you imagine additional ones? Let’s talk about it in the comments.

Use source control together Deployment Pipelines

In this scenario, the deployment pipelines are the responsible to move the product between environments.

The Development environment needs to be linked to a repository, but the Test and Production environment have no need of a repository. The movement from Dev to Test and then to Production will be responsibility of the deployment pipelines.

This scenario ends up being like the Data Factory and Azure Synapse source control: only the Development environment requires a repository, the upper environments don’t need one.

Next Steps

Let’s understand the technical features Power BI offers for source control first, so we can analyse deeply the additional architectural options.

Power BI and Source Control: The current challenges

These are the current challenges to using Power BI in a source control scenario:

  • Power BI files have binary content
    The binary content doesn’t work so well with source control. The main purpose of the source control is to allow developers to work on the files an make it possible to merge the results. Using a binary file, this is not possible.
  • Power BI files contain data
    The PBIX file contains the data gathered during the dataset refresh. Usually, we don’t want to send data to source control, we send only text files we can compare to find the differences implemented by the developer.

In fact, the original PBIX file is a .ZIP file with a different extension. If you rename the file as .ZIP and open it, you can see the individual files. However, they don’t have extensions and are not built with source control in mind.

A screenshot of a computer Description automatically generated

GIT Basic Concepts

The image below summarizes most GIT concepts you need to know to make a good use of source control in Power BI

The following list summarizes at a high level, the process to using GIT to source control your files.

  1. The remote repository is CLONED to the local machine. The clone becomes a folder in the local machine. This folder is configured as a local repository.
    All the existing branches in the moment of the CLONE are created in the local repository. If the Branch B is created later, the local repository will not have the Branch B included.
  2. A FETCH operation can be triggered by the local repository. The fetch brings to the local repository the knowledge of existence of new branches on the server.
  3. A CHECKOUT operation can be done to change the current branch to another one.
    Each branch has different versions of the files. A CHECKOUT operation replaces the files in the repository folder by the version contained in the branch. In this way you can work in different versions at any moment. You only need to CHECKOUT the branch you would like to work with.
    The CHECKOUT process can generate different results:
    1. Change a local branch by another local branch
    2. Retrieve a remote branch to the local repository
    3. Create a new branch
  4. When you update the files in the local repository, you need to create a COMMIT. Basically, it means packing your changes together to be sent to the remote repository.
  5. Once the local development is completed, the commits need to be PUSHED to the remote repository, updating the remote branch. On the image above, the Branch B is updated.
  6. Branch B and Branch A have two different versions of the project in the remote repository. The versions need to be synchronized.

    The synchronization process involves a request, which is called PULL REQUEST. This happens because there are multiple possible scenarios. Here are some of the possible scenarios:

    1. The branches may be created by different developers. One developer may need to approve what the other developer produced
    2. The target branch may be a test or production environment and the process involves publishing to a new environment. In some cases, may even include CI/CD process.
    3. The procedure may include a code review. The PULL REQUEST may be subject to approval by other developers or the team leader.
  7. After the PULL REQUEST, the Branch A on the server repository is more updated than the Branch A in the local repository. The developer needs to execute a PULL from the server to the local repository to update the local branch.

TODO: Save a Power BI Project

The Power BI Project is a preview feature. Before we can use it, we need to enable the feature. Once in Power BI, use File -> Options and Settings -> Options -> Preview Features and enable the Power BI Project (.pbip) save option

A screenshot of a computer Description automatically generated

  1. Create a folder to be your local repository
  2. Open your sample Power BI file (PBIX)
  3. Save the project using File-> Save As
  4. Click Browse this device to choose the correct folder
  5. Change the file type to PBIP

A screenshot of a computer Description automatically generated

  1. Save the file

The Power BI Project

The Power BI Project File, PBIP, is not a single file by itself. When we save a PBIP, the content of the Power BI file is broken down in many different files.

The main points related to the files created by the Power BI project are the following:

  • The PBIP file is created in the root of the folder
  • Two subfolders are created, one for the reports and one for the dataset

  • For each folder, dataset and report, a file item.config.json and a file item.metadata.config are created. This file is used by Power BI to identify the content of the folder as a single object (a single dataset or a single report).

A screenshot of a computer Description automatically generated

  • Both folders contain a subfolder called .PBI. This folder is intended to contain files intended to be local, not included in the remote repository.
  • The .PBI folder inside the dataset folder contains a file called cache.abf. This file contains all the data generated by dataset refreshes. In this way, the data is never uploaded to the repository, only the object definitions.

A screenshot of a computer Description automatically generated

  • A .gitignore file is created in the root folder. It ignores the .PBI folders, which makes them local files (that will not be version controlled).
  • The report definition is saved in a file called report.json. As a JSON file, it becomes easier to make merges when two developers work on the same report at the same time.
  • The dataset definition is stored in a file called model.bim, also in JSON format to help concurrent work.

It’s also possible to save multiple PBIP files in the same folder. The files keep a reference with each other and the folders, not allowing the objects to be mixed

TODO: Initialize the local Repository and link to the remote one

This step needs to be taken after your remote repository is ready. In this example, I will use GIT BASH, a command line tool. This is GIT 101, you can do this step with different tools and skip this section if you already have this knowledge.

This continues on the steps taken in the previous TODO section.

  1. Open git bash

    Change the current folder to the folder with the PBIP files

  2. Use CD C:/repos/Adventure for this (the path is an example, of course).
  3. Use GIT INIT
    This statement initializes the folder as a local repository, creating the special git file on the folder “.GIT”
  4. Use GIT ADD .
  5. GIT ADD includes files to be tracked by GIT. The “.” Is telling to include everything, including subfolders. The files will be considered new files, not committed yet.
  6. Use GIT COMMIT –m “First Commit”
    We are committing the files we just added to the local repository, including a commit message.
    At this point, the local repository is created and has its first commit, but it’s not linked to the remote repository yet.
  7. Use GIT REMOTE ADD ORIGIN <<your remote repository>>
    “ORIGIN” is not a statement, rather it is the name given to the remote repository. It’s very common to use “origin”, because usually we have only one. But you can use any name you would like.
  8. Use GIT FETCH
    The local repository needs to discover what branches exist remotely before we link local branches with remote branches
  9. Use GIT BRANCH –SET-UPSTREAM-TO=ORIGIN/MAIN
    This links the local current branch (usually MAIN) to the remote MAIN branch.
    The remote repository usually already has at least a README file. The local repository has the initial commit with our Power BI project. This means the repositories have a different history. This history needs to be synchronized. We will use the next three commands to synchronize the remote history with the local history.
  10. Use GIT REBASE
  11. Use GIT PUSH

A computer screen shot of a program Description automatically generated

The image below is the repository on Azure Devops after the last GIT PUSH

A screenshot of a computer Description automatically generated

TODO: Link the Power BI Workspace with the repository

Power BI will get the files from the workspace. We need to link a repository to the workspace. It’s interesting how this new process will make the publish from the power bi desktop redundant.

  1. Create a workspace, if you don’t have one for this purpose yet
  2. Click Workspace Settings
  3. On WorkSpace Settings window, click GIT Integration
  4. On Organization dropdown, select your organization. Your Power BI account needs access to your repository
  5. On Project dropdown, select the project. Power BI will show the projects you have access to.
  6. On GIT Repository dropdown, select the name of the repository
  7. On Branch dropdown, select the name of the branch. The branch is the only setting you can change later without disconnecting from the repository.
  8. On GIT Folder textbox, type “/” . We will link the workspace with the root folder. Different folders in the repository, including subfolders, will be ignored.

A screenshot of a computer Description automatically generated

  1. Click the button Connect & Sync

    After syncing for a while, you will be able to see the files in the repository. Note that the Power BI Publish command was not used. There is a good potential for the Publish command to become redundant.
    A screenshot of a computer Description automatically generated

A screenshot of a computer Description automatically generated

  1. Open the report

    There is no data on the report. This illustrates how the data from the Power BI Desktop is never uploaded to the repository and doesn’t reach the portal.
    A close up of a logo Description automatically generated

  2. On the Dataset, click the Expand button => Settings

A screenshot of a computer Description automatically generated

  1. Under Data Source Credential, click Edit Credentials in the image below to fix the dataset credentials. You may notice the error message complaining about the credentials.

A screenshot of a computer Description automatically generated

  1. Back to the workspace, click the Refresh Now button.
  2. When the refresh is complete, open the report again.

A number with black text Description automatically generated with medium confidence

Considerations about the link between the Workspace and the Repository

The folder is one of the key values we need to choose when linking the workspace with the source control. Choosing a folder is a difference between linking the workspace to the entire repository or with one specific folder of the repository. This brings many different process options to be chosen on the correct situation:

  • We can have a repository containing a bigger data engineering project, where the power bi workspace is only a piece of the project, contained in one of the folders.
  • We can have a single repository containing multiple workspaces, each workspace in a different folder.
  • We can have one repository for each workspace, linking the workspace with the root folder

Can you think about more possibilities? Tell me in the comments.

Once we define a process to work with source control, the Publish from Power BI Desktop will not need happen anymore. We will only need to push to a repository and the repository linked to the workspace. The portal will synchronize with the repository.

When you open the report, you will notice it’s completely empty. The data was never published to the repository. In this way, the reports appear empty until we make the first dataset refresh.

Even so, the data will not be published to the repository. You may remind the PBIP generation created a .GitIgnore file which excludes the data. In this way, the dataset refreshes are independent of the source control and branch checkouts. We will see more demonstrations of this further in this article.

Workspace and Source Control: Technical Features

The user can see, use and change the integration with the source control on the following ways:

  • Status column in the list of objects
  • Source Control button on top of the screen
  • Workspace Settings-> Git Configuration

Status column

The status column points how the object is in relation to the source control. There are some examples ahead on the article. The status column can have the following values:

  • Synced: The file is in sync, nothing is needed.
  • Update: The file is updated on the repository. Someone pushed changes to the repository. A pull is needed on the workspace.
  • Uncommitted: The file was updated on the portal. Someone opened a report, for example, and changed it on the portal. A commit is required.
  • Conflict: Someone pushed new changes to the repository, but at the same time there were changes on the portal as well, creating a conflict. A merge process is needed when pushing to the repository.
  • Item Identical: The item is the same on the workspace and on the repository, but the commits don’t match.
  • Unsupported: The item is unsupported. As a result, It’s independent of the link to the source control, doesn’t change together the branches.

Source Control Button

Using the Source Control button, on the top of the Power BI portal, you can execute the following tasks:

  • Pull: When the files are with “Update” status, you would like to pull them from the repository
  • Uncommitted: When the files are on the “Uncommitted” status, you would like to commit them. Usually, the commit is to a local repository, but on the portal, “Commit” means Commit + Push
  • Conflict: When the files are in Conflict state, you can make the merge using the Source Control button
  • Item Identical: Using the source control button, we can make a pull to fix the commit history
  • Branch Checkout: It’s important to notice there is a small name mistake here. Branch checkout usually means any change of branch. But for the Source Control button, it only means the creation of a new branch. This button is not capable to checkout an existing branch.

Workspace Settings-> Git Configuration

After the workspace is linked to the source control, the Git Configuration allow us to make a branch checkout to a different existing branch.

Mind the difference: The source control button makes a branch checkout creating a new branch, while the git configuration makes a branch checkout to an existing branch.

Whether and when you would allow or not the developers to use the git checkout feature is something to be analysed as part of the source control process to be used.

The decision depends on one technical behavior: The workspace branch checkout is global, is not a user configuration. Once a different or new branch is checked out, it is for all users. All the developers need to agree about which branch the workspace will be working with.

It’s also important to notice we can only make checkout of a different branch; we can’t change the folder linked to the repository. The folder could only be changed by breaking the link with the source control and linking again, a process you wouldn’t like to do so often. In this way, you should choose the folder wisely.

TODO: Creating a new Branch and Fetching on the Client

  1. Click the Source Control button
  2. On the Source Control window, open the branch dropdown
    On the Source Control window, you can’t change to an existing branch, you can only create a new branch. CHECKOUT has multiple meanings. In this case it means only creating a new branch.
  3. Click the option Checkout New Branch
    A screenshot of a computer Description automatically generated
  4. On the Checkout Branch window, type the name of the new branch “Branch B”
    A screenshot of a checkout branch Description automatically generated
  5. Click the button Checkout Branch.
  6. This will create the “Branch B” based on the Main branch
    Take a look on the Azure DevOps, the new branch will be on the server repository.

A screenshot of a computer Description automatically generated

TODO: Use Visual Studio Code to change your new branch

Visual Studio Code is your friend. If you don’t want to manage the repository using command line, visual studio code is a good option.

  1. Open Visual Studio Code
  2. Click on File -> Open Folder on the top menu
  3. Open the local repository folder
    A screenshot of a computer Description automatically generated
  4. On the status line, click the “main”, the name of the branch

    You will be able to see the main branch, but not Branch B. This happens because the Branch B was created on the server repository. The local repository doesn’t know this branch yet. We need to execute a Fetch.
    A screenshot of a computer Description automatically generated
  5. Click on the Source Control button on the left toolbar
    A black rectangular object with a red border Description automatically generated
  6. On the Source Control window, click the expand button “…”
  7. On the menu, click Fetch
    A screenshot of a computer Description automatically generated
  8. Click Main on the status bar
    The local repository knows the Branch B exists
    A screenshot of a computer Description automatically generated
  9. Select the Branch B on the pallet above
    This will make a branch CHECKOUT, we will be changing the local files from Main to Branch B.

Making a change on Branch B

  1. Open Power BI
  2. Open the PBIP file
  3. From the table Products, select ProductCategoryName to create a new visual
  4. From TransactionHistory table, select ActualCost field
    A screenshot of a computer screen Description automatically generated
  5. Resize the visual to cover half of the report page
    A graph of a number of companies Description automatically generated with medium confidence
  6. Closing Power BI and saving changes
    Power BI Desktop doesn’t show any information related to source control yet. In Visual Studio Code, on the source control window, you will be able to see the changed files. They are identified as changed in the local folder, but a commit was not created yeA screenshot of a computer Description automatically generated
  7. On Visual Studio Code, on the Source Control window, click the Commit button
  8. On the new window, type a message to be used as your commit message
  9. Close the window
    The commit button changes its name to Sync Changes
    A screenshot of a computer Description automatically generated
  10. Click the Sync Changes button
    This is the same to make a Push from the local repository to the remote repository
    On Azure Devops, if you take a look on the branches, you will notice the Branch B is ahead Main

A white rectangular object with a black border Description automatically generated

Testing the changes on the local repository

  1. Click on Branch B, on Visual Studio Code Status Bar
  2. Select Main on the pallet, to checkout the Main branch
    A screenshot of a computer Description automatically generated
  3. Open the PBIP with Power BI
    You will notice the report doesn’t contain the count visual now
    A number with black text Description automatically generated with medium confidence
  4. Close Power BI
  5. Click Main on Visual Studio Code Status Bar
  6. Select Branch B on the pallet, to checkout Branch B
  7. Open PBIP with Power BI
    The count visual is now present.
    A graph of a number of companies Description automatically generated with medium confidence

In this way, you can keep and work in different versions of your Power BI report

TODO: The Power BI Portal and the multiple branches

At this moment, our workspace is linked to the Branch B, which we created. However, the server repository is more updated than Power BI. We need to follow some steps to fix this.

Pulling the repository to Power BI

  1. On the Power BI portal, click Source Control button
    Power BI will automatically compare the files it has with the files on the server, to check if they are updated, and show a status update on the column GIT Status
    A screenshot of a computer Description automatically generated
    We can notice the report was updated.
  2. On the Source Control window, click the Updates tab. It will show the file updated.
    A screenshot of a computer Description automatically generated
  3. Click the button Update All
    This will be the same as making a PULL from the repository
  4. Open the report.
    The new visual is already available and with data

This is an important point: When we did the dataset refresh, we did on the branch Main, but the data is also available to Branch B. The Dataset Refreshes are independent of branches.

A screenshot of a computer Description automatically generated

We already know we can’t change the workspace between existing branches using the Source Control button. We need to use Workspace Settings.

  1. On Power BI Portal, click Workspace Settings.
  2. On Workspace Settings window, click Git Integration
  3. On the branch dropdown, change the branch to main.
  4. Click the button Switch and Override
    This means the branches will switch and the current Power BI files will be replaced by the files from the new branch

    Changing the branch on the Workspace Settings is not a User Level setting, it affects all the users of the workspace. This is something to plan very carefully.

    A screenshot of a computer Description automatically generated
    You will notice the Syncing status during the update process.
    A white rectangular object with black lines Description automatically generated

Changing the report on Power BI Portal

  1. Open the report again.
    You will see only the card, the new visual doesn’t exist in branch Main.
  2. Execute the steps 37-40 again, this time to return to Branch B
  3. Open the report
  4. On the top menu, Click the Edit button
  5. Select the Clustered Bar visual
  6. On the Visualizations window, click on Format Your Visual
  7. Click on the General tab
    A screenshot of a computer Description automatically generated
  8. Open Title item
  9. On Text, change the title to Cost by Product Model
  10. On the top of the window, click on the Save button

  1. Return to the workspace
  2. We changed the report on the portal. The GIT Status column now shows Uncommitted

A screenshot of a computer Description automatically generated

  1. Click on the Source Control button
    This button is marked with “1” because there is one uncommitted file
  2. Select the changed files to be committed – only the report.

    The Source Control window show all the changed files in the portal and allow us to choose which ones we would like to commit:
    A screenshot of a computer Description automatically generated

  1. Click the Commit Button

Checking the changes in the local repository

Let’s check how the changes in the portal can be seen in the local repository

  1. Open Power BI Project
    The title of the visual is not updated, because the changes are on the server repository
  2. Close Power BI
  3. On Visual Studio Code, Source Control window, open the extension menu (“…”)
  4. Click on the Pull menu item
    We are getting the changes from the server to the local repository
  5. Open Power BI Project
  6. This time the title is updated

Process Planning: Additional Possibilities

After understanding the technology, let’s talk about the additional possibilities we have about the architectures to use for the SDLC (Software Development Life Cycle).

Use source control without Deployment Pipelines

If we ignore the usage of the deployment pipelines, we can create 3 independent workspaces and link them with different branches of a repository.

These 3 workspaces will become the Development environment, Test Environment and Production Environment.

The movement from one environment to another and be controlled by the repository. A Pull Request can be made from one branch to another, and the repository can be configured to only proceed once approvers review the Pull Request. In this way, you can have control of the process to move between environments, with approvers involved in the process.

There is one problem: Deployment pipelines automatically control the change of environment variables when moving the product between environments. Without them, you need to make this control manually.

There are advantages in having the Test environment linked to a repository. It’s possible to change the checkout branch and allow the user to test different version of what was produced and provide feedback over different versions, making the process easier.

Branch checkout and Multiple Developers

It’s important to control carefully who will have permission to make a branch checkout in the workspace.

There is no user level branch checkout, as it was highlighted before in this article. When a branch checkout happens in the workspace, it happens for all the developers, everyone is affected. If every developer can change the current branch at any moment, the result will be chaos.

For example, imagine John and Mark working on the same workspace. The workspace is linked to Branch A. John makes a branch checkout of branch B without Mark knowing.

Mark will get many types of the strange behaviors:

  • He will make a push and not see the result in the workspace, without realizing he is using Branch A locally, but the workspace was changed to Branch B
  • He may make a change on the portal thinking he is changing Branch A while in fact he is changing Branch B.
  • He may make a change in the portal, pull the repository and not see the changes locally, because it’s not the same branch and he is not aware about it.

In this way, the permission to make a branch checkout in the workspace needs to be well controlled to avoid the kind of chaos above.

However, we can use different processes on the development environment and on the test environment and get some benefits from it.

  • In the Development environment, you need to choose one branch to be the development one and stick to it. In this way, you avoid the chaos exemplified
  • In the Test environment, the change of branches gives you the possibility to demonstrate different visuals and approaches for the end user. You can create different versions of the reports and easily change the demonstration from one version to another.

But if the developers can’t change the branch in the workspace, how will they make their individual development before publishing?

There are two possibilities:

  • Use Power BI desktop and local workspaces for each individual development.
  • Use a custom workspace in the portal dedicated to each developer. The developers can use this workspace to test what they are producing before merging their creations with the central development environment.

Use source control with a single developer

A single developer also needs the source control features to manage the environments correctly. However, because he is only one, some rules above don’t apply to him.

Specially the rule in relation to branch checkout. He can checkout different branches in Development and Test environment anytime he would like because there is no team to be affected. There is no need to limit himself to the local development or to have an additional workspace for this.

Summary

The feature is still in preview, we can expect to see a lot more coming out soon in Power BI Desktop to manage the source control.

The feature makes our lives way easier, but we still have a lot to plan in relation to the development process we will use for Power BI

Source control is fundamental when dealing with projects and sharing code between multiple developers.

Power BI present some challenges related to source control. But it’s finally providing us with a solution to these challenges. Let’s analyse this piece-by-piece. According to your previous knowledge, you may would like to skip some section of this article. This is the structure I will use:

  • Process Planning: The beginning
  • The current challenges between source control and Power BI
  • GIT 101
  • Sample repository
  • The new features related to source control and Power BI
  • Process Planning: What more we can do

Note: Sections with a prefix of TODO are sections you can execute, in the middle of sections with concept explanations

According to your previous knowledge about GIT, you can choose to skip some of the sections of the article.

Pre-Requisites

  • Have GIT Bash installed to follow the sample. You can download from this link
  • Visual Studio Code installed to follow some of the samples. You can download from this link.
  • A GIT compatible repository, we recommend Azure Devops. You can follow these steps
  • A Power BI file, with data and report

Process Planning and possibilities

The development of the BI reports requires a development process, in a similar way as regular software development. The development process requires at least 3 environments:

  • Development environment
  • Test Environment
  • Production Environment

We need a process to coordinate the evolution of the source code produced between the environments: From Development to Test, from Test to Production.

Before source control, Power BI already had the development pipelines for this purpose. The movement of the reports from one environment to the other can be done manually in the portal or automatically using Azure DevOps.

Everything you must know before getting started with deployment pipelines

I have a video on YouTube that you can watch if you want to learn more about how to use the deployment pipelines

The challenge we have is to design a new process including the source control features and deciding what is the best option for each scenario.

Let’s consider 3 possibilities:

  • Use source control together Deployment Pipelines
  • User source control without Deployment Pipelines
  • Use source control with a single developer

Below I explain these 3 scenarios. Could you imagine additional ones? Let’s talk about it in the comments.

Use source control together Deployment Pipelines

In this scenario, the deployment pipelines are the responsible to move the product between environments.

The Development environment needs to be linked to a repository, but the Test and Production environment have no need of a repository. The movement from Dev to Test and then to Production will be responsibility of the deployment pipelines.

This scenario ends up being like the Data Factory and Azure Synapse source control: only the Development environment requires a repository, the upper environments don’t need one.

Next Steps

Let’s understand the technical features Power BI offers for source control first, so we can analyse deeply the additional architectural options.

Power BI and Source Control: The current challenges

These are the current challenges to using Power BI in a source control scenario:

  • Power BI files have binary content
  • The binary content doesn’t work so well with source control. The main purpose of the source control is to allow developers to work on the files an make it possible to merge the results. Using a binary file, this is not possible.
  • Power BI files contain data
  • The PBIX file contains the data gathered during the dataset refresh. Usually, we don’t want to send data to source control, we send only text files we can compare to find the differences implemented by the developer.

In fact, the original PBIX file is a .ZIP file with a different extension. If you rename the file as .ZIP and open it, you can see the individual files. However, they don’t have extensions and are not built with source control in mind.

A screenshot of a computer Description automatically generated

GIT Basic Concepts

The image below summarizes most GIT concepts you need to know to make a good use of source control in Power BI

The following list summarizes at a high level, the process to using GIT to source control your files.

  1. The remote repository is CLONED to the local machine. The clone becomes a folder in the local machine. This folder is configured as a local repository.
  2. All the existing branches in the moment of the CLONE are created in the local repository. If the Branch B is created later, the local repository will not have the Branch B included.
  3. A FETCH operation can be triggered by the local repository. The fetch brings to the local repository the knowledge of existence of new branches on the server.
  4. A CHECKOUT operation can be done to change the current branch to another one.
  5. Each branch has different versions of the files. A CHECKOUT operation replaces the files in the repository folder by the version contained in the branch. In this way you can work in different versions at any moment. You only need to CHECKOUT the branch you would like to work with.
  6. The CHECKOUT process can generate different results:
  7. Change a local branch by another local branch
  8. Retrieve a remote branch to the local repository
  9. Create a new branch
  10. When you update the files in the local repository, you need to create a COMMIT. Basically, it means packing your changes together to be sent to the remote repository.
  11. Once the local development is completed, the commits need to be PUSHED to the remote repository, updating the remote branch. On the image above, the Branch B is updated.
  12. Branch B and Branch A have two different versions of the project in the remote repository. The versions need to be synchronized.
  13. The synchronization process involves a request, which is called PULL REQUEST. This happens because there are multiple possible scenarios. Here are some of the possible scenarios:
  14. The branches may be created by different developers. One developer may need to approve what the other developer produced
  15. The target branch may be a test or production environment and the process involves publishing to a new environment. In some cases, may even include CI/CD process.
  16. The procedure may include a code review. The PULL REQUEST may be subject to approval by other developers or the team leader.
  17. After the PULL REQUEST, the Branch A on the server repository is more updated than the Branch A in the local repository. The developer needs to execute a PULL from the server to the local repository to update the local branch.

TODO: Save a Power BI Project

The Power BI Project is a preview feature. Before we can use it, we need to enable the feature. Once in Power BI, use File -> Options and Settings -> Options -> Preview Features and enable the Power BI Project (.pbip) save option

A screenshot of a computer Description automatically generated

  1. Create a folder to be your local repository
  2. Open your sample Power BI file (PBIX)
  3. Save the project using File-> Save As
  4. Click Browse this device to choose the correct folder
  5. Change the file type to PBIP

A screenshot of a computer Description automatically generated

  1. Save the file

The Power BI Project

The Power BI Project File, PBIP, is not a single file by itself. When we save a PBIP, the content of the Power BI file is broken down in many different files.

The main points related to the files created by the Power BI project are the following:

  • The PBIP file is created in the root of the folder
  • Two subfolders are created, one for the reports and one for the dataset

  • For each folder, dataset and report, a file item.config.json and a file item.metadata.config are created. This file is used by Power BI to identify the content of the folder as a single object (a single dataset or a single report).

A screenshot of a computer Description automatically generated

  • Both folders contain a subfolder called .PBI. This folder is intended to contain files intended to be local, not included in the remote repository.
  • The .PBI folder inside the dataset folder contains a file called cache.abf. This file contains all the data generated by dataset refreshes. In this way, the data is never uploaded to the repository, only the object definitions.

A screenshot of a computer Description automatically generated

  • A .gitignore file is created in the root folder. It ignores the .PBI folders, which makes them local files (that will not be version controlled).
  • The report definition is saved in a file called report.json. As a JSON file, it becomes easier to make merges when two developers work on the same report at the same time.
  • The dataset definition is stored in a file called model.bim, also in JSON format to help concurrent work.

It’s also possible to save multiple PBIP files in the same folder. The files keep a reference with each other and the folders, not allowing the objects to be mixed

TODO: Initialize the local Repository and link to the remote one

This step needs to be taken after your remote repository is ready. In this example, I will use GIT BASH, a command line tool. This is GIT 101, you can do this step with different tools and skip this section if you already have this knowledge.

This continues on the steps taken in the previous TODO section.

  1. Open git bash

Change the current folder to the folder with the PBIP files

  1. Use CD C:/repos/Adventure for this (the path is an example, of course).
  2. Use GIT INIT

This statement initializes the folder as a local repository, creating the special git file on the folder “.GIT”

  1. Use GIT ADD .
  2. GIT ADD includes files to be tracked by GIT. The “.” Is telling to include everything, including subfolders. The files will be considered new files, not committed yet.
  3. Use GIT COMMIT –m “First Commit”
  4. We are committing the files we just added to the local repository, including a commit message.
  5. At this point, the local repository is created and has its first commit, but it’s not linked to the remote repository yet.
  6. Use GIT REMOTE ADD ORIGIN <<your remote repository>>
  7. “origin” is not a statement, rather it is the name given to the remote repository. It’s very common to use “origin”, because usually we have only one. But you can use any name you would like.
  8. Use GIT FETCH
  9. The local repository needs to discover what branches exist remotely before we link local branches with remote branches
  10. Use GIT BRANCH –SET-UPSTREAM-TO=ORIGIN/MAIN
  11. This links the local current branch (usually MAIN) to the remote MAIN branch.
  12. The remote repository usually already has at least a README file. The local repository has the initial commit with our Power BI project. This means the repositories have a different history. This history needs to be synchronized. We will use the next three commands to synchronize the remote history with the local history.
  13. Use GIT REBASE
  14. Use GIT PUSH

A computer screen shot of a program Description automatically generated

The image below is the repository on Azure Devops after the last GIT PUSH

A screenshot of a computer Description automatically generated

TODO: Link the Power BI Workspace with the repository

Power BI will get the files from the workspace. We need to link a repository to the workspace. It’s interesting how this new process will make the publish from the power bi desktop redundant.

  1. Create a workspace, if you don’t have one for this purpose yet
  2. Click Workspace Settings
  3. On WorkSpace Settings window, click GIT Integration
  4. On Organization dropdown, select your organization. Your Power BI account needs access to your repository
  5. On Project dropdown, select the project. Power BI will show the projects you have access to.
  6. On GIT Repository dropdown, select the name of the repository
  7. On Branch dropdown, select the name of the branch. The branch is the only setting you can change later without disconnecting from the repository.
  8. On GIT Folder textbox, type “/” . We will link the workspace with the root folder. Different folders in the repository, including subfolders, will be ignored.

A screenshot of a computer Description automatically generated

  1. Click the button Connect & Sync
  2. After syncing for a while, you will be able to see the files in the repository. Note that the Power BI Publish command was not used. There is a good potential for the Publish command to become redundant.

A screenshot of a computer Description automatically generated

A screenshot of a computer Description automatically generated

  1. Open the report
  2. There is no data on the report. This illustrates how the data from the Power BI Desktop is never uploaded to the repository and doesn’t reach the portal.

A close up of a logo Description automatically generated

  1. On the Dataset, click the Expand button => Settings

A screenshot of a computer Description automatically generated

  1. Under Data Source Credential, click Edit Credentials in the image below to fix the dataset credentials. You may notice the error message complaining about the credentials.

A screenshot of a computer Description automatically generated

  1. Back to the workspace, click the Refresh Now button.
  2. When the refresh is complete, open the report again.

A number with black text Description automatically generated with medium confidence

Considerations about the link between the Workspace and the Repository

The folder is one of the key values we need to choose when linking the workspace with the source control. Choosing a folder is a difference between linking the workspace to the entire repository or with one specific folder of the repository. This brings many different process options to be chosen on the correct situation:

  • We can have a repository containing a bigger data engineering project, where the power bi workspace is only a piece of the project, contained in one of the folders.
  • We can have a single repository containing multiple workspaces, each workspace in a different folder.
  • We can have one repository for each workspace, linking the workspace with the root folder

Can you think about more possibilities? Tell me in the comments.

Once we define a process to work with source control, the Publish from Power BI Desktop will not need happen anymore. We will only need to push to a repository and the repository linked to the workspace. The portal will synchronize with the repository.

When you open the report, you will notice it’s completely empty. The data was never published to the repository. In this way, the reports appear empty until we make the first dataset refresh.

Even so, the data will not be published to the repository. You may remind the PBIP generation created a .GitIgnore file which excludes the data. In this way, the dataset refreshes are independent of the source control and branch checkouts. We will see more demonstrations of this further in this article.

Workspace and Source Control: Technical Features

The user can see, use and change the integration with the source control on the following ways:

  • Status column in the list of objects
  • Source Control button on top of the screen
  • Workspace Settings-> Git Configuration

Status column

The status column points how the object is in relation to the source control. There are some examples ahead on the article. The status column can have the following values:

  • Synced: The file is in sync, nothing is needed.
  • Update: The file is updated on the repository. Someone pushed changes to the repository. A pull is needed on the workspace.
  • Uncommitted: The file was updated on the portal. Someone opened a report, for example, and changed it on the portal. A commit is required.
  • Conflict: Someone pushed new changes to the repository, but at the same time there were changes on the portal as well, creating a conflict. A merge process is needed when pushing to the repository.
  • Item Identical: The item is the same on the workspace and on the repository, but the commits don’t match.
  • Unsupported: The item is unsupported. As a result, It’s independent of the link to the source control, doesn’t change together the branches.

Source Control Button

Using the Source Control button, on the top of the Power BI portal, you can execute the following tasks:

  • Pull: When the files are with “Update” status, you would like to pull them from the repository
  • Uncommitted: When the files are on the “Uncommitted” status, you would like to commit them. Usually, the commit is to a local repository, but on the portal, “Commit” means Commit + Push
  • Conflict: When the files are in Conflict state, you can make the merge using the Source Control button
  • Item Identical: Using the source control button, we can make a pull to fix the commit history
  • Branch Checkout: It’s important to notice there is a small name mistake here. Branch checkout usually means any change of branch. But for the Source Control button, it only means the creation of a new branch. This button is not capable to checkout an existing branch.

Workspace Settings-> Git Configuration

After the workspace is linked to the source control, the Git Configuration allow us to make a branch checkout to a different existing branch.

Mind the difference: The source control button makes a branch checkout creating a new branch, while the git configuration makes a branch checkout to an existing branch.

Whether and when you would allow or not the developers to use the git checkout feature is something to be analysed as part of the source control process to be used.

The decision depends on one technical behavior: The workspace branch checkout is global, is not a user configuration. Once a different or new branch is checked out, it is for all users. All the developers need to agree about which branch the workspace will be working with.

It’s also important to notice we can only make checkout of a different branch; we can’t change the folder linked to the repository. The folder could only be changed by breaking the link with the source control and linking again, a process you wouldn’t like to do so often. In this way, you should choose the folder wisely.

TODO: Creating a new Branch and Fetching on the Client

  1. Click the Source Control button
  2. On the Source Control window, open the branch dropdown
  3. On the Source Control window, you can’t change to an existing branch, you can only create a new branch. CHECKOUT has multiple meanings. In this case it means only creating a new branch.

  4. Click the option Checkout New Branch

A screenshot of a computer Description automatically generated

  1. On the Checkout Branch window, type the name of the new branch “Branch B”

A screenshot of a checkout branch Description automatically generated

  1. Click the button Checkout Branch.
  2. This will create the “Branch B” based on the Main branch

Take a look on the Azure DevOps, the new branch will be on the server repository.

A screenshot of a computer Description automatically generated

TODO: Use Visual Studio Code to change your new branch

Visual Studio Code is your friend. If you don’t want to manage the repository using command line, visual studio code is a good option.

  1. Open Visual Studio Code
  2. Click on File -> Open Folder on the top menu
  3. Open the local repository folder

A screenshot of a computer Description automatically generated

  1. On the status line, click the “main”, the name of the branch
  2. You will be able to see the main branch, but not Branch B. This happens because the Branch B was created on the server repository. The local repository doesn’t know this branch yet. We need to execute a Fetch.
  3. A screenshot of a computer Description automatically generated
  4. Click on the Source Control button on the left toolbar

A black rectangular object with a red border Description automatically generated

  1. On the Source Control window, click the expand button “…”
  2. On the menu, click Fetch

A screenshot of a computer Description automatically generated

  1. Click Main on the status bar
  2. The local repository knows the Branch B exists
  3. A screenshot of a computer Description automatically generated
  4. Select the Branch B on the pallet above
  5. This will make a branch CHECKOUT, we will be changing the local files from Main to Branch B.

Making a change on Branch B

  1. Open Power BI
  2. Open the PBIP file
  3. From the table Products, select ProductCategoryName to create a new visual
  4. From TransactionHistory table, select ActualCost field

A screenshot of a computer screen Description automatically generated

  1. Resize the visual to cover half of the report page

A graph of a number of companies Description automatically generated with medium confidence

  1. Closing Power BI and saving changes
  2. Power BI Desktop doesn’t show any information related to source control yet. In Visual Studio Code, on the source control window, you will be able to see the changed files. They are identified as changed in the local folder, but a commit was not created yet.

  3. A screenshot of a computer Description automatically generated
  4. On Visual Studio Code, on the Source Control window, click the Commit button
  5. On the new window, type a message to be used as your commit message
  6. Close the window
  7. The commit button changes its name to Sync Changes
  8. A screenshot of a computer Description automatically generated
  9. Click the Sync Changes button
  10. This is the same to make a Push from the local repository to the remote repository

  11. On Azure Devops, if you take a look on the branches, you will notice the Branch B is ahead Main

A white rectangular object with a black border Description automatically generated

Testing the changes on the local repository

  1. Click on Branch B, on Visual Studio Code Status Bar
  2. Select Main on the pallet, to checkout the Main branch
  3. A screenshot of a computer Description automatically generated
  4. Open the PBIP with Power BI
  5. You will notice the report doesn’t contain the new visual
  6. A number with black text Description automatically generated with medium confidence
  7. Close Power BI
  8. Click Main on Visual Studio Code Status Bar
  9. Select Branch B on the pallet, to checkout Branch B
  10. Open PBIP with Power BI
  11. The new visual is present.

A graph of a number of companies Description automatically generated with medium confidence

In this way, you can keep and work in different versions of your Power BI report

TODO:

The Power BI Portal and the multiple branches

At this moment, our workspace is linked to the Branch B, which we created. However, the server repository is more updated than Power BI. We need to follow some steps to fix this.

Pulling the repository to Power BI

  1. On the Power BI portal, click Source Control button
  2. Power BI will automatically compare the files it has with the files on the server, to check if they are updated, and show a status update on the column GIT Status

  3. A screenshot of a computer Description automatically generated
  4. We can notice the report was updated.
  5. On the Source Control window, click the Updates tab. It will show the file updated.
  6. A screenshot of a computer Description automatically generated
  7. Click the button Update All
  8. This will be the same as making a PULL from the repository

  9. Open the report.
  10. The new visual is already available and with data

This is an important point: When we did the dataset refresh, we did on the branch Main, but the data is also available to Branch B. The Dataset Refreshes are independent of branches.

A screenshot of a computer Description automatically generated

We already know we can’t change the workspace between existing branches using the Source Control button. We need to use Workspace Settings.

  1. On Power BI Portal, click Workspace Settings.
  2. On Workspace Settings window, click Git Integration
  3. On the branch dropdown, change the branch to main.
  4. Click the button Switch and Override
  5. This means the branches will switch and the current Power BI files will be replaced by the files from the new branch

  6. Changing the branch on the Workspace Settings is not a User Level setting, it affects all the users of the workspace. This is something to plan very carefully.
  7. A screenshot of a computer Description automatically generated
  8. You will notice the Syncing status during the update process.

  9. A white rectangular object with black lines Description automatically generated

Changing the report on Power BI Portal

  1. Open the report again.
  2. You will see only the card, the new visual doesn’t exist in branch Main.

  3. Execute the steps 37-40 again, this time to return to Branch B
  4. Open the report
  5. On the top menu, Click the Edit button
  6. Select the Clustered Bar visual
  7. On the Visualizations window, click on Format Your Visual
  8. Click on the General tab
  9. A screenshot of a computer Description automatically generated
  10. Open Title item
  11. On Text, change the title to Cost by Product Model
  12. On the top of the window, click on the Save button

  1. Return to the workspace
  2. We changed the report on the portal. The GIT Status column now shows Uncommitted

A screenshot of a computer Description automatically generated

  1. Click on the Source Control button
  2. This button is marked with “1” because there is one uncommitted file

  3. Select the changed files to be committed – only the report.
  4. The Source Control window show all the changed files in the portal and allow us to choose which ones we would like to commit:

A screenshot of a computer Description automatically generated

  1. Click the Commit Button

Checking the changes in the local repository

Let’s check how the changes in the portal can be seen in the local repository

  1. Open Power BI Project
  2. The title of the visual is not updated, because the changes are on the server repository

  3. Close Power BI
  4. On Visual Studio Code, Source Control window, open the extension menu (“…”)
  5. Click on the Pull menu item
  6. We are getting the changes from the server to the local repository

  7. Open Power BI Project
  8. This time the title is updated

Process Planning: Additional Possibilities

After understanding the technology, let’s talk about the additional possibilities we have about the architectures to use for the SDLC (Software Development Life Cycle).

Use source control without Deployment Pipelines

If we ignore the usage of the deployment pipelines, we can create 3 independent workspaces and link them with different branches of a repository.

These 3 workspaces will become the Development environment, Test Environment and Production Environment.

The movement from one environment to another and be controlled by the repository. A Pull Request can be made from one branch to another, and the repository can be configured to only proceed once approvers review the Pull Request.

In this way, you can have control of the process to move between environments, with approvers involved in the process.

There is one problem: Deployment pipelines automatically control the change of environment variables when moving the product between environments. Without them, you need to make this control manually.

There are advantages in having the Test environment linked to a repository. It’s possible to change the checkout branch and allow the user to test different version of what was produced and provide feedback over different versions, making the process easier.

Branch checkout and Multiple Developers

It’s important to control carefully who will have permission to make a branch checkout in the workspace.

There is no user level branch checkout, as it was highlighted before in this article. When a branch checkout happens in the workspace, it happens for all the developers, everyone is affected. If every developer can change the current branch at any moment, the result will be chaos.

For example, imagine Jonh and Mark working on the same workspace. The workspace is linked to Branch A. Jonh makes a branch checkout of branch B without Mark knowing.

Mark will get many types of the strange behaviours:

  • He will make a push and not see the result in the workspace, without realizing he is using Branch A locally, but the workspace was changed to Branch B
  • He may make a change on the portal thinking he is changing Branch A while in fact he is changing Branch B.
  • He may make a change in the portal, pull the repository and not see the changes locally, because it’s not the same branch and he is not aware about it.

In this way, the permission to make a branch checkout in the workspace needs to be well controlled to avoid the kind of chaos above.

However, we can use different processes on the development environment and on the test environment and get some benefits from it.

  • In the Development environment, you need to choose one branch to be the development one and stick to it. In this way, you avoid the chaos exemplified
  • In the Test environment, the change of branches gives you the possibility to demonstrate different visuals and approaches for the end user. You can create different versions of the reports and easily change the demonstration from one version to another.

But if the developers can’t change the branch in the workspace, how will they make their individual development before publishing?

There are two possibilities:

  • Use Power BI desktop and local workspaces for each individual development.
  • Use a custom workspace in the portal dedicated to each developer. The developers can use this workspace to test what they are producing before merging their creations with the central development environment.

Use source control with a single developer

A single developer also needs the source control features to manage the environments correctly. However, because he is only one, some rules above don’t apply to him.

Specially the rule in relation to branch checkout. He can checkout different branches in Development and Test environment anytime he would like because there is no team to be affected. There is no need to limit himself to the local development or to have an additional workspace for this.

Summary

The feature is still in preview, we can expect to see a lot more coming out soon in Power BI Desktop to manage the source control.

The feature makes our lives way easier, but we still have a lot to plan in relation to the development process we will use for Power BI

The post Source Control with GIT, Power BI and Microsoft Fabric appeared first on Simple Talk.


from Simple Talk https://ift.tt/gqwoklD
via