Tuesday, September 18, 2018

Introducing the Unity Job System

Made available to everyone starting with Unity 2018.1, the C# Job System allows users to write multithreaded code that interacts well with Unity. For many Unity users, this was a big deal. Better performance is so important to many people playing video games that players will often set their game’s graphics settings to something low so that the game will run optimally. But who says you have to force players to tweak their game’s settings to get the performance they want? Why not have peak performance from the start?

With Unity’s C# jobs, this is made much easier for the developer. This is especially true if you plan to create a game that requires many objects in the game’s world, with all of them doing something at the same time. Normally, this would be incredibly taxing for the machine running this game, but thanks to the newly implemented Job System, you can now more easily achieve this scenario without taking a performance hit. Unity’s C# jobs have been touched on before back when Unity 2018.1 was first released, but it only went skin deep. This time jobs will be explained in much more detail along with a tutorial showing you how to create a job that moves 3,000 cubes around in a scene. Note: you may need to adjust this number depending on the power of your computer.

Setting Up

Once you’ve started Unity, create a new project.

Figure 1: Creating a new project.

After that, name the project 3000Cubes. Then set your file path of choice. You’ll also want to make sure you’re using the 3D project template. After this has been done, click Create Project.
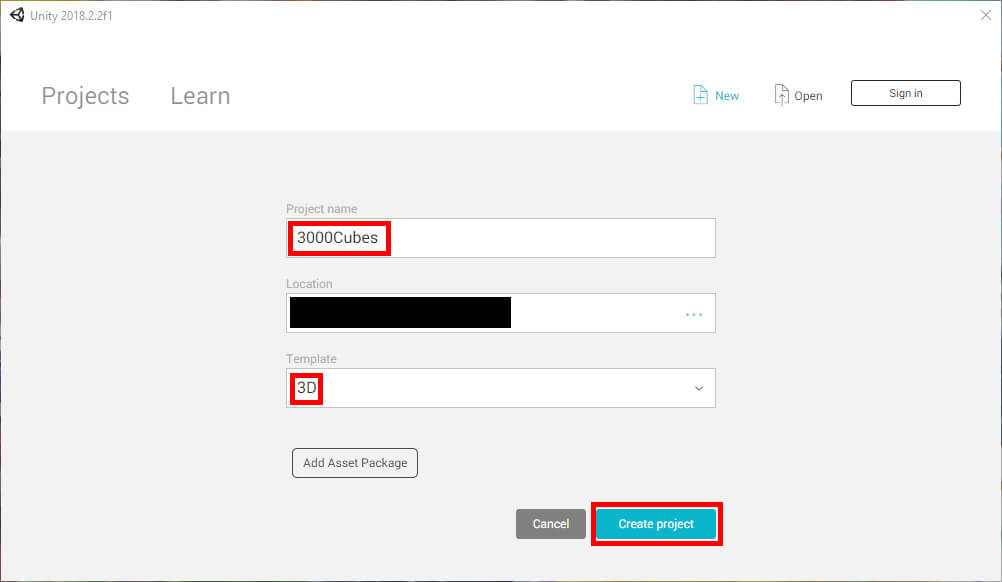
Figure 2: Setting project name, location, and template.

Unity will then do some work, then present you with a blank project like that shown in Figure 3.

Figure 3: A new blank project

Believe it or not, there are only two things that need to be done before jumping into the code. First, in the Hierarchy menu, click the Create button and select Create Empty to create a new object.
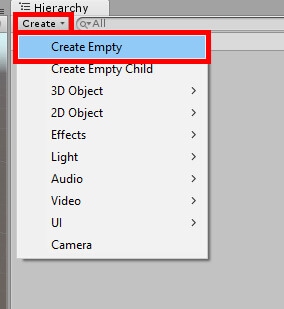
Figure 4: Creating a new object.

Name this object JobObject. After that, with JobObject selected in the Hierarchy, click the Add Component button in the Inspector window. In the window that appears, scroll to the very bottom and select New Script.
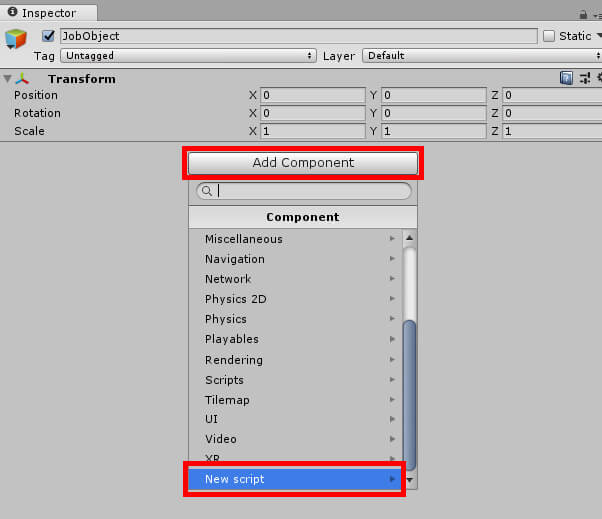
Figure 5: Creating and adding a new script component.

In the next window, name this script CubeMovementJob, then click Create and Add.
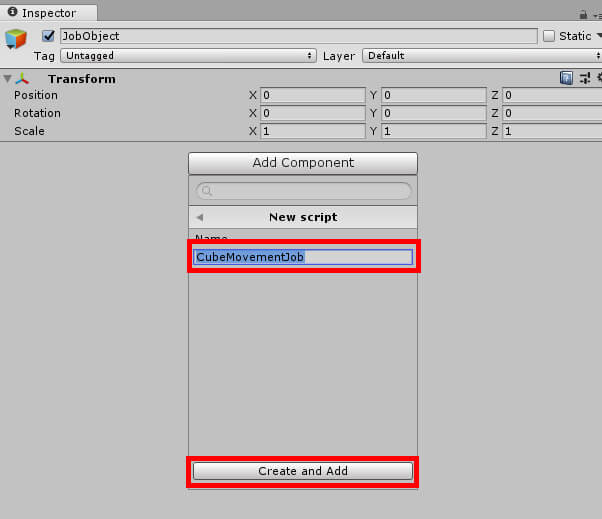
Figure 6: Naming the script and creating it.

With that finished, JobObject should now look like what’s shown in Figure 7.
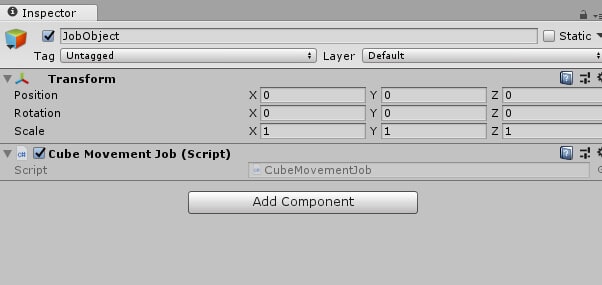
Figure 7: JobObject with the new script attached.

Setup is now complete! Yes, even the process of setting up a project is made faster thanks to Unity jobs. In the Inspector window, double click the Script field in the newly added Cube Movement Job component to open up Visual Studio and create your new C# job!

The Code

This project aims to show you two things: the first is to show how to create jobs. The second is to show off how much of a boost using C# jobs can give you compared to what you might usually do. Before declaring variables and creating your first job, you will need to enter some using statements. At the top of the script, before the class declaration, add the following lines of code:

using UnityEngine.Jobs;
using Unity.Collections;
using Unity.Jobs;

UnityEngine.Jobs and Unity.Jobs are required to access and utilize the job functionality in your script. They’ll also be required for certain variables you will declare later. Unity.Collections allow you to make use of the NativeArray<> struct type, which will be required when working with C# jobs. Next, declare the following variables:

public int count = 3000;
public float speed = 20;
public int spawnRange = 50;
public bool useJob;
private Transform[] transforms;
private Vector3[] targets;
private List<GameObject> cubes = new List<GameObject>();
private TransformAccessArray transAccArr;
private NativeArray<Vector3> nativeTargets;

The first four public variables will be used to dictate how many cubes will be spawned, the speed at which it moves, the range that the cubes can be spawned in, and, finally, if you wish to use C# jobs or not. They have been made public so that they can be edited later from within the Unity editor in case you wish to add more cubes or increase the area they can spawn in. After these have been declared, a handful of private arrays will be created. The first two, transforms and targets, are arrays that will store the transform and Vector3 data of the various cubes you create.

Next, you’ll have a new List named cubes, followed by the creation of the TransformAccessArray and a NativeArray<Vector3>. Cubes will simply be a list kept of all the cubes spawned and will be used later when creating the same project in non-job code. Then there’s transAccArr and nativeTargets. These two arrays will store the information gathered from transforms and targets and send them to the job you shall soon create. But why can’t we use the transforms and targets arrays instead? This is because, according to Unity’s own debugger, the type of Transform and Vector3 is not a value type, and jobs cannot contain any reference types. Put simply, jobs can only work with other structs, which Transform and Vector3 are not.

So now you may be wondering why you would declare those first two arrays at all? They will be needed to fill the transAccArr and nativeTargets arrays, as you cannot simply add a new item to a TransformAccessArray and NativeArray. Instead, you will fill the transforms and targets arrays then hand the data over to transAccArr and NativeTargets to put to use in the job. In addition, you’ll also want them for later in the project when you use non-job code to perform the same task.

Quite a bit of explanation to be done here! Let’s take a break and see where your code should be now.
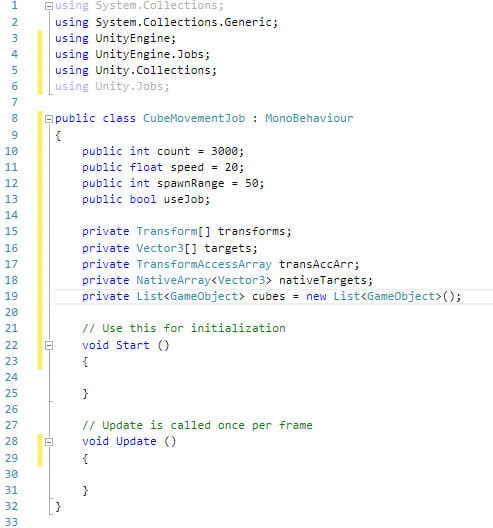
Figure 8: All using statements and variable declarations.

Now seems like a good time to create the C# job. Underneath your variable declarations, add the following:

struct MovementJob : IJobParallelForTransform
{
        public float deltaTime;
        public NativeArray<Vector3> Targets;
        public float Speed;
        public void Execute(int i, TransformAccess transform)
        {
                transform.position = Vector3.Lerp(transform.position, Targets[i], deltaTime / Speed);
        }
}

Let’s break this down. For starters, all jobs are structs and must inherit from either IJob, IJobParallelFor or IJobParallelForTransform. In this case, it’s inheriting from IJobParallelForTransform because you will use this job to move objects, which IJobParallelForTransform allows you to do.

Next, a few variables are declared. The first, deltaTime, will simply keep track of what is currently in Time.deltaTime. You can’t simply say Time.deltaTime in the job, so you get the value of deltaTime and store it as a float in the job. Next is a NativeArray that will store an array of Vector3s called Targets. Finally, there’s another float named Speed, which will simply get the value of the public variable speed.

Then comes the interesting part. Execute is a function all jobs are required to have. As you may have guessed, whatever is inside Execute is what the job will actually do. In this case, you have the job doing a simple task. It will get all the cube objects and have them Lerp (meaning to smoothly move from one position to the next) from one point to another at a certain speed. Within the () of the Execute function lies two parameters, an integer simply named i, and a TransformAccess simply named transform. The variable i will be treated much like i would if this were a for loop, and transform will contain a given object’s transform.

At this point, the script should now look something like what’s shown in Figure 9.
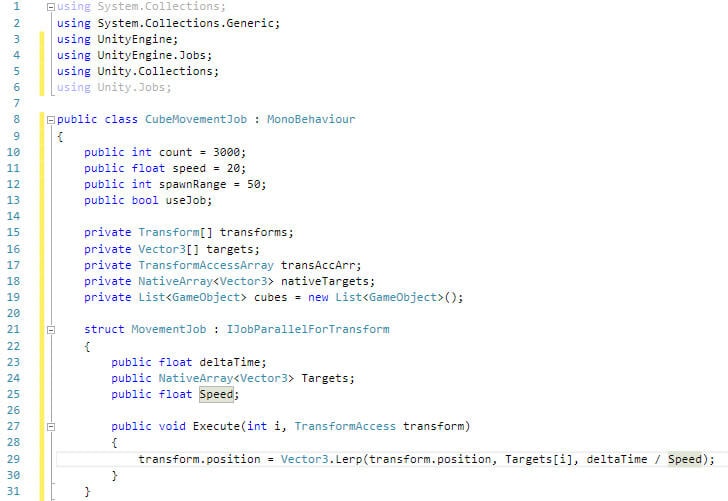
Figure 9: Your new C# job!

Before working on the Start and Update functions, there are two more variables to declare, and they’re both important to the job you just created. Beneath your new job and above the Start method, enter these lines:

private MovementJob job;
private JobHandle newJobHandle;

The first variable is pretty simple. You’re simply declaring a reference to the MovementJob. After that you declare a JobHandle that you’ll just call newJobHandle. A JobHandle is almost exactly what it sounds like. It handles jobs, doing so by scheduling and completing the jobs you assign it. With everything declared and ready to roll, it’s time to work on the Start function.

transforms = new Transform[count];
for (int i = 0; i < count; i++)
{
        GameObject obj = GameObject.CreatePrimitive(PrimitiveType.Cube);
        cubes.Add(obj);
        obj.transform.position = new Vector3(Random.Range(-spawnRange, spawnRange), Random.Range(-spawnRange, spawnRange), Random.Range(-spawnRange, spawnRange));
        obj.GetComponent<MeshRenderer>().material.color = Color.green;
        transforms[i] = obj.transform;
}
targets = new Vector3[transforms.Length];
StartCoroutine(GenerateTargets());

You create the Start function by first taking the transforms array and creating a new array of Transform with count defining the number of elements in the array. Count is the variable that keeps track of how many cubes you will spawn. Speaking of which, the next part of the function has you creating a for loop. Within this for loop, you create a cube, add it to the cubes list, give it a random starting position, and give it a green color. Of course, feel free to change the color if you wish.

After that, the transforms array gets its next value by getting the recently created cube’s transform. This process continues until every cube is spawned. Then, the targets array gets a new array of Vector3 using transforms.Length to define the number of elements within this array. Finally, a Coroutine will be run to fill the targets array. But that Coroutine has not yet been defined, so no doubt Visual Studio will start telling you it has no idea what this is. It’s now time to create this Coroutine, but first, check to make sure your code looks like Figure 10 below.
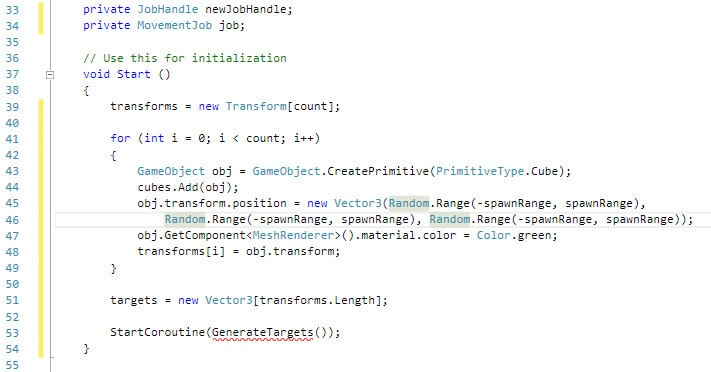
Figure 10: The Start function and the final variable declarations.

A Coroutine is created by creating an IEnumerator. It then operates very similarly to a function except that it can pause execution and return control to Unity, but then carry on wherever it left off on the next frame. It is required that a yield return statement is included somewhere within the body of the Coroutine. The yield return line is the point when an execution pauses and can be resumed in the following frame. Now that you know what a Coroutine is, it’s time to create one! Place the following code underneath the Update function.

public IEnumerator GenerateTargets()
{
        for (int i = 0; i < targets.Length; i++)
                targets[i] = new Vector3(Random.Range(-spawnRange, spawnRange), Random.Range(-spawnRange, spawnRange), Random.Range(-spawnRange, spawnRange));
        yield return new WaitForSeconds(2);
}

In this case, your GenerateTargets coroutine will simply create the cubes within the range you specify. This is among one of the simpler tasks you can do with coroutines. You can also create a typewriter effect with text and more using coroutines. Now, move on to the Update function and input this code.

transAccArr = new TransformAccessArray(transforms);
nativeTargets = new NativeArray<Vector3>(targets, Allocator.Temp);
if (useJob == true)
{
        job = new MovementJob();
        job.deltaTime = Time.deltaTime;
        job.Targets = nativeTargets;
        job.Speed = speed;
        newJobHandle = job.Schedule(transAccArr);
}
else
{
        for (int i = 0; i < transAccArr.length; i++)
                cubes[i].transform.position = Vector3.Lerp(cubes[i].transform.position, targets[i], Time.deltaTime / speed);
}

Your Update function will do one of two things depending on the value of the useJob boolean. If you set it to true, then your project will utilize the job you created to move the various cubes around the scene. When using jobs, you create a new instance of MovementJob and assign the different variables in the job. Next, you utilize the JobHandle called newJobHandle to schedule the job you created. When scheduling the job, you give transAccArr as the TransformAccessArray that the job will use in its Execute function.

If you set useJob to false, then the program will instead accomplish the same task without using the C# job system. You’ll see later that, especially with many objects in the scene at once, that using jobs can greatly improve your project’s performance at runtime. Once you’re finished, the Update function and GenerateTargets coroutine should look similar to the figure below.
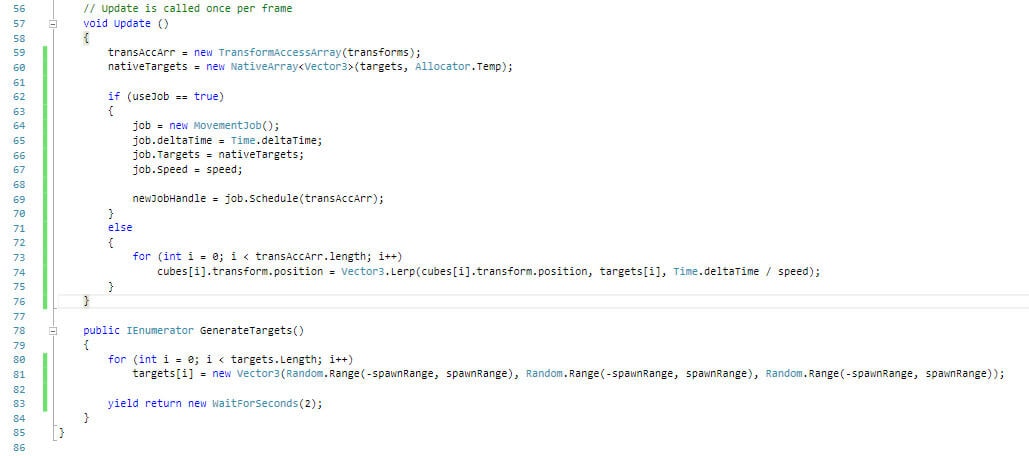
Figure 11: The Update function and GenerateTargets coroutine.

There is still one last task to complete before you can test out the project. Between the Update function and GenerateTargets coroutine, create a new function called LateUpdate and give it the following code.

private void LateUpdate()
{
        newJobHandle.Complete();
        transAccArr.Dispose();
        nativeTargets.Dispose();
}

There’s not much to this code, but it’s important to include this function to properly finish jobs and prevent memory leaks. LateUpdate is called whenever all Update functions have been called. It can be useful to order script execution. Some examples of where LateUpdate can be used include moving a camera or, in your case, disposing native collections. There’s also the act of calling newJobHandle's Complete function. This function simply ensures that the job has been completed before moving on to another job you may give Unity. Once you’ve added this code, your script should look like this:
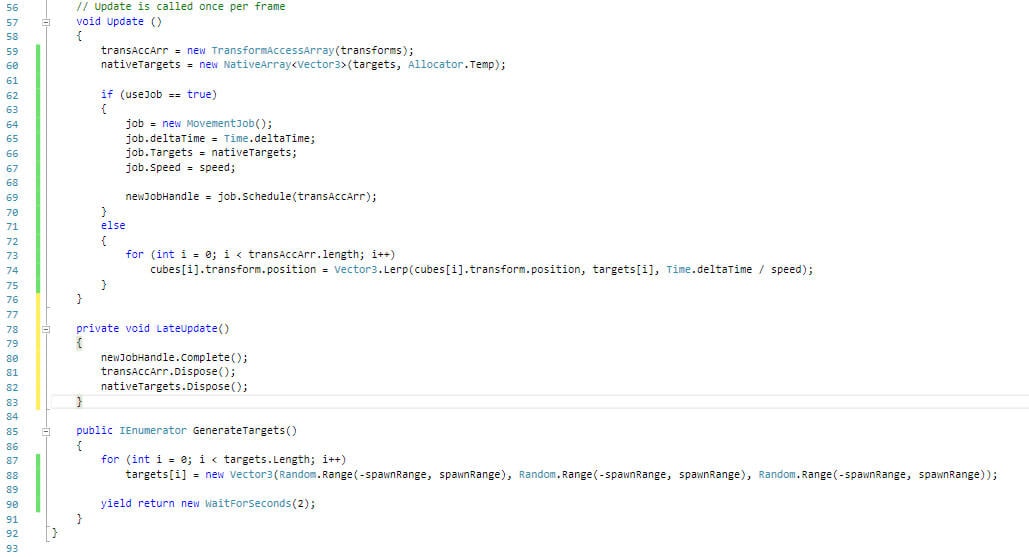
Figure 12: Script with LateUpdate added.

The time has now come to finish this project. Save your code and return to the Unity editor.

Finishing the Project

Much like the setup, finishing the project has very little to it. Select jobObject in the Hierarchy window, then navigate to the Inspector window and check out the Cube Movement Job script component. All the variables shown dictate the number of cubes spawned, how quickly they move, and the range that they can spawn in. There is also a checkbox that toggles your useJob boolean to true or false. For the moment, leave this boolean as false (unchecked). The rest of the variables can be left at their default values if you wish, but the example will assume you kept the cube count at 3,000.
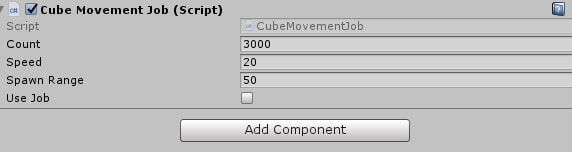
Figure 13: The complete CubeMovementJob script component.

Before playing the project, it would be helpful to open the Profiler window to view the performance of your project. To do this, click Window->Analysis->Profiler or simply press Ctrl + 7. Place the profiler anywhere you wish on your screen.
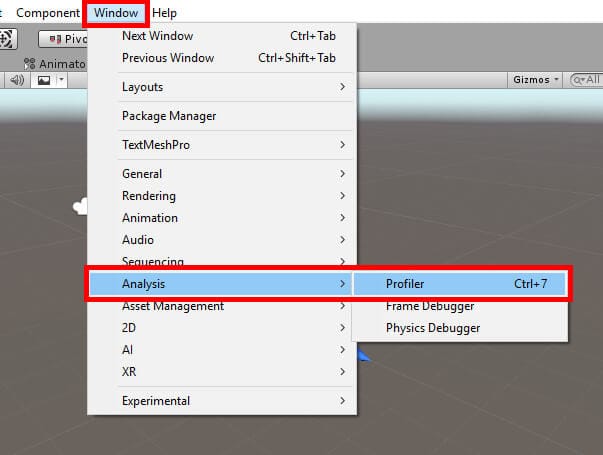
Figure 14: Opening the Profiler window.

After you’ve pulled up the Profiler window, save your project. If your computer finds itself unable to handle 3,000 cubes, it could lead to Unity crashing. Saving the project will, therefore, prevent any time and effort being lost. Should Unity crash, lower the number of cubes created. Begin the project by clicking the Play button at the top of the editor.
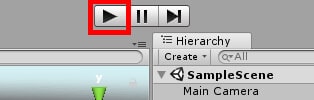
Figure 15: Starting the project.

While the project runs, click anywhere in the top part of the Profiler window to view more information about how much time it takes to do specific tasks. The blue area in the Profiler window represents how much CPU usage is going towards performing the tasks in your script.
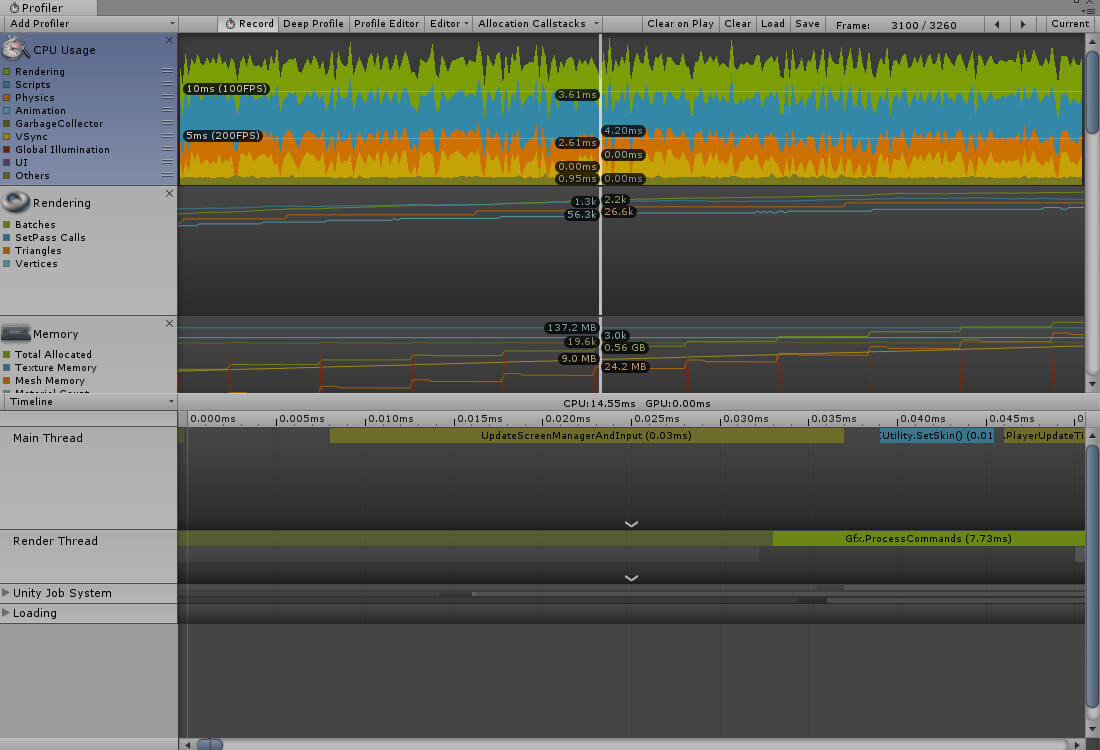
Figure 16: Unity Profiler when not using jobs. Time to finish script functions is 4.2 ms.

Remember, you should have it set up where you are currently not using jobs. Now, either pause the project or stop it to go back and set the useJob boolean to true, then run your program again to see the difference.
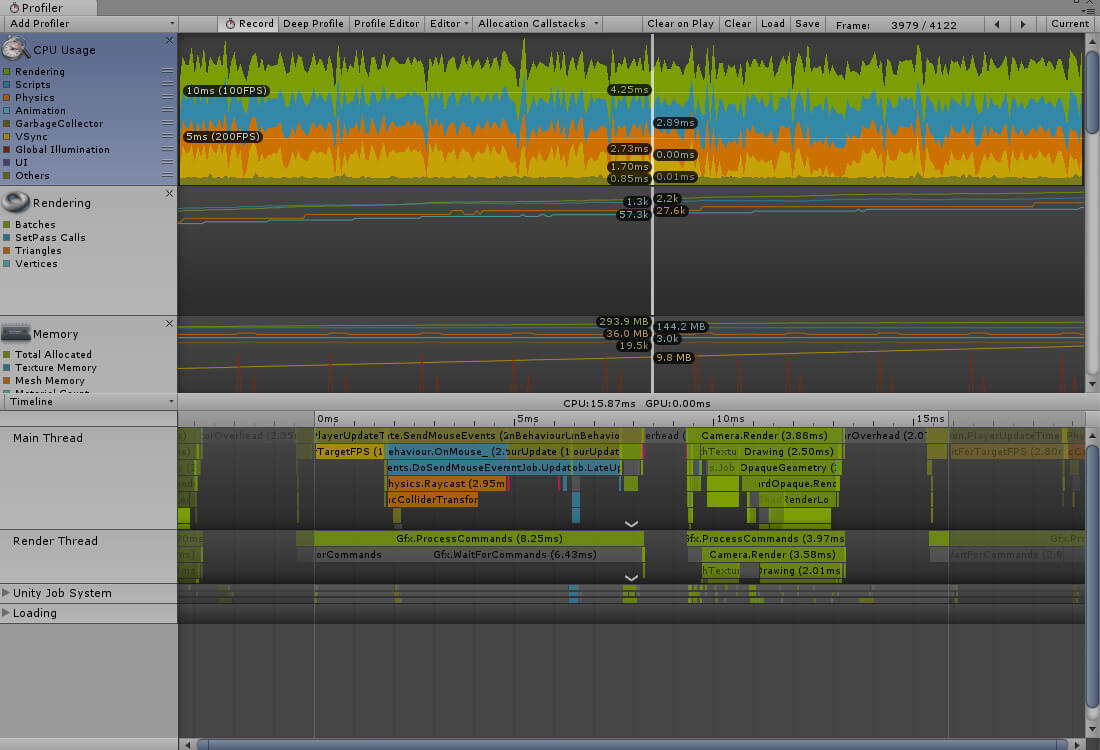
Figure 17: Unity Profiler while using jobs. Time to finish script functions is now 2.89 ms.

Notice how when using jobs, the amount of time the CPU takes to complete the task is cut almost in half. The difference is even more noticeable when increasing the number of cubes to spawn. On my computer, when increasing the number of cubes to 10,000 and not using jobs, the process could take 18 ms. Utilizing jobs in the same set of circumstances brought that time down to 13 ms. Of course, how much of a performance improvement one sees can depend on their individual CPU and what its capabilities are. Regardless, there’s no denying the improved performance that came once C# jobs entered the picture.

Figure 18: The finished project in action.

Conclusion

Multi-threaded code offers better performance to the developer though can be difficult to write. Thanks to Unity Technologies’ latest offerings, creating multi-threaded code is more easily achievable for the developer. Though situations demanding the C# job system may vary, the performance boost it can bring is immense. Another new tech for Unity, the Entity Component System, can also be utilized to further increase performance. ’Performance by default’ is the tagline for Unity 2018, and it’s easy to see why.

Some examples of where the job system can be put to great use include battle simulators, ocean simulators, and more. This example shows the job system moving around objects in a scene but can also be used to deform meshes and other tasks. Many tasks with a heavy load on your CPU can be lightened thanks to C# jobs, and it all starts by simply creating a struct and inheriting from a job interface.

The post Introducing the Unity Job System appeared first on Simple Talk.


from Simple Talk https://ift.tt/2xnk6La
via

Monday, September 17, 2018

Power BI Introduction: Publishing Reports to the Power BI Service — Part 8

The series so far:

  1. Power BI Introduction: Tour of Power BI — Part 1
  2. Power BI Introduction: Working with Power BI Desktop — Part 2
  3. Power BI Introduction: Working with R Scripts in Power BI Desktop — Part 3
  4. Power BI Introduction: Working with Parameters in Power BI Desktop — Part 4
  5. Power BI Introduction: Working with SQL Server data in Power BI Desktop — Part 5
  6. Power BI Introduction: Power Query M Formula Language in Power BI Desktop — Part 6
  7. Power BI Introduction: Building Reports in Power BI Desktop — Part 7
  8. Power BI Introduction: Publishing Reports to the Power BI Service — Part 8

Power BI Desktop plays a pivotal role in the Power BI suite of tools, which is why it’s been the focus of much of this series. If you’ve been following along, you learned how to import and transform data, build reports and visualizations, incorporate R scripts, navigate the Power Query M formula language, and perform a variety of other tasks.

Although there is still much more you can do in Power BI Desktop, the ultimate goal is always the same—to build visually rich reports that provide stakeholders with actionable insights into the underlying data.

But building reports is only part of the equation. You must also make these reports available to the people who depend on the information they provide. For this, you need to publish the reports to the Power BI service or save them to Power BI Report Server (if you have a Power BI Premium subscription). Although you can share Power BI Desktop .pbix files with other users, this is not nearly as effective as disseminating the reports through one of the appropriate channels.

In this article, you’ll learn how to publish a report to the Power BI service and work with the published report through the Power BI interface. The article steps you through such tasks as viewing and updating the report, saving report components to a dashboard, and creating a new report based on the published dataset. You’ll also learn how you can update the report in Power BI Desktop and then republish it to the Power BI service.

Publishing to the Power BI Service

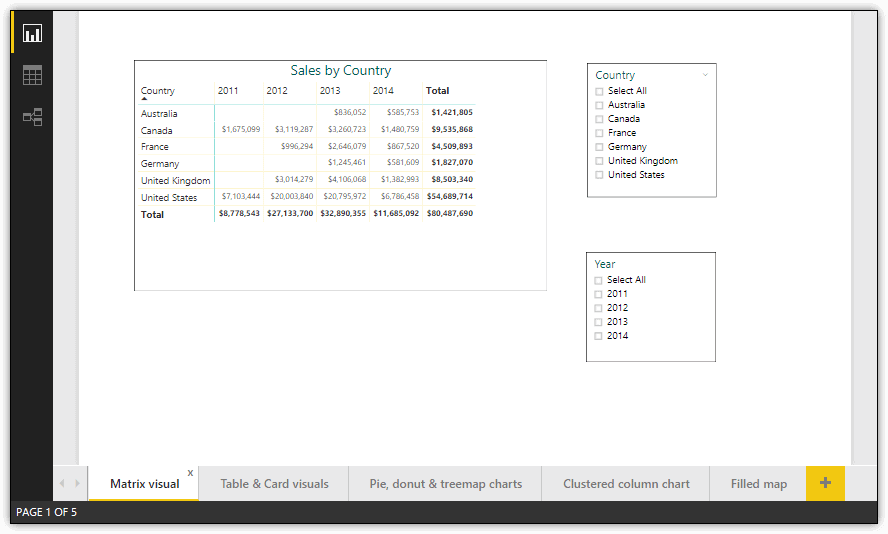
The examples in this article are based on the report file created in the previous article in this series, Building Reports in Power BI Desktop — Part 7. On my system, I named the report SalesRepOrders, which is the name used in the examples to follow. Figure 1 shows the report’s Matrix visual page as it appears in Report view. The report is made up of five pages, with visuals on each page.

Figure 1. Viewing the SalesRepOrders report in Power BI Desktop

NOTE: To make it easier to follow along with this article, rename your visuals to match Figure 1 if you didn’t name them when creating the report in the previous article.

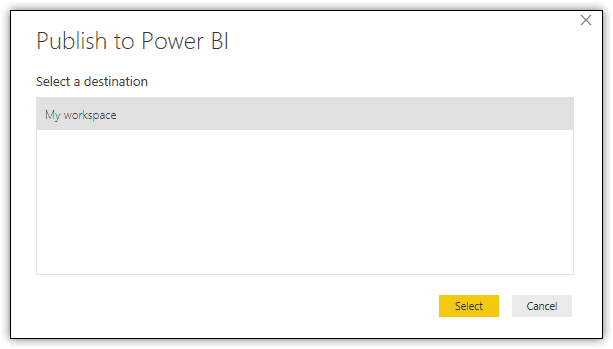
To publish the SalesRepOrders report to Power BI, go to the File tab, point to Publish, and click Publish to Power BI. If you’re not already signed into the Power BI service, you’ll be prompted to provide your login credentials. Once you’re connected, you’ll then be prompted to choose a destination. Select the My workspace option if it is not selected, and then click Select, as shown in Figure 2.

Figure 2. Publishing the SalesRepOrders report to My workspace

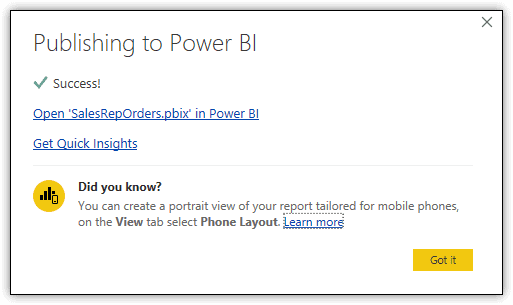
After you select a destination, the Publishing to Power BI dialog box will appear showing the publishing status. Ultimately, you should receive a Success! message, preceded by a green checkmark, as shown in Figure 3. The dialog box also displays a Do You Know? message that provides a tip about using the Power BI service.

Figure 3. Verifying publication of the SalesRepOrders report

If you want to access the published report immediately, click the link Open ‘SalesRepOrders.pbix’ in Power BI. This will launch the Power BI service in your system’s default browser. You might again be prompted for login credentials.

If you want to go to the Power BI site and automatically generate insights in the process, click the second link, Get Quick Insights. Insights are interactive visualizations that Power BI generates on demand. I’ve had mixed success when using this link.

If you don’t want to connect to the Power BI service at this time, click the Got it button to close the dialog box.

Working with Reports in Power BI

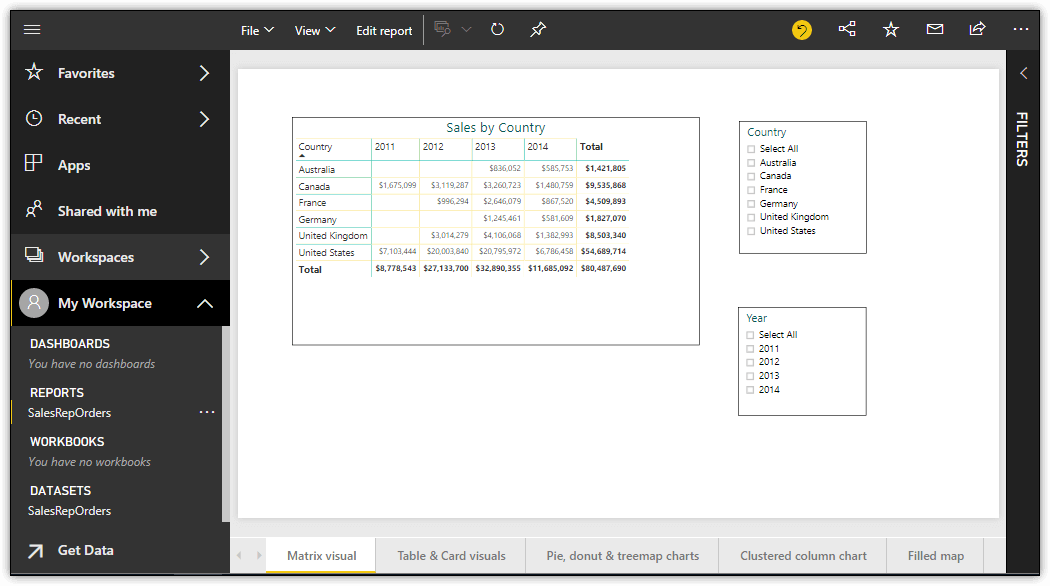
You can access your published report through the Power BI site from any supported browser. For example, I’ve been able to access the site from Chrome and Edge in Windows and from Chrome and Safari in macOS. When you sign in, you’re taken to a development interface that provides the tools necessary to import and visualize data. Figure 4 shows the interface after publishing the SalesRepOrders report file.

Figure 4. Viewing the SalesRepOrders report in the Power BI service

The SalesRepOrders report and dataset are listed in the My Workspace section in the left pane. (You might have to expand this section after signing into the service.) The My Workspace section is your personal work area for accessing and modifying your own dashboards, reports, and datasets.

From the My Workspace section, you can access resources in any of the following four categories:

  • Dashboards: Canvases for presenting data through tiles or widgets. A dashboard can be associated with only one workspace, but it can display visualizations from multiple datasets or reports. If you’re a Power BI Pro or Premium subscriber, you can also share dashboards.
  • Reports: Collections of visualizations based on data in the defined datasets. A report can be associated with only one workspace, but it can be associated with multiple dashboards within that workspace. You can interact with a report either in Reading view or Editing view, depending on your granted level of permissions. Each report is made up of one or more pages.
  • Workbooks: Special types of datasets created by uploading Microsoft Excel files to the Power BI service. You can upload an Excel file from within the Power BI service or by publishing the file directly from Excel. The workbook data requires no special formatting. This is different from importing an Excel file, which adds the dataset to the Datasets category. To import an Excel file, the data within the file must be formatted as an Excel table.
  • Datasets: Collections of related data that you import or connect to. A dataset is similar to a database table and can be used in multiple reports, dashboards, and workspaces. You can retrieve data from files, databases, online services, or Power BI apps published by other people in your organization.

In Figure 4, the SalesRepOrders report in the Reports section is selected, with the report contents displayed in the main window. In this case, the Matrix visual page is selected, but you can choose any of the other pages to view those visuals, just like you saw in Power BI Desktop.

From the main Reports window, you can carry out several operations, such as saving a copy of the report, refreshing the data, sharing the report, or pinning the page to a dashboard which is covered later in the article.

By default, Power BI displays the report in Reading view. If you have the proper permissions, you can also work with the report in Editing view. To get into Editing view, click the Edit report button at the top of the window. This allows you to modify the report and visualizations directly within the Power BI interface.

Updating a visualization in the Power BI service is much like updating a visualization in Power BI Desktop, as shown in Figure 5. Notice that Editing view includes both the Visualizations pane and Fields pane.

Figure 5. Editing the SalesRepOrders report in the Power BI service

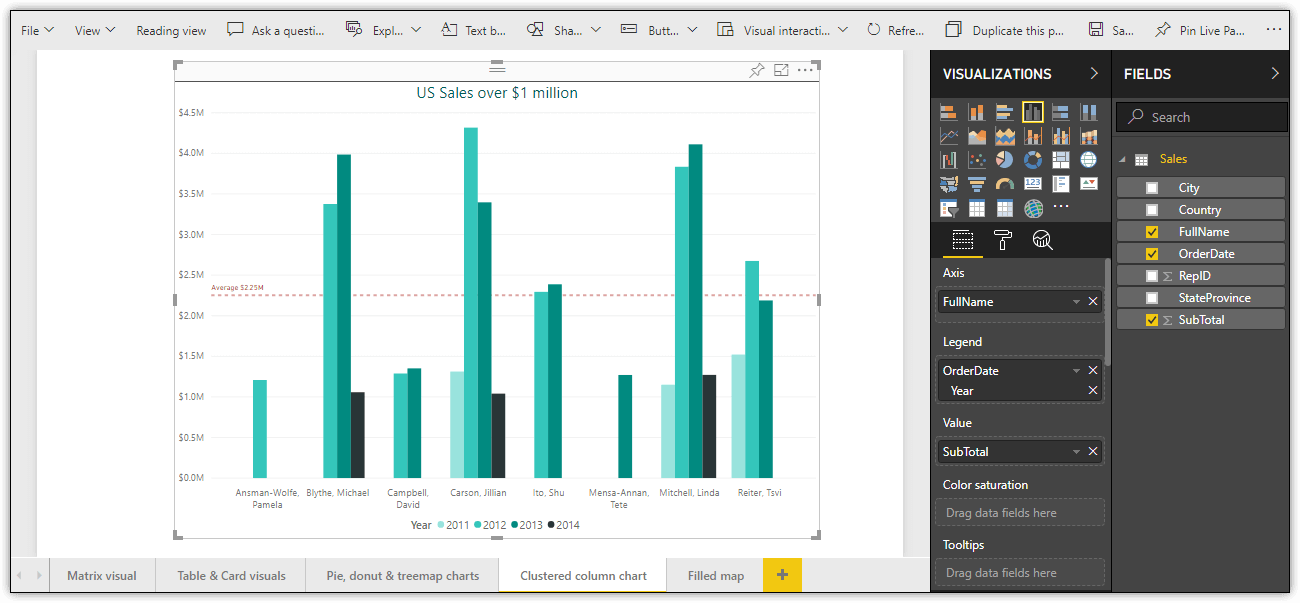
A simple way to test the editing features is to update the report’s Clustered column chart visual to display sales greater than $2 million, rather than $1 million. To update the visual, first make sure you have selected it and then expand the SubTotal column in the Filters section of the Visualizations pane, change the 1000000 value to 2000000, and click Apply filter.

You can then save the report under the same name or save it to a different name using the options available to the File menu at the top of the design surface. (On my system, I saved the report to a different name so the original report remained unchanged.)

In addition to updating the visualizations, you can also modify the report itself. For example, you can insert a shape, button, text box, or Ask a question section. You’ll find the tools for making these changes at the top of the design surface.

Updating and Republishing Reports

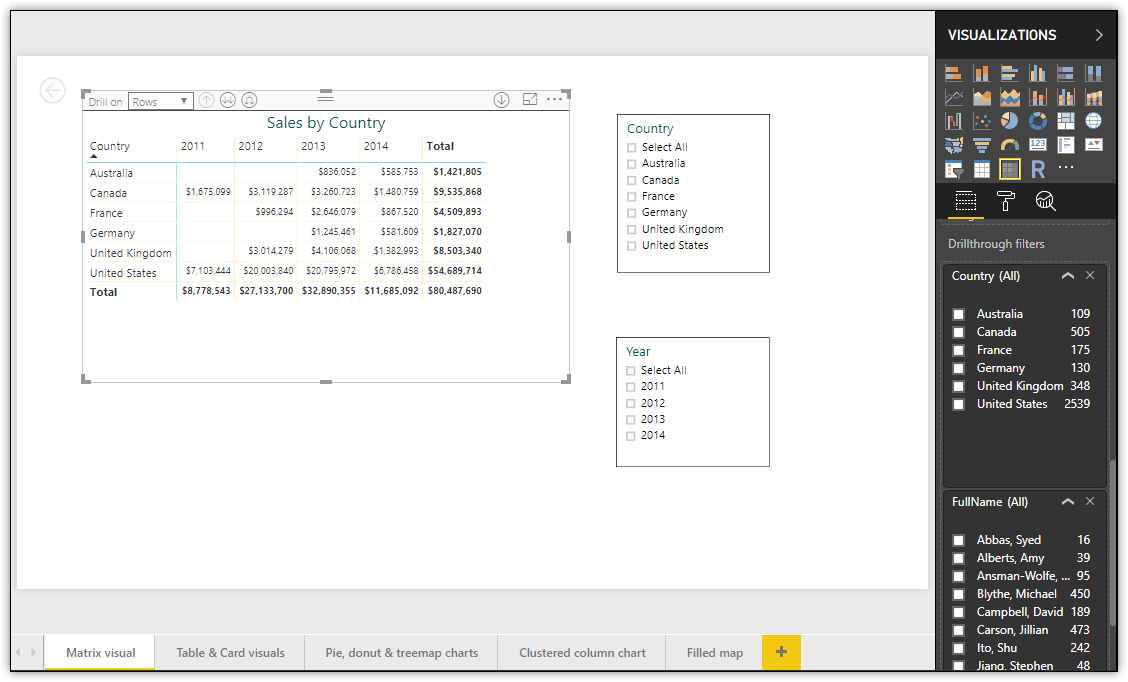
Rather than updating reports directly within the Power BI service, you might prefer to modify them in Power BI Desktop and then republish them to the Power BI service. For example, suppose you want update the SalesRepOrders report by adding drillthrough filters to the Matrix visual, using the Country and FullName columns for the filters, as shown in Figure 6.

Figure 6. Updating the Matrix visual in Power BI Desktop

To add the drillthrough filters, select the Matrix visual and then drag the Country column from the Fields pane to the Drillthrough section of the Visualizations pane. Next, drag the FullName column to the Drillthrough section, just below the Country column.

Drillthrough filters make it possible for users to access one report based on values in another report. Because the Country and FullName columns have been added as drillthrough filters for the Matrix visual, users will be able to access the visual directly from other visuals that include Country or FullName values. Power BI automatically filters the Matrix visual by the selected country or sales rep name. (You’ll see this in action in just a bit.)

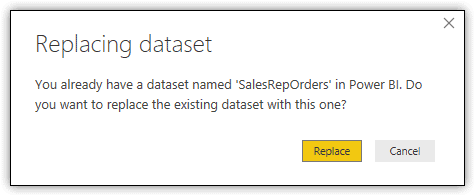
After you’ve updated and saved the report in Power BI Desktop, you can publish it to the Power BI service just like you did before, except that you’ll be prompted to verify that you’re replacing the existing dataset, as shown in Figure 7. To confirm the update, click Replace.

Figure 7. Republishing the SalesRepOrders report to the Power BI service

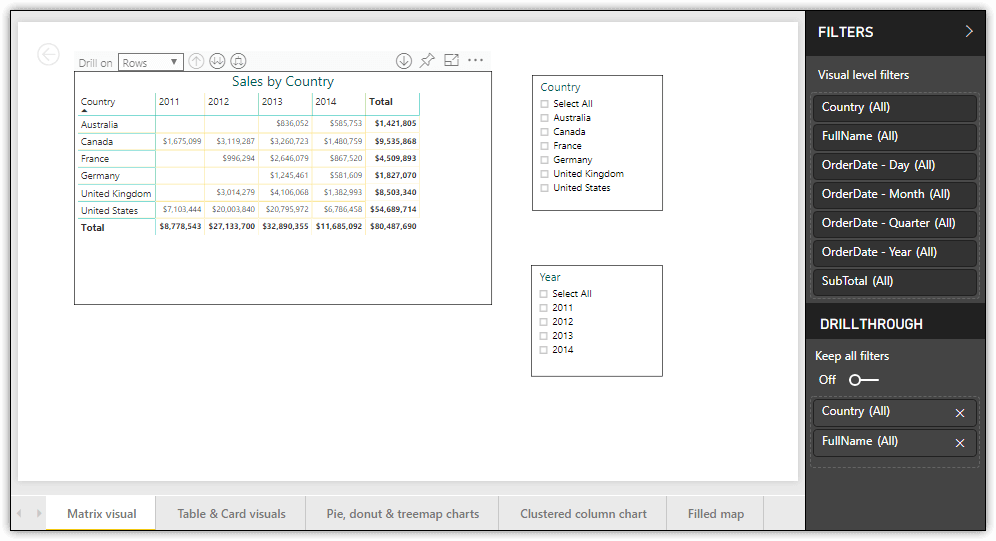
Although the wording of the Replacing dataset dialog box is specific to the SalesRepOrders dataset, the report itself is also updated in the Power BI service. You can verify this by returning to the Power BI service and viewing the Matrix report, which should now look similar to the one shown in Figure 8. (You might have to refresh the web page.) Notice that the Drillthrough section of the Filters tab now lists the Country and FullName columns as drillthrough filters.

Figure 8. Viewing the updated report in Power BI

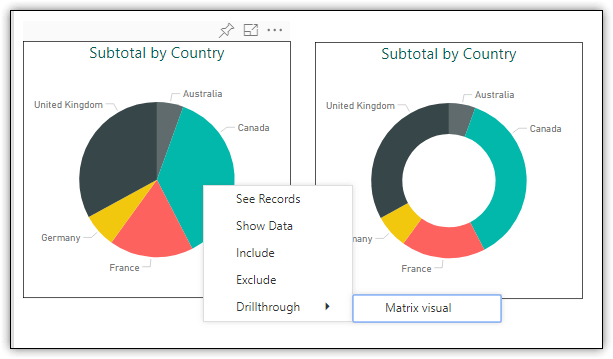
To test the drillthrough feature, go to the Pie, donut and treemap chart page, right-click the Canada section on the Pie chart visual, point to Drillthrough, and then click Matrix visual, as shown in Figure 9.

Figure 9. Drilling through to the Matrix visual in Power BI

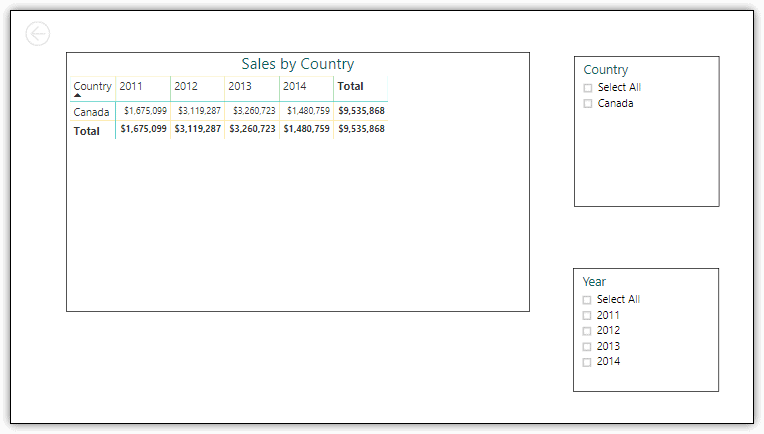
When you click the Matrix visual option, Power BI takes you to the Matrix visual page, with the data filtered by Canada, as shown in Figure 10. Notice that Canada is also the only country listed in the Country slicer.

NOTE: If your Matrix Visual report shows quarters and/or months, select Columns from the Drill on list and click the up arrow. You may also need to remove the Year filter.

Figure 10. Viewing Canadian sales in the Matrix visual

Next, you’ll test drilling through to the Matrix visual from a sales rep value. First, you must clear the drillthrough filter on the Matrix visual. To do so, make sure the Matrix visual is still selected, expand the Country column in the Drillthrough section of the Filters tab, and then clear the Canada checkbox. Next, go to the Clustered column chart page. On the visual, right-click the 2012 bar for Jillian Carson, point to Drillthrough, and then click Matrix visual.

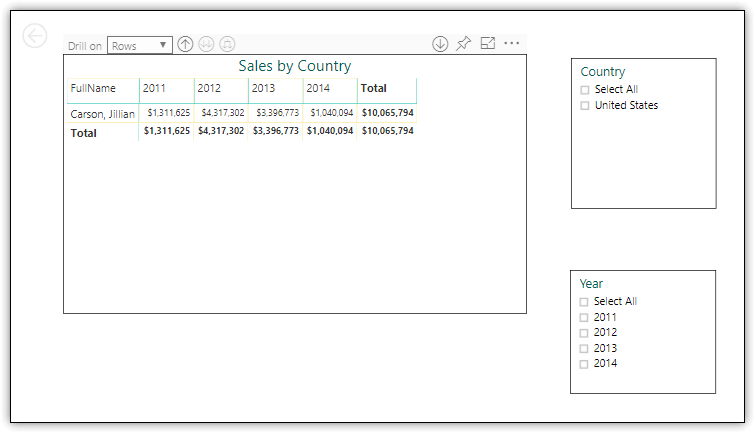
When the Matrix visual appears, the matrix will include only a row for the United States, the country where Jillian Carson resides. Click the double down-arrow button with the pop-up label that reads Go to the next level in the hierarchy. Jillian Carson’s sales data should now be displayed in the Matrix visual, as shown in Figure 11.

Figure 11. Viewing sales rep data in the Matrix visual

When you accessed the Matrix visual from the Clustered column chart visual, Power BI retained all sales data for Jillian Carson, even though you clicked the 2012 bar. However, you can limit the data to the year as well when accessing the Matrix visual through a drillthrough filter.

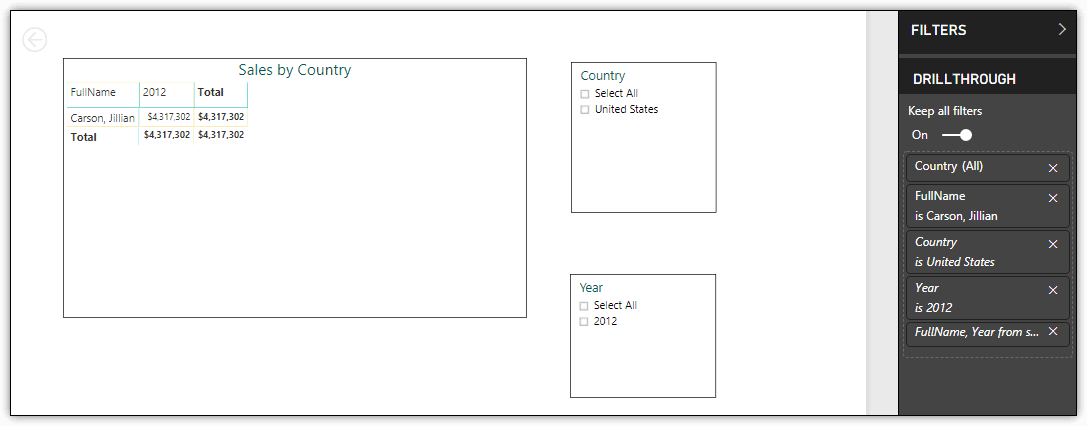
To demonstrate how this works, ensure that the Matrix visual is selected and then, in the Drillthrough section of the Filters tab, enable the Keep all filters option. Next, go to the Clustered column chart visual and again use the drillthrough feature to access the Matrix visual. This time, only the data for year 2012 is displayed, as shown in Figure 12.

Figure 12. Retaining filters when drilling through to a visual

As you can see, the Matrix visual and Year slicer now include only the year 2012. Not only does this demonstrate how the drillthrough capabilities work in Power BI, but also how you can update a visual in Power BI Desktop and republish the report file to the Power BI service, without having to take any steps within the Power BI service.

Pinning Reports to a Dashboard

When you publish a report file to the Power BI service, only the report and its datasets are added to the service. If you want to include report components on a dashboard, you must specifically pin them to the dashboard.

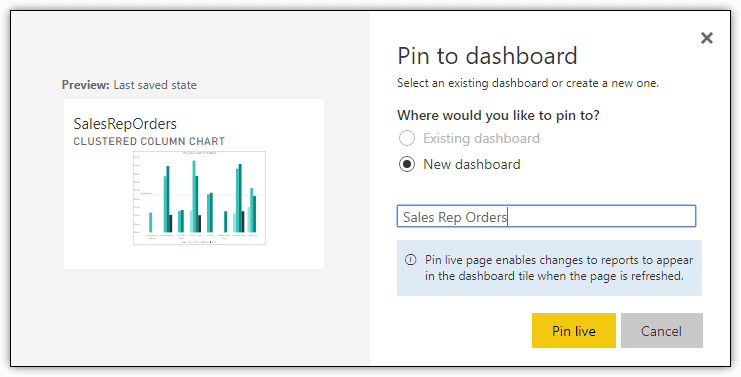
You can pin report items on a page-by-page basis directly within the report. For example, to add the Clustered column chart page to a dashboard, go to that page and click the Pin Live Page button at the top design surface. When the Pin to dashboard dialog box appears, you can choose to add the page to an existing dashboard or to create a new dashboard, as shown in Figure 13.

Figure 13. Pinning a report page to a new dashboard

If you choose the Existing dashboard option, you must then select the dashboard from a drop-down list. If choose the New dashboard option, you must provide a name for that dashboard. In Figure 13, a dashboard named Sales Rep Orders will be created.

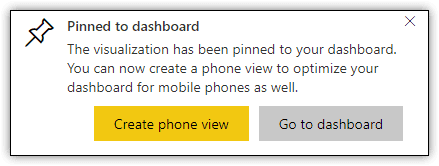
After you select the dashboard or type the new name, click Pin live. When the Pinned to dashboard dialog box appears, click Go to dashboard, as shown in Figure 14. Later you’ll see how you can set up your dashboard for a smartphone as well as a web page.

Figure 14. Creating a phone app version for the dashboard

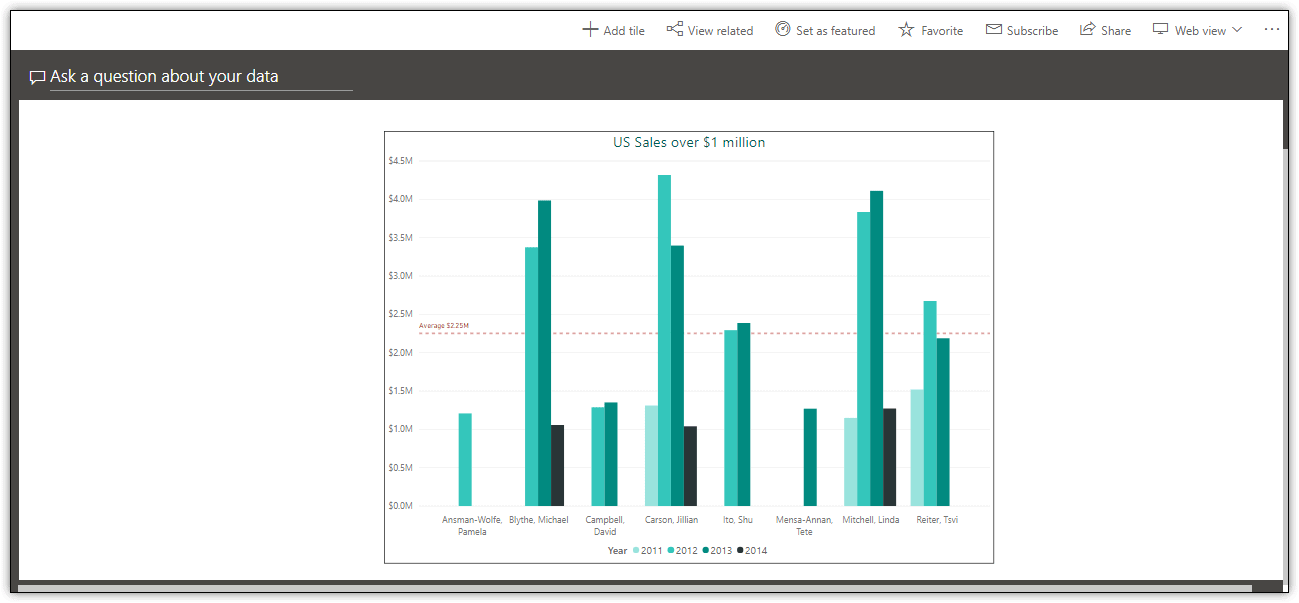
By default, Power BI displays the dashboard in Web view, as shown in Figure 15. The report page is added as a tile to the dashboard. You can resize or reposition the tile, edit details about the tile, and carry out other steps.

Figure 15. Viewing the Bar Chart visual in web view

You can also make changes to the dashboard itself. For example, you can apply a different theme, refresh the tiles, or remove the Ask a question section. You can also switch to Phone view.

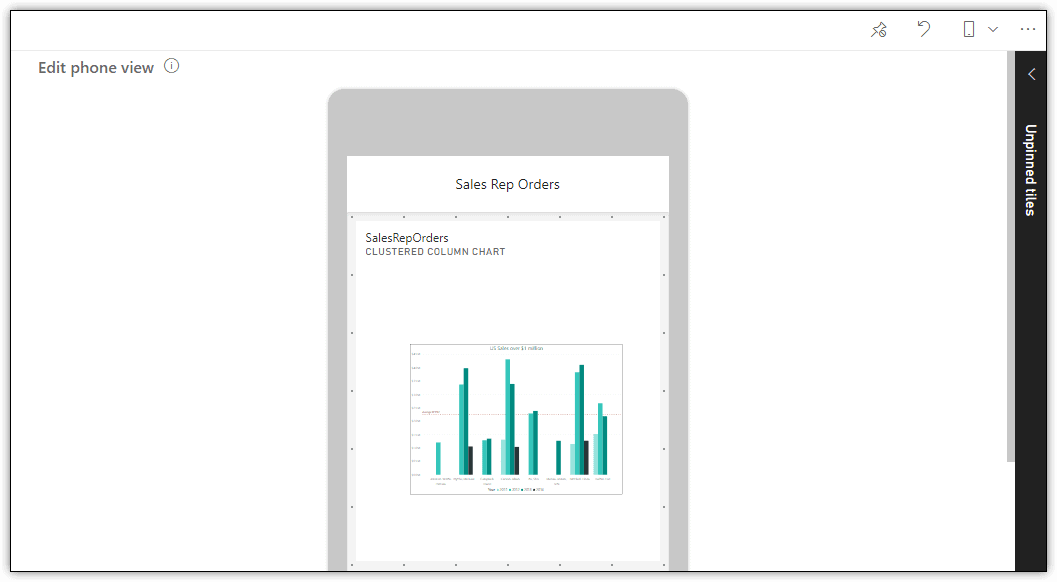
Phone view provides an approximation of what your dashboard will look like on a smartphone. To go to Phone view, click the Web view down arrow and then select Phone view. When you first select Phone view, you’ll receive a message about viewing the tiles as they appear on a phone. Simply click Continue. You’ll then be taken to Phone view, as shown in Figure 16.

Figure 16. Viewing the Bar Chart visual in phone view

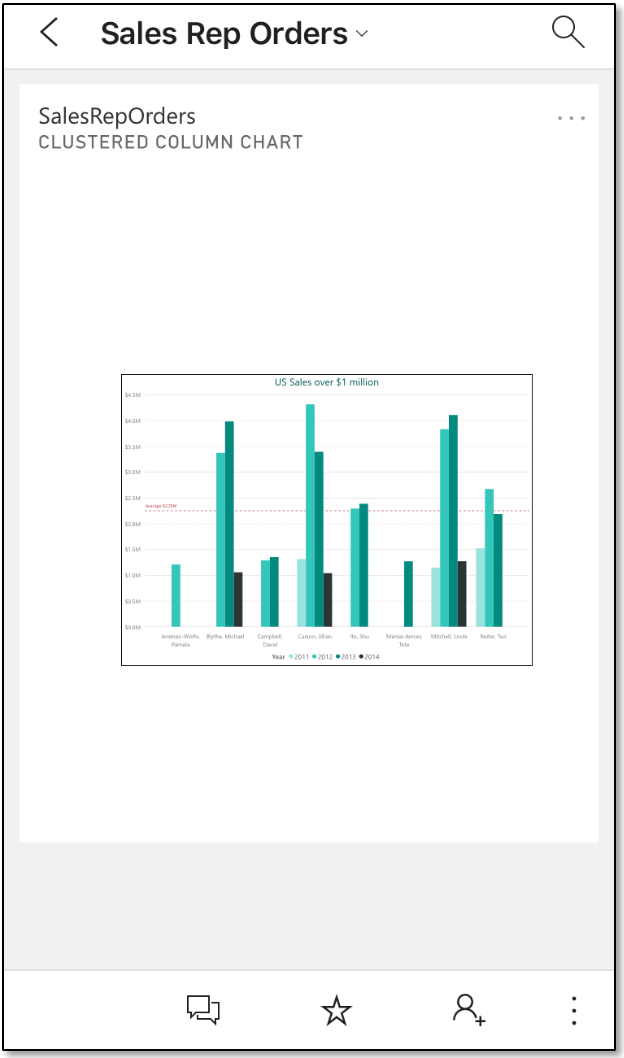
In Phone view, you can resize and reset tiles, but you can do little else. Even so, it should give you a good sense of how the dashboard will look on a smartphone. You can also view the dashboard in the Power BI app on a mobile device. For example, Figure 17 shows the Clustered column chart tile of the Sales Rep Orders dashboard on an iPhone.

Figure 17. Viewing the dashboard report on an iPhone

There is, of course, a lot more you can do with the report and dashboard features in the Power BI service than what’s been covered here. I encourage you to play around with the individual features as much as possible. The more time you spend with them, the better you’ll be able to leverage their capabilities to effectively visualize data.

Creating Reports from a Dataset

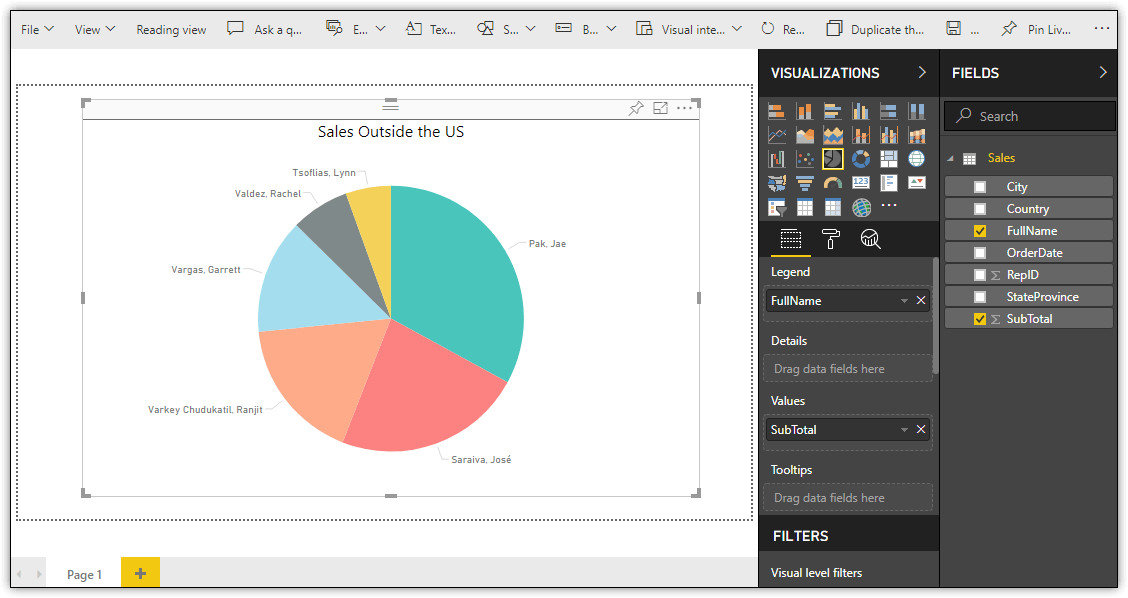
In Power BI, you can also work directly with the datasets that you publish to the Power BI service. To access the SalesRepOrders dataset, select it in the Datasets category of the My Workspace section in the left pane. This will take you to a workspace similar to Report view in Power BI Desktop, where you can create a report and add pages and visualizations. For example, Figure 18 shows a Bar chart visual that I created based on the SalesRepOrders dataset

Figure 18. Creating a Bar chart visual based on the SalesRepOrders dataset

After you add the necessary pages and visualizations, you can save the report to the Power BI service, using the options available in the File menu. You can then access the report from the Reports category in the My Workspace section, just like the SalesRepOrders report.

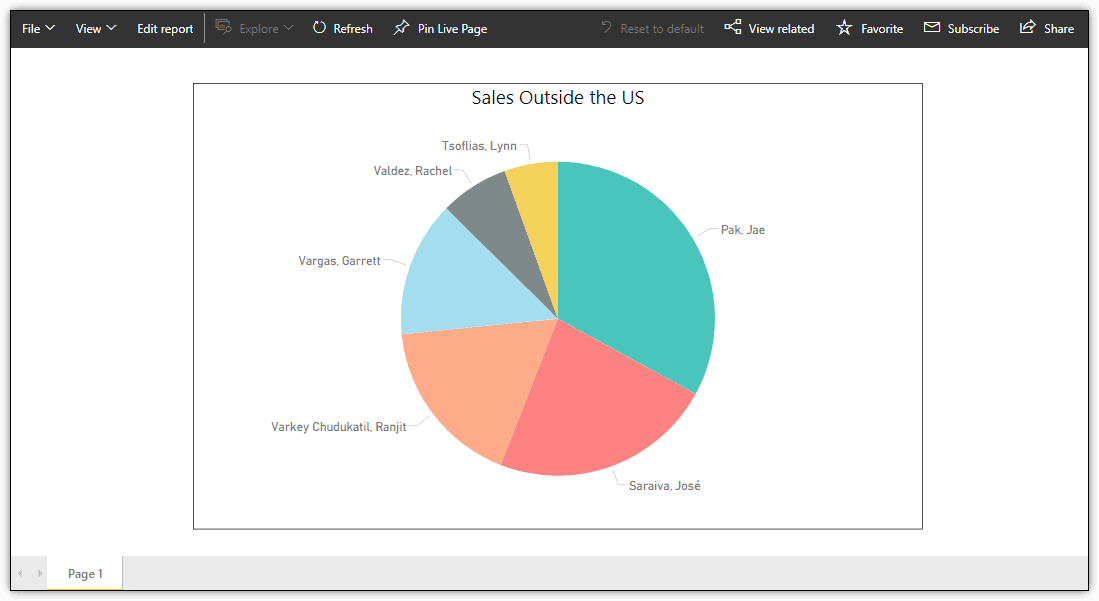
For this example, I saved the report shown in Figure 18 as SalesOutsideUS. I then accessed the report from the Reports category, as shown in Figure 19. When you create a report in this way, you can pin the report pages to a dashboard, along with pages from other reports.

Figure 19. Viewing the SalesOutsideUS report in the Power BI interface

Being able to create reports directly from a published dataset provides you with even greater flexibility when working with the Power BI service. This can be especially beneficial when collaborating with other users to build reports and visualizations for your organization and other stakeholders.

Moving Beyond the Power BI Basic Service

The features covered in this article are all available as part of the Power BI Free service level. To use such features as sharing, collaboration, auditing, and auto-refresh, you (or your organization) must sign up for the Power BI Pro service. If your organization requires dedicated resources for deploying Power BI at scale, you’ll need a Power BI Premium subscription.

Even at the Free service level, you can learn a lot about Power BI and its capabilities, especially when used in conjunction with Power BI Desktop. But Power BI is not just about the service and desktop application. The Power BI suite also includes the Power BI mobile apps, Power BI Report Server, and the Power BI API, with the promise of more components to come.

Microsoft also positions Power BI as part of something much larger called the Microsoft Power Platform (or Business Application Platform or whatever happens to be Microsoft’s branding de jour). Not only does the platform include Power BI, but also PowerApps, Microsoft Flow, and perhaps Microsoft Stream, although it’s not clear exactly which components are included or how they fit together. Even so, Power BI is a force to be reckoned with in its own right, and I suspect we’ll be hearing a lot more about Power BI in the days to come.


The post Power BI Introduction: Publishing Reports to the Power BI Service — Part 8 appeared first on Simple Talk.


from Simple Talk https://ift.tt/2xnVRg5
via

Thursday, September 13, 2018

Exhuming the GDPR Bodies

GDPR regulation came into full force on May 25th, 2018. That date represents the end of a two-year ‘running in’ period. It was, if you like, the end of the beginning.

Naturally, most of the attention has fallen on databases, as the area of highest risk for data at rest, but is this necessarily true? The corporate file servers and the file shares that reside on them can contain an immense amount of data in many non-database formats. In this article, I am going to describe at how you can uncover sensitive and personal data buried in network file shares and assess the level of risk this poses to your organisation, using tools such as Apache Tika, Bash and PowerShell.

What Is the Problem with File Shares?

Consider some of the facilities that an RDBMS gives us that a file share does not:

  • A focal point of where data resides

  • A structure optimized for that data

  • Enforcement of that structure

  • Relative clarity of what that structure represents

  • The means to capture documentation of that structure through tools such as Redgate SQL Doc

  • A simple means of interrogating the contents and structure of the database through the SQL language

The mindset that goes with administration and development of an RDBMS lends itself to data categorisation, and to structures that support such activity.

A file share gives us none of those things. It is akin to having a large garage or attic into which to stuff things that might be useful one day but will probably never be used. How many of us have said to a colleague “I know that I have it in a file somewhere, but I can’t quite find it right now?” This is why I believe that many businesses need someone with skills similar to those of a librarian, whose job it is to build data catalogs that include file shares as a data source.

Quantifying the Risk Posed by File Shares

To quantify the risk, we must find answers to the following questions:

  • What types of file do we have?

  • Where do they reside?

  • Are those files still in use or is there a legal obligation to keep them?

  • Who is currently responsible for those files?

  • Do they contain GDPR sensitive data?

Expect to find a substantial number of old files for which there is no known use and no current owner. There may even be no easy way to open those files, due to their obsolescence. GDPR represents a rare opportunity for digital decluttering.

In some cases, I can answer the risk questions posed above with an acceptable degree of accuracy. In others, I can only give a warning that further, more detailed, investigation needs to take place. For example, if I discover a zip file or a password protected file, then I can acknowledge its existence but further investigation, beyond my scope of operation, would be needed.

Preparation Before Investigation

If I must assess all corporate file shares for sensitive data, then the nature of the task means that both I, and my workstation, present a potential security risk. The approach taken to mitigate such a risk could be:

  • The creation of a specific virtual workstation for the task

  • Minimize software on the virtual workstation. No internet access, no email, etc.

  • The creation of a specific login for me to use to access the workstation and to carry out that work

  • Enhanced auditing of the workstation and my login

  • Strict timeboxing of the work.

The toolkit for my virtual workstation was primarily Bash and Powershell, to identify and locate the files, and Apache Tika to look inside those that may contain sensitive or personal data.

Bash and PowerShell?

I use both shells because each one has unique strengths:

  • PowerShell is useful when interacting with objects

  • Bash is useful when handling text streams

Limiting use to one shell risks a solution that succumbs to the tyranny of “or,” rather than the genius of “and.” However, I did find some difficulties with a PowerShell-only solution. For example, it does not have a suitable Sort command for the contents of a text file. Community modules exist, though I found them somewhat clunky. I also found that some PowerShell commands did not accept data piped through to them, requiring me to adjust the process to write an intermediate file. Given the size of the task, I was reluctant to do this. Therefore, I use Windows subsystem for Linux so I can use the shell that is appropriate to the task at hand.

On my workstation, the Linux subsystem lists drives mapped under Windows within the Linux /mnt folder. The C:\ drive will be /mnt/c. The Linux subsystem can use Windows file shares directly, without the need to map those shares to a Windows drive first, but I like being able to capitalize on the strengths of both Windows and Linux, so the mapped drive technique meets my needs, and the technique for doing this is described in the example below. On my PC, I have a share, called \\DadsPCJune2014\Chapter05, which contains files from one of Ivor Horton’s “Beginning Java” books. Within the Linux subsystem, I create a folder that used to access that share.

sudo mkdir -p /mnt/java_tutorial/chapter05

The Linux mkdir command is very close to the Windows equivalent. The -p option ensures that all folders in the path are created if they do not exist already. The Windows share can now be attached to that directory as follows:

sudo mount -t drvfs '\\DadsPCJune2014\Chapter05' /media/java_tutorial/chapter05/
# Try a directory listing
# -l = a line per file
# -h = include human readable file size
ls /media/java_tutorial/chapter05 -hl

What File Types Do We Have?

I worked by mapping the network shares to an explicit drive letter on my secure virtual workstation. Using PowerShell, I can count the files by their extension, most frequent first:

# Powershell
Get-Childitem c:\ -Recurse | where { -not $_.PSIsContainer } | group Extension -NoElement | sort count -desc > c:\users\gdpr_dave\count_by_extension.txt

I can perform a similar task using Bash, retrieving the extensions in alphabetic order:

find . -type f|awk -F "/" '{print tolower($NF)}'|grep -F .|sed -n 's/..*\.//p'|sort|uniq -c > $HOME/extension_count.txt

Bash is a little harder, so here’s a brief description of what the above command does:

  • Find all files below the current location

  • Use awk to split the file name and path by the / folder separator and output the last part (the file) in lower case

  • Filter out anything that does not contain a “.” as this indicates the presence of an extension

  • Replace anything before the “.”

  • Sort the results

  • Provide a unique count

The intention is to exclude any files without an extension, such as the multiple small files generated by git.

We can import the resulting files into Excel and cross-reference the entries to https://en.wikipedia.org/wiki/List_of_filename_extensions. By combining the two information sources, we can add a column to indicate whether a particular file type could contain GDPR sensitive data.

How Old Are My Files?

The Windows operating system presents us with three file dates, but these present some challenges when assessing the age of the file.

Date

Description

Created

The date that the file was created at its current location. If I copy a file to a target folder today, then the date and time I performed the copy will be the creation date

Modified

The date that the file was created, or last modified. If I copy the file to another location, then the modified date is retained giving the appearance that a file was modified before it was created.

Last Accessed

By default, this is the same as the Modified date and not the true date and time the file was last accessed. We can switch on the last access tracking, but it is next to useless if the Windows GUI is used as the act of examining the property results in the property being set to the current date/time.

In short, the file dates available through the Windows operating system are flawed, so we have to consider both the created and modified dates, separately.

For the purpose of evaluating file shares, I mapped a share to a drive letter and used two PowerShell modules to find the oldest and youngest file, in each folder within the share.

Get-OldestYoungestItemInfolder.ps1

The module shown below produces tab-delimited output which we can pipe into a file for import into SQL Server using bcp, BULK INSERT or appropriate ETL tool.

The code evaluates the file creation date. If we wanted to use the file modified date, then we would change CreationTime to LastWriteTime.

[cmdletbinding()]
param([string]$Foldername='.',[string]$DesiredDate='CreationTime')
$file_eariest_date = [DateTime]::MaxValue
$file_latest_date = [DateTime]::MinValue
$earliest_file_name=""
$latest_file_name=""
$number_of_files = Get-ChildItem -Path $Foldername -File -Force|Measure-Object|%{$_.Count}
$items = Get-ChildItem -Path $Foldername -File -Force|sort $DesiredDate|Select -First 1 -Last 1
$file_eariest_date = $items[0].$DesiredDate
$file_latest_date = $items[$items.Count -1].$DesiredDate
$earliest_file_name = $items[0].Name
$latest_file_name = $items[$items.Count -1].Name
Write-Output "$FolderName't$($number_of_files)'t$('{0:yyyy-MM-dd}' -f $file_eariest_date)'t$('{0:yyyy-MM-dd}' -f $file_latest_date)'t$($earliest_file_name)'t$($latest_file_name)"

Get-OldestYoungestItemRecursive.ps1

Our second module recurses down through the folder structure, calling our first module for each folder.

[cmdletbinding()]
param([string]$Foldername='.',[string]$DesiredDate='CreationTime')
Get-ChildItem -Path $Foldername -Directory -Recurse|Where-Object{$_.GetFiles().Count -gt 0}|ForEach-Object{Get-OldestYoungestItemInFolder.ps1 $($_.FullName)}

Let us suppose that we mapped a file share to the M:\ drive then we might pipe output to a file as follows:

Get-OldestYoungestItemRecursive.ps1 M:\ CreationTime >C:\Users\gdpr_auditor\Share_CreationTime.txt
Get-OldestYoungestItemRecursive.ps1 M:\ LastWriteTime >C:\Users\gdpr_dave\Share_LastWriteTime.txt

Even these simple lists of folders and dates can reveal opportunities to remove obsolete information.

Where Are My Files?

We know what files we have, and the oldest and youngest file, in any folder. For file types that are likely to hold sensitive data, we must identify where they are held.

For any folder, we want to traverse down through all its subfolders listing those that contain a file with the desired extension. The Get-FileTypeLocation.ps1 PowerShell module below achieves this:

[cmdletbinding()]
param([string]$Foldername='.',[string]$FileExtensionPattern='xls')
Get-ChildItem $Foldername -Recurse -Include *.$FileExtensionPattern|Sort-Object DirectoryName|%{Write-Output $_.DirectoryName}|Get-Unique -AsString

Given the wide usage of Microsoft Excel across the enterprise, I chose .xls as the default file extension value for which to search. If I pass xl* then I gain a list of directories for XLS, XLM, XLSX, XLSM files, as well.

Using the ‘file share mapped to a drive’ example from earlier in this article, I can pipe the results of my PowerShell module to files:

Get-fileTypeLocation m:\ xl* >C:\Users\gdpr_dave\Share_ExcelLocation.txt
Get-fileTypeLocation m:\ acc* >C:\Users\gdpr_dave\Share_AccessLocation.txt
Get-fileTypeLocation m:\ mdb >C:\Users\gdpr_dave\Share_OldAccessLocation.txt
Get-fileTypeLocation m:\ mde >C:\Users\gdpr_dave\Share_OldAccess2Location.txt

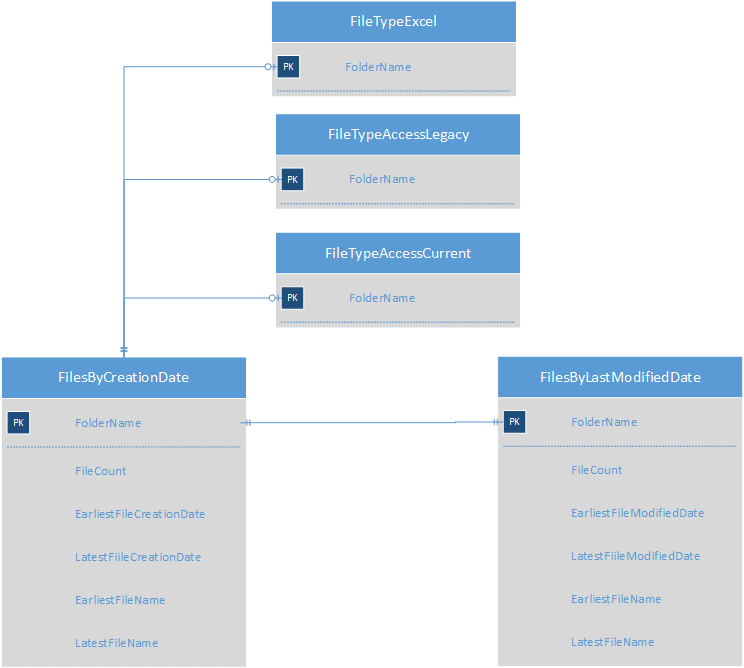
By importing each of these files into SQL Server as separate tables and joining on the folder name, we can get a reasonable approximation of when a folder was last active for file creation or modification, and what types of files are present in those folders.

Which Files Pose a GDPR Risk?

I need to know if my files contain personal names, email addresses, and other sensitive information. Apache Tika provides the mechanism by which we can look inside files, without needing to have the original application used to create those files.

Apache Tika’s origins are as part of Apache Nutch and Apache Lucene, which are a web crawler and index. For such programs to be most effective, they need to be able to look at the contents of the files and extract the relevant material. In other words, they need:

  • Visible content

  • Metadata – such as the XIFF metadata in JPEG images.

Apache Tika supports over 1,400 file formats, which include the Microsoft Office suite and many more that are likely to contain the sort of data we need to find.

Running Apache Tika

Apache Tika is a Java application. Version 1.18 requires Java 8 or higher. It can behave as a command line application or as an interactive GUI.

I downloaded tika-app-1.18.jar into c:\code\ApacheTika\ on my workstation, and ran the following command, to use Tika as an interactive application.

java -jar c:\code\ApacheTika\tika-app-1.18.jar

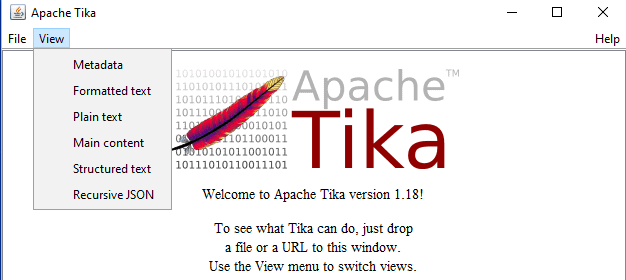
This produces a dialogue as shown below.

The file menu allows a file to be selected and the view menu provides different views of that file. Apache Tika can also be run as a command line application.

java -jar c:\code\ApacheTika\tika-app-1.18.jar -t m:\documents\Blessed_Anthem.docx

The -t switch asked for the output in plain text and resulted in the content shown below:

Mae hen wlad fy nhadau yn annwyl i mi 
Gwlad beirdd a chantorion enwogion o fri 
Ei gwrol ryfelwr, gwlad garwyr tra mad 
Tros ryddid collasant eu gwaed. 
Gwlad Gwlad, 
Pleidiol wyf i'm gwlad, 
Tra môr yn fur i'r bur hoff bau 
O bydded i'r hen iaith barhau

When running as a command line application, Apache Tika offers more facilities than are present in the interactive GUI. For example, the -l switch attempts to identify the language in the file.

java -jar c:\code\ApacheTika\tika-app-1.18.jar -l m:\documents\Blessed_Anthem.docx

This produces cy which is the ISO639-2 language code for Welsh.

Using Apache Tika to Extract Data from Spreadsheets

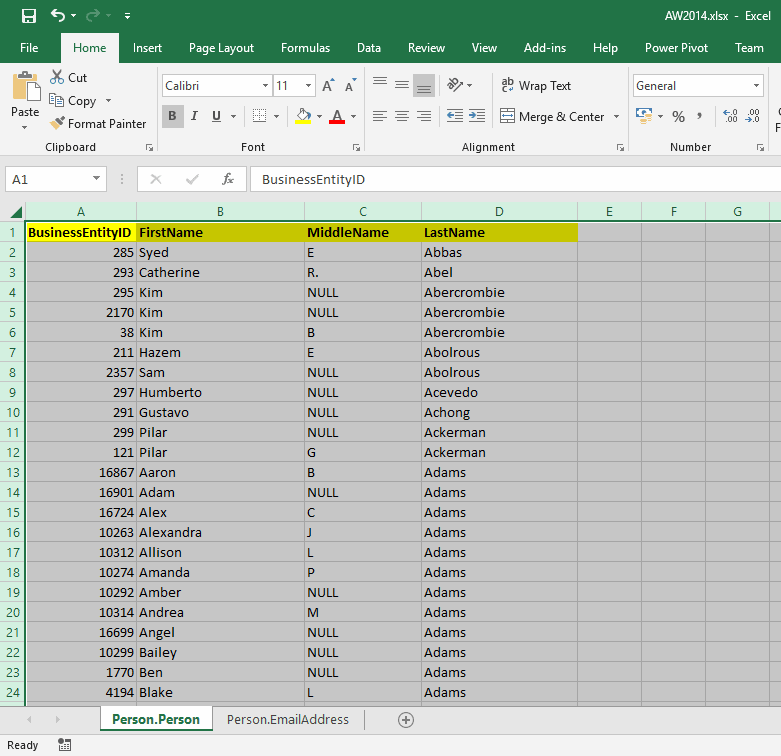
Let’s suppose that, prior to GDPR, the marketing manager at AdventureWorks had decided to run an email campaign involving all AdventureWorks customers. He or she had exported two tables from AdventureWorks2014 to an Excel spreadsheet, as shown below.

The command below would extract the content of the sample spreadsheet to a file called output.txt.

java -jar tika-app-1.18.jar -t C:\Users\david.poole\Documents\SQLServerCentral\Red-Gate\GDPR\Tika\Email_Campaign2014.xlsx>output.txt

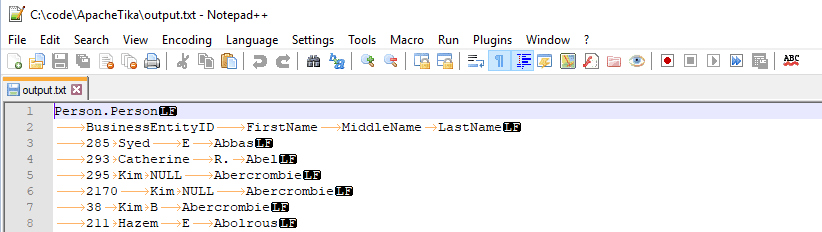
If we were to open that file in Notepad++, we would see something similar to the following:

  • The spreadsheet tab names are against the left-hand margin

  • The spreadsheet rows are indented by one TAB

  • The spreadsheet columns are TAB-delimited

  • The spreadsheet rows are terminated by a line-feed, which is the Unix standard

  • Each sheet terminates with two empty rows.

Apache Tika has successfully extracted the contents from the spreadsheet, so our next task is to determine the steps necessary to identify the fact that it contains the names of people.

Acquiring a Dictionary of First Names

As the security and compliance manager for AdventureWorks, the quickest way to determine if a file contains customer names is to match against a dictionary of first names.

The easiest way to acquire that list of first names is by querying the company customer database. For this I create a view:

CREATE VIEW Person.ForeNameExtraction
AS
SELECT UPPER(REPLACE(FirstName, '.', ''))  AS ForeName
FROM AdventureWorks2014.Person.Person
WHERE FirstName NOT LIKE '% %'
      AND LEN(REPLACE(FirstName, '.', '')) > 3
UNION
SELECT UPPER(REPLACE(MiddleName, '.', '')) AS ForeName
FROM AdventureWorks2014.Person.Person
WHERE MiddleName NOT LIKE '% %'
      AND MiddleName IS NOT NULL
      AND LEN(REPLACE(MiddleName, '.', '')) > 3;
GO

This produces a distinct list of first names that are at least three characters long and do not contain spaces. Without the size qualification, the risk would be that matching against such a list would produce a huge number of false positives.

I would use the query with the SQL Server bcp utility to produce a file of the results.

bcp "SELECT ForeName FROM Person.ForeNameExtraction ORDER BY ForeName" queryout "c:\code\FirstName.txt" -c -T -r0x0A -SMyDbServer

Note that -r0x0A gives an LF character as the row terminator to match the output used by Apache Tika.

Reformatting Apache Tika Output

To aid the matching process, the output from Apache Tika must be reformatted. Either Bash or PowerShell is adequate for the tasks required, as the output from each stage can be piped into the next.

As Windows 10 now supports Linux, and I work in a multi-platform environment, I prefer Bash.

Stage

Bash

Change all white space to LF

sed ‘s/\s/\n/g’

Change output to upper case

tr ‘[a-z]’ ‘[A-Z]’

Remove empty lines

sed ‘/^$/d

Sort output in case-insensitive mode

sort -f

When put together, the command line would appear as shown below.

cat output.txt |sed 's/\s/\n/g'|tr '[a-z]' '[A-Z]'|sed '/^$/d'|sort -f >sorted_output.txt

Matching Apache Tika Output to the Dictionary of First Names

Both the Apache Tika sorted_output.txt and our FirstName.txt file share the following characteristics.

  • Output is in upper case

  • Output is sorted in alphabetic sequence

  • Record terminators are an LF character

This allows me to use the bash join command, and then wc to count the number of matches.

join -1 1 -2 1 <(cat FirstName.txt) <(cat sorted_output.txt )|wc -l

However, this did produce an error as well as a count:

join: /dev/fd/63:405: is not sorted: J PHILLIP
23826

The error is due to differences between the character sets, and the way that the database sorts its records. This can be fixed by piping the output for both through the sort utility:

join -1 1 -2 1 <(cat FirstName.txt|sort -f) <(cat sorted_output.txt|sort -f )|wc -l

This produces a count of 23,850, which clearly indicates that a lot of first names have been found.

We can compare this to the of the original number of lines output by Apache Tika, which is 39,952.

cat output.txt |wc -l

I could also count the number of unique name matches against my dictionary:

join -1 1 -2 1 <(cat FirstName.txt|sort -f) <(cat sorted_output.txt|sort -f)|uniq|wc -l

Matching Apache Tika Output to a RegEx Pattern

We can also use the egrep utility to search for text patterns that could be email addresses.

cat sorted_output.txt |egrep "^[A-Za-z0-9]+@[A-Za-z0-9-]+\."|wc -l

If we wanted to search for a pattern matching a UK postal code, then at the point where we converted all white space to new-lines characters, we would have to be explicit in converting just tab characters. This would be to avoid splitting the first and second half of the postal code.

Running the Tika Program

All the steps described so far can be assembled into a simple bash script, CheckFileWithTika.sh, with minor error checking.

#!/bin/bash
export LC_ALL='C' # Forces all programs to output using the default language and use the same bytewise sort 
FileToCheck=$1 # It is easier to read code with named arguments 
SortedOutputFileName=sorted_output_$(uuidgen).txt # Make a filename unique to this run
if [ $# -eq 0 ]; then
        echo -e "\033[31mERROR: NO ARGUMENT SUPPLIED: \033[93mExpected a fully qualified filename\033[0m"
        exit
fi
if [ ! -f $FileToCheck ]; then
        echo -e "\033[31mERROR File \033[93m$FileToCheck \033[31mdoes not exist\033[0m"
        exit
fi
java -jar tika-app-1.18.jar -t $FileToCheck|sed 's/\s/\n/g'|tr '[a-z]' '[A-Z]'|sed '/^$/d'|sort -f >$SortedOutputFileName
fore_name_score=$(join -1 1 -2 1 <(cat FirstName.txt) <(cat $SortedOutputFileName )|wc -l)
email_score=$(cat $SortedOutputFileName |egrep "^[A-Za-z0-9]+@[A-Za-z0-9-]+\."|wc -l)
echo -e "\033[31mFile $FileToCheck matches $fore_name_score fore names and $email_score email addresses\033[0m"
# Clean up after the run.
rm $SortedOutputFileName

The strange syntax in the echo statements controls the colour of the text echoed to the screen. The echo -e ensures that escape sequences in the output text are honoured. Otherwise, they are treated as literals. The \033[31m sets the output text to red. This notation is more widely supported than the \e[31m that is also supported in Ubuntu.

Parallelising the Script Execution

The reason I use the uuidgen utility to give a unique filename for each run of the script is that Linux has one last gift to offer us. If we wanted to run our CheckFileWithTika.sh script for every spreadsheet in a directory, in parallel, then we could use a command similar to the one below.

ls *.xls* | xargs -n1 -P4 -I{} CheckFileWithTika.sh {}

In the example above, the output from the ls command (the Linux equivalent of dir) is piped into xargs:

  • n1 tells xargs to use only the first item from each ls output as the argument

  • -P4 tells xargs we want to run four sub-processes in parallel

  • -I{} tells xargs that we want to use {} as a place marker to inject our argument

Challenges with the Apache Tika Approach

The approach described in this article should be regarded as a suitable smoke test, to see if a file might contain GDPR sensitive data. The table below summarizes some of the challenges with this approach:

Challenge

Description

Mitigation

Network bandwidth and IO

A legacy file share has thousands of folders, millions of files and data volumes measured in terabytes if not exabytes.

Scanning such content is extremely expensive in terms of CPU, network and disk utilization

Limit the scanning of files in a directory to a specific threshold. Once potential GDPR sensitive data has been found up to that threshold note the directory as suspect and move to the next.

Consider using dedicated hardware. The Apache Tika process does not need to e ultra-resilient, multi-user or even have particularly high performance. A commodity PC with large local storage may be sufficient.

Such a machine will be significantly cheaper than a €20million fine.

Security permissions

Corporate files shares may have extremely sensitive information on them. Consider HR and Finance department concerns.

To limit the exposure and escalation of privileges necessary to allow a scan to take place a dedicated machine in a secure location with limited access may be necessary.

Security credentials

Some files may be protected by passwords

Apache Tika does have the facility to inject a password in order to read a file. However, this would require a means of matching files to passwords and being able to inject them as part of the process.

ZIP files

ZIP files contain many files

The ZIP files can be extracted provided they are not password protected.

Limitations of Apache Tika

Apache Tika can freeze when processing very large files and in particular those that contain embedded images.

Both Bash and PowerShell are able to filter files by type and size.

The process could be run in an iterative manner for specific types and sizes of files.

Match accuracy

The match is only as good as the dictionary or pattern we supply

Consider the approach indicative rather than definitive.

The post Exhuming the GDPR Bodies appeared first on Simple Talk.


from Simple Talk https://ift.tt/2MjxfdT
via

Wednesday, September 5, 2018

Using WITH in an IF Condition

I am in the middle of working on my DB Design conference that occurs in a bit over a week from now. But I had this come up in some work I was doing and wanted to put it down in a blog.

One of the most exciting features of SQL Server 2005 was the inclusion of Common Table Expressions (CTE). Code that often needed a tangle of temp tables could be now be done in a single query (Derived tables can be used too, but I can’t remember when derived tables started in SQL Server, but it may have been 2005, or perhaps 2000).

The problem is, often you want to write a query to look for bad data, fix the bad data in the table, then use the same base query in a procedure/trigger or testing/validation code. If you have used a CTE in your query, this can sometimes be tricky as they cannot be used in a conditional like IF EXISTS (queryWithCTE).

For example, say your query was the following (using WideWorldImporters), where you want to make sure that a customer only ordered one size of product (this predicate is clearly senseless (and no data meets this requirement), but uses it WWI data which is simple and something that everyone can easily attain and fiddle with.) So, you might write the following query:

WITH CustomerOrderedSizes AS (
SELECT DISTINCT Customers.CustomerID, StockItems.Size
FROM  Sales.Customers
                JOIN Sales.Orders
                        ON Orders.CustomerID = Customers.CustomerID
                JOIN Sales.OrderLines
                        ON OrderLines.OrderID = Orders.OrderID
                JOIN Warehouse.StockItems
                        ON StockItems.StockItemID = OrderLines.StockItemID
WHERE StockItems.Size IS NOT NULL
)
SELECT CustomerId, COUNT(*)
FROM   CustomerOrderedSizes
GROUP BY CustomerOrderedSizes.CustomerID
HAVING COUNT(*) > 1;

Note: There is another, simpler way to write this query using COUNT(DISTINCT Size) in a HAVING clause without the CTE. The technique to find duplicates is not the point of this article, it is the technique of using a query that needs WITH in it in a conditional, and a real example would be a lot more complex to build (this query is unwieldy enough).

This finds that there are customers who have ordered more than one size (in fact that is the case for every customer in this database that ordered products that record a size). So you might clean up the data, and in your code, want to stop them from doing it again. More than once I have they tried to take the query I have written with the CTE, shove it in an IF EXISTS() construct, not even thinking whether it would run:

IF EXISTS (
WITH CustomerOrderedSizes AS (
SELECT DISTINCT Customers.CustomerID, StockItems.Size
FROM  Sales.Customers
                JOIN Sales.Orders
                        ON Orders.CustomerID = Customers.CustomerID
                JOIN Sales.OrderLines
                        ON OrderLines.OrderID = Orders.OrderID
                JOIN Warehouse.StockItems
                        ON StockItems.StockItemID = OrderLines.StockItemID
WHERE StockItems.Size IS NOT NULL
)
SELECT CustomerId, COUNT(*)
FROM   CustomerOrderedSizes
GROUP BY CustomerOrderedSizes.CustomerID
HAVING COUNT(*) > 1)
THROW 50000,'Customers can only order one size, for some weird reason',1;

Only to be greeted with:

Msg 156, Level 15, State 1, Line 18
Incorrect syntax near the keyword 'WITH'.
Msg 102, Level 15, State 1, Line 32
Incorrect syntax near ')'.

If, like this query, you only have one, non-recursive CTE, the query could be easily rewritten with the CTE in a derived table such as:

SELECT …
FROM   (<CTE CODE>) as CTEName
…

But often the query may have a CTE that has multiple parts, each referencing the previous CTE, and perhaps one or more of the CTEs being referenced multiple times. This cannot easily be rewritten. Instead, you can use the SQL statement to assign a value to a variable. In its simplest form, that might be either 1 or 0. For In the following format:

DECLARE @condition bit = 0;
WITH CheckThis AS (
        SELECT 1 AS Value --1 for fail, 0 for succeed
        )
SELECT TOP (1) @condition = 1 --if one row matches the criteria, then it should fail, so TOP 1
FROM   CheckThis 
WHERE  Value = 1;
IF @condition = 1
        THROW 50000,'Failed', 1;

This lets you keep the CTE oriented code and catch that at least one value has failed (which is to say, has succeeded from the query’s point of view). So expanding this to my previous example, the query would look like the following:

DECLARE @condition bit = 0;

WITH CustomerOrderedSizes
AS (SELECT DISTINCT
           Customers.CustomerID, Size
    FROM   Sales.Customers
           JOIN Sales.Orders
               ON Orders.CustomerID = Customers.CustomerID
           JOIN Sales.OrderLines
               ON OrderLines.OrderID = Orders.OrderID
           JOIN Warehouse.StockItems
               ON StockItems.StockItemID = OrderLines.StockItemID
    WHERE  Size IS NOT NULL)
SELECT   TOP(1) @condition = 1
FROM     CustomerOrderedSizes
GROUP BY CustomerOrderedSizes.CustomerID
HAVING   COUNT(*) > 1;

IF @condition = 1
    THROW 50000, 'Customers can only order one size, for some weird reason', 1;

You can test that it works by changing the HAVING clause to = 1, as there are no customers that have ordered a single size. No error message will be thrown.

Lastly, if you really want to get a bit more interesting with your error messages, you can grab some information in the query, for example a customer name that violated the rules. Also, to tell if multiple violations have occurred, instead of TOP (1), get TOP(2) and if the rowcount <> 1, you can know that multiple rows fail the check.

DECLARE @condition bit = 0, @CustomerName nvarchar(100), @rowCount int = 0, @msg nvarchar(1000);
WITH CustomerOrderedSizes AS (
SELECT DISTINCT Customers.CustomerID, Size
FROM  Sales.Customers
                JOIN Sales.Orders
                        ON Orders.CustomerID = Customers.CustomerID
                JOIN Sales.OrderLines
                        ON OrderLines.OrderID = Orders.OrderID
                JOIN Warehouse.StockItems
                        ON StockItems.StockItemID = OrderLines.StockItemID
WHERE size IS NOT NULL
)
SELECT TOP (2) @condition = 1, @CustomerName = MAX(CustomerName) --if there are more than one, that's enough to know there are multiples
FROM   CustomerOrderedSizes
                JOIN Sales.Customers
                        ON Customers.CustomerID = CustomerOrderedSizes.CustomerID
GROUP BY CustomerOrderedSizes.CustomerID
HAVING COUNT(CustomerOrderedSizes.Size) > 1;
SET @rowCount = @@ROWCOUNT;
IF @Condition = 1
 BEGIN
        IF @rowCount = 1
                SET @msg = 'Customer: ' + @CustomerName + ' ordered > one size';
        ELSE
                SET @msg = 'Multiple customers ordered > one size. Example Customer: "' + @CustomerName + '"';
        THROW 50000,@msg,1;
 END;

Now you have an error message that gives you a meaningful place to look, AND indicates at least one example for you to check (you could use the PK of the customer to pass to an application in your error message.

This returns:

Msg 50000, Level 16, State 1, Line 30
Multiple customers ordered > one size. Example Customer: "Can ozcan"

Note that I still used the @condition variable, rather than using rowcount, or the name of the customer. Rowcount is not a bad choice, but it is easy for some other coder to inadvertently mess up fetching the rowcount, because you have to get @@ROWCOUNT in the very next statement or it can be cleared. CustomerName is tricky too, because you need to make sure that you pick a value that CustomerName can never be. Maybe NULL? Seen it. A customer named ‘’, possible if you do not have constraints to prevent empty data. So using a common variable that you trust to be set by a literal just feels safer, and adding on error message stuff is less dangerous in the long run. It all seems kind of annoying until it is 3 in the morning and you get an error message that you don’t have a value to start looking for in your source query.

Now, if we could just get a few horrifying error messages from SQL Server to do the same. I am looking at you truncation message:

Msg 8152, Level 16, State 4, Line 1
string or binary data would be truncated.

The post Using WITH in an IF Condition appeared first on Simple Talk.


from Simple Talk https://ift.tt/2wGcqn7
via

Tuesday, September 4, 2018

Questions About HIPAA That You Were Too Shy to Ask

The Health Insurance Portability and Accountability Act (HIPAA) has been around since 1996. It is designed to protect patient’s confidentiality. Title II (Administration Simplification) which contains the Privacy Rule, Enforcement Rule and the Security Rule, centres around data management, privacy and protection. To be in breach of HIPAA can be expensive and even earn you some jail time (in the worst cases).

  1. Why HIPAA?
  2. Does HIPAA apply to organisations outside the United States?
  3. What is ‘protected health information’?
  4. What constitutes a breach under HIPAA?
  5. What happens if there is a breach?
  6. Why is data protection suddenly becoming important?
  7. What rights does HIPAA give to the individual?
  8. Does HIPAA affect the way we do development work?
  9. What are the risks i should consider?
  10. Is HIPAA JUST about health data? What about non-medical PII data?

1.Why HIPAA?

The Healthcare Insurance Portability and Accountability Act was originally signed into law to “improve the portability and accountability of health insurance coverage” for employees between work. The Privacy and Security rules were signed in shortly after to protect “any information held by a covered entity which concerns health status, the provision of healthcare, or payment that can be linked to an individual”. Other aims of the HIPAA were to tackle waste, fraud, and abuse of health insurance and healthcare provision.

2.Does HIPAA apply to organisations outside the United States?

In short- no. HIPAA is applicable to healthcare organisations within the US. Their data is mandated by the requirements of the organisation. Even if the people are not us citizens, if they are in a US healthcare system they are also protected. If we consider the reverse, US citizens outside the US, if they are part of a non-us healthcare organisation, they are not covered by HIPAA.

3.What is ‘protected health information’?

Protected Health Information (or PHI) is any “individually identifiable health information” held or transmitted by a covered entity or business associate. This can be in any form- electronic, paper or even oral. This is information that relates to an individual’s past, present or future physical or mental health or condition and the provision of the healthcare to the individual or payments relating to the health care of the individual.

HIPAA lists a number of common “identifiers” to make things a bit simpler:

  • Names
  • Geographic info (this goes into some detail- so for further information on this particular identifier check out this article).
  • Dates
  • Telephone numbers
  • Fax numbers
  • Vehicle identifiers and serial numbers
  • Device identifiers
  • Emails
  • URLs
  • Social security numbers
  • IP addresses
  • Medical record numbers
  • Biometric identifiers (including finger prints/voice prints)
  • Health Plan beneficiary numbers
  • Full face photographs
  • Account numbers
  • Any other unique identifying number, characteristic, code
  • Certificate/license numbers

4.What constitutes a breach under HIPAA?

A breach under HIPAA means the acquisition, access, use, or disclosure of PHI in a manner not complying with HIPAA, which compromises the security or privacy of the PHI. This is an extremely broad definition that might make you feel as though even smelling data could land you in trouble. Some examples of HIPAA breaches include: failing to give patients access to their PHI, unprotected storage of PHI (which can lead to laptops or USB sticks being stolen with unsecured PHI*), not logging off your computer/computer system that includes PHI, violation of the “minimum necessary requirement”, PHI in an email sent over the internet.

*Unsecured PHI means PHI that is not rendered unusable, unreadable, or indecipherable to unauthorised persons through the use of technology or methodology.

To narrow the scope a bit, HIPAA has specified what’s NOT a breach by listing the three exceptions:

  1. If an unintentional breach (acquisition, access, or use only) of PHI was made in good faith and within scope of authority and does not result in further use or disclosure.
  2. Any inadvertent disclosure by a person who is authorized to access PHI at a covered entity or business associate to another person authorized to access PHI at the same covered entity or business associate, or organized health care arrangement in which the covered entity participates, and the information received as a result of such disclosure is not further used or disclosed
  3. A disclosure of PHI where a covered entity or business associate has a good faith belief that an unauthorized person to whom the disclosure was made would not reasonably have been able to retain such information.

The only other exemption for a breach is if it can be demonstrated that there is a low probability that the PHI has been compromised based on a risk assessment to which there are four factors: the likelihood of re-identification/types of identifiers, the unauthorized person to whom the breach was made, whether the PHI was actually acquired or viewed, and to what extent the risk to PHI has been mitigated.

5.What happens if there is a breach/violation?

First thing- stop the breach asap. Ensure whatever caused the breach is fixed immediately.

Following a breach, covered entities and business associates must provide notification of the breach to the HSS (U.S Department of Health & Human services), individuals affected and, in some cases, the media. Notifications must be made without unreasonable delay and no later than 60 days following the discovery of the violation.

The penalties for a breach under HIPAA vary depending on the circumstances of the leak, and the volume of violations. For unknowingly violating HIPAA it is $100 per violation, but in the extreme cases covered entities and individuals who violate under false pretences it is $100,000 fine (up to $1.5 MILLION for repeat violations) and up to 10 years in prison.

Fines are issued by the Office for Civil Rights (OCR).

6.Why is data protection suddenly becoming important?

Due to a number of high profile scandals, the public are becoming more and more aware of their rights to protection of their privacy and data. The eventual consequences of those data breaches to the public can in some cases be catastrophic, for example- fraud. As such support for more stringent legislation has dramatically increased, which is why we have HIPAA and others like SOX, GDPR, SHIELD and CaCPA. The age of technology has made it all too easy to share and discover information- so not only can data be found but also lost and circulated faster than ever before.

7.What rights does HIPAA give to the individual?

Ultimately HIPAA is designed so individuals have easy access to their health information and have more control on the decision regarding their health care. Individuals have legal and enforceable right to see and receive copies upon request of the information in their medical and other health records maintained by their health care provider and health plans.

Patients are also able to designate a personal representative (who might already have authority to make health care decisions for the individual) who also then has the right to access PHI.

8. Does HIPAA affect the way we do development work?

The Privacy rule addresses how patient information can be used and disclosed. In the Minimum Necessary Requirement, it states that covered entities are required to evaluate their practices and enhance safeguards as needed to limit unnecessary or inappropriate access to and disclosure of protected health information. For development we can assume this means that it is no longer appropriate to be working with real data. Data retention is similarly a key part of HIPAA- individuals have the right to access information at any time. Whilst there is no HIPAA medical records retention period outlined, there is a requirement for other HIPAA-related documents (such as but not limited to; logs recording access to and updating of PHI, Authorizations for the disclosure of PHI, IT Security system reviews) to be kept for a minimum of six years from when the document was created or when it was last in effect. This is outlined in CFR §164.316(b)(1).

9.What are the risks I should consider?

Where is the data being stored, received, maintained or transmitted? Who has access to it? Is it controlled? These questions might seem obvious, but data is the biggest risk to your compliance. Organisations need to be very clear where, why, and how PHI is stored, who has access, and what exactly happens to this data. It’s important to keep an audit trail of all activity around the records to be able to prove your compliance. It is also worth identifying and addressing potential threats to your PHI. Become proactive rather than reactive in those vulnerabilities. Consider your network security, training members of staff and reducing access points to PHI internally.

10. Is HIPAA JUST about health data? What about non-medical PII data?

PHI is any “individually identifiable health information” held or transmitted by a covered entity or business associate. You can refer to the answer in question 3 for more details about what PHI is. The identifiers listed in question 3 include data examples that are not specifically health related (example: names, emails, telephone numbers etc), however when combined with health information about that person, make such information PHI. Therefore, non-medial PII data still needs to be protected under HIPAA.

Please note: HIPAA is a complex piece of legal legislation. Your organisation is responsible for understanding the full requirements. This article summarises some of the details, but further research is always recommended when ensuring full compliance.

The post Questions About HIPAA That You Were Too Shy to Ask appeared first on Simple Talk.


from Simple Talk https://ift.tt/2NL1USZ
via

Thursday, August 30, 2018

10 Best Practices for Writing Oracle SQL

Writing efficient and high-quality SQL is hard to do. Sometimes it comes down to trialling different types of queries to get one that gives you the results you want and has good performance. There are a range of ‘best practices’ or tips that are recommended for working with SQL. Many of them relate to SQL overall, and some of them are specific to Oracle SQL. In this article, I’ll explain ten of the Oracle SQL best practices to help improve your SQL queries.

1. Use ANSI Joins Instead of Oracle Joins

In Oracle SQL, there are two ways to join tables. You might be familiar with the ANSI method, which involves using JOIN keywords between tables:

SELECT emp.*, dept.*
FROM emp
INNER JOIN dept ON emp.dept_id = dept.id;

You can also do outer joins such as a LEFT JOIN:

SELECT emp.*, dept.*
FROM emp
LEFT JOIN dept ON emp.dept_id = dept.id;

There is another method which is occasionally referred to as an Oracle join, because the syntax is Oracle-specific. An inner join is done using the WHERE clause:

SELECT emp.*, dept.*
FROM emp, dept
WHERE emp.dept_id = dept.id;

An outer join is done by placing a (+) on the WHERE clause after the column that NULLs are allowed. For example, a LEFT JOIN can be written as:

SELECT emp.*, dept.*
FROM emp, dept
WHERE emp.dept_id = dept.id(+);

A RIGHT JOIN can be written by putting the symbol on the other side of the join:

SELECT emp.*, dept.*
FROM emp, dept
WHERE emp.dept_id(+) = dept.id;

The recommendation with writing joins is to use the ANSI style (the JOIN and ON keywords) rather than the Oracle style (the WHERE clause with (+) symbols). I’ve written about this before in my guide to joins in Oracle, and there are a few reasons for this:

  • In large queries, it’s easy to forget to add a WHERE clause to join a table, causing unnecessary cartesian joins and incorrect results
  • The WHERE clause should be used for filtering records, not for joining tables together. A subtle difference, but it makes the query easier to understand
  • ANSI joins are arguably easier to read, as you can see which section is used for joins and which is used for filtering data.

2. Avoid WHERE Clauses with Functions

Another recommendation for working with Oracle SQL is to avoid writing WHERE clauses that use functions. In SQL, WHERE clauses are used to filter the rows to be displayed. These are often used to check that a column equals a certain value:

WHERE status = ‘A’

You may have a need to compare a column to a value that has used a function. For example:

WHERE UPPER(last_name) = ‘SMITH’

Another example could be:

WHERE ROUND(monthly_salary) > 2000

Using functions on columns in the WHERE clause should be avoided. This is because any indexes that are created on the columns themselves (e.g. last_name or monthly_salary) will not be used if a function is applied in the query, which can slow the query down a lot.

To avoid using a function on a column, consider if there’s a way to write the WHERE clause without the function. Sometimes there is, but other times you need to write the function.

If you do need to have the function on the column in the WHERE clause, consider creating a function-based index on the column. This is a type of index that is created on the result of a function applied to the column, which could be used in this query.

3. Use CASE Instead of Multiple Unions

I’ve seen several examples of queries that are looking up a range of records based on criteria. The criteria are more than just a simple WHERE clause, and depending on different types of records, the joins and other criteria might be different.

This is often implemented as several SELECT queries joined together using UNION or UNION ALL keywords. For example:

SELECT id, product_name
FROM product
WHERE status = ‘X’ AND created_date < TO_DATE(‘2017-01-01’, ‘YYYY-MM-DD’)
UNION ALL
SELECT id, product_name
FROM product
WHERE status = ‘A’ AND product_series = ‘WXT’;

This is a simple example, but often the different queries may include joins or lookups to other tables.

Structuring a query like this means that the tables need to be queried several times (once for each SELECT query), which is quite inefficient. There is a chance that your table will have an index on it to make it run more efficiently, but there is another method that’s worth trying. Rather than having separate queries with UNION ALL, try putting the logic inside a CASE statement inside a single SELECT:

SELECT id, product_name
FROM (
SELECT id, product_name,
CASE
WHEN status = ‘X’ AND created_date < TO_DATE(‘2017-01-01’, ‘YYYY-MM-DD’) THEN 1
WHEN status = ‘A’ AND product_series = ‘WXT’ THEN 1
ELSE 0 END AS prodcheck
FROM product
) sub
WHERE prodcheck = 1;

This query would only run once on the product table and will show the same results as separate SELECT queries with a UNION ALL.

The logic to show the right records is in the CASE statement. There are several lines, one for each set of criteria, and it returns a 1 if a match is found. This logic is all inside a subquery, and the outer query filters to show only those records where that CASE is 1.

There are a few different ways to write the CASE statement, but the idea is to only have the main query and several criteria in the CASE statement, rather than separate queries. However, make sure you test both versions of the query for performance, as there may be indexes that are used with the UNION query that don’t run with the CASE query.

4. Minimise the Use of DISTINCT

The DISTINCT keyword in SQL allows you to return unique records in the result set by eliminating duplicate results. This seems simple, and it’s a useful command. Using DISTINCT is OK in many cases, however, it can be a symptom of a different issue. If your result set is displaying data from many different tables, you might end up getting some duplicate results. I’ve seen this many times in my queries.

It can be tempting to add a DISTINCT keyword to ensure you don’t get duplicate records. But adding a DISTINCT keyword will likely cause an expensive operation to be performed on your query, slowing it down. It will give you the results you need, but it’s masking a problem elsewhere. It could be from an incomplete JOIN, or incorrect data in a table, or some criteria you aren’t considering, which is causing the duplicate row. Fixing the issue in your query or in your data is the right solution.

5. Redesign Data Value Lists to Use Tables

Occasionally you may need to write queries that use several values as criteria. This is often done as a WHERE clause and an IN keyword:

SELECT *
FROM product
WHERE status IN (‘A’, ‘P’, ‘C’, ‘S’);

This query might give you the results you want. What would happen if the status values change at some point in the future, or the business rules change which means you need to adjust this list.

If this list is coded into your query, you’ll need to adjust your query. This may result in change in application code and a deployment process.

Another way to do this is to store the values in a separate table and join to this table. For example, you could have a status_lookup table which has values and categories in it, where the category defines the data you need.

Your query could then be something like this:

SELECT product.*
FROM product
INNER JOIN status_lookup ON product.status = status_lookup.status
WHERE status_lookup.category = ‘ACTIVE’;

This way, whenever the business rules change, all you need to do is update the data in your status_lookup table, and no code changes are required. This recommendation was also suggested in the article on SQL Code Smells.

6. UNION ALL instead of UNION

There are two similar keywords in SQL that are used to combine results: UNION and UNION ALL. They are called ‘set operators’, as they work with result sets.

There are some minor differences between them. UNION ALL shows all records in both result sets, and UNION shows all records excluding duplicates.

Just to be clear, UNION removes duplicates and UNION ALL does not.

This means, in Oracle, that an extra step is performed when using a UNION to remove all duplicate rows from the result set after it is combined. It’s the same as performing a DISTINCT.

If you really need duplicates removed, then use UNION. But, if you only want to combine values and don’t care about duplicates, or want to see all values, then use UNION ALL. Depending on your query, it will give you the same results and also perform better as there is no duplicate removal.

7. Use Table Aliases

A great way to improve your queries is to use table aliases. Table aliases are names you can give to tables in your queries, to make them easier to write and work with. For example, using our earlier query on product and status_lookup tables, this is what it looks like without a table alias:

SELECT product.*
FROM product
INNER JOIN status_lookup ON product.status = status_lookup.status
WHERE status_lookup.category = ‘ACTIVE’;

You can add table aliases by specifying a name after the table name. These table aliases are usually short (one or a few characters), and are usually an abbreviation for the full table name:


SELECT p.* FROM product p INNER JOIN status_lookup s ON p.status = s.status WHERE s.category = ‘ACTIVE’;

The table alias of p for product and s for status_lookup are included with the tables in the query. Then, anytime you refer to those tables (in the SELECT clause, the JOIN, or the WHERE clause), you can use the table alias. It makes it easier to read and write.

Also, p and s were deliberately chosen as they are abbreviations for the full table name. This is a good practice to use, especially when working on larger queries, rather than using generic letters such as a or b. It’s much easier to tell which table a field comes from if you use a descriptive alias.

8. Only Use HAVING on Aggregate Functions

The HAVING clause in Oracle SQL is used to filter records from your result set. It’s very similar to the WHERE clause. However, the WHERE clause filters rows before the aggregate functions are applied, and the HAVING clause filters rows after the aggregate functions are applied. It can be tempting to use HAVING for everything if you’re using an aggregate function, but they do different things in your query.

For example:

SELECT status, COUNT(*)
FROM product
WHERE status IS NOT NULL
GROUP BY status
HAVING COUNT(*) > 1;

This will find the count of each product status that is not NULL where there is more than one record for the status, which is likely what you want. If you write the query using only the HAVING clause, it would look like this:

SELECT status, COUNT(*)
FROM product
GROUP BY status
HAVING status IS NOT NULL
AND COUNT(*) > 1;

This may give you different results, depending on your data. It may also perform worse, as it needs to aggregate all of the data before removing it using the HAVING clause. It also implies a different set of rules.

Be sure to only use HAVING on aggregate functions and use WHERE on results you want to restrict before the aggregate.

9. Always Specify Columns in INSERT Statements

The INSERT statement in Oracle SQL has an optional component where you specify the columns to insert data into:

INSERT INTO tablename (col1, col2… col_n)
VALUES (val1, val2… val_n);

The part of the INSERT statement with the columns is the optional part. An INSERT statement without the columns will still work:

INSERT INTO product VALUES (1, ‘Large Chair’, 120.00);

However, a good habit to get into is to specify the columns in an INSERT statement. This has several benefits. First, it can prevent errors or data going into the wrong column. Without specifying the columns, there’s no guarantee which order the columns will be inserted into. This can cause errors to appear, or the data to be inserted with values in the wrong columns.

It’s also clear which columns represent which values. When you look at a statement without the columns, you’ll have to guess what the values are. If you add the columns, you know exactly which values are for each column.

Be sure to include the columns in your INSERT statement.

10. Avoid Object Names with Spaces

The final best practice I’ll recommend is to avoid using spaces in your object names. Many examples of SQL online specify object names (such as tables) that include spaces. Most of these examples are for Microsoft Access or SQL Server and include either square brackets or quotes around table names:

SELECT id, category_name
FROM “Product Category”;

Using a table name with a space in it might be easier to read. However, it can cause several issues. Table names in Oracle are stored in upper case, or if they have quotes, they are stored as you enter them. This means whenever you refer to this table, you’ll need to use quotes and specify it as it was written. It’s inconvenient for you and for other developers.

Another reason is that it’s harder to refer to this table in queries. You’ll have to specify it with quotes, and probably need to use a table alias to ensure your queries are correct.

It’s much better to specify the object names without spaces. You can use underscores instead:

SELECT id, category_name
FROM product_category;

You should follow your team’s naming conventions, which would include tables and other objects, which has been written about here.

From Oracle 12c, the maximum length for an object name was increased from 30 characters to 32,000 characters. This means you’ll have a lot more room to come up with a great name for a table. This doesn’t mean you should be excessive, but just choose a name that represents what you are creating, without using spaces.

Summary

So, there are my top 10 best practices for working with Oracle SQL. Some of them are applicable to all types of SQL, but many of them are Oracle specific.

The post 10 Best Practices for Writing Oracle SQL appeared first on Simple Talk.


from Simple Talk https://ift.tt/2LG5mfJ
via